The stock market prices in peace in the Middle East – Fat Tail Daily


Will the conflict between Israel and Iran escalate? Today, I present my views on why it could de-escalate sooner than many are made to believe.
Just how does a fight between two people turn into an all-out brawl that gets out of hand?
An argument gets heated, someone is triggered, then one punch, and a counterpunch. Thus begins a fight.
What happens from here depends on how the others behave.
The friends of the two who are fighting might try to persuade them to stop, or even pull them away from each other. After a while, the tension eases.
Or the friends stick up for their own and tell the other side to back off, even taking on a fighting posture. A misguided shove or swipe might lead to another punch-up.
You get the idea.
What’s the point I’m getting at?
I’m talking about the recent flareups in different parts of the world – Russia and Ukraine, Israel and Palestine, India and Pakistan, and most recently Israel and Iran.
The first two have been ongoing. The other two have been on our headlines recently.
There are fears that these conflicts could become something bigger, potentially leading to World War 3.
But let me stick my neck out on this one.
I’m of the view that the reality mightn’t be as bad as what they’re painting it on your TV screen and the internet.
And the stock market is on my side.
The conflict is real, but is it escalating?
Before I start, I want to make this clear.
I’m not weaving some hardcore conspiracy theory that the footages you’re watching are digitally generated illusions. Neither is this a live action role-play with fake blood and casualties.
No, the conflict is real. The blood is real. The tragedy is heartbreaking.
What I’m questioning is the media coverage of the conflicts and their narratives.
Day after day, what are they showing us?
Select footages of wreckage,
Specially cut clips of leaders and generals talking about their plans, and
Geopolitical analysts discussing their prognoses of the situation.
Do you believe that you will get a full picture or a manufactured narrative in a 5-10 minute news coverage?
Advertisement:
Will this no-name stock rule the ‘Aussie Mining Boom 2025’?
It’s showing all the traits, ambition and foresight that Andrew Forrest’s Fortescue Metals had in the early 2000s.
Market cap just $270 million.
And a gameplan that’s addressing many of the same challenges Fortescue Metals Group faced in the 2000s.
This very small company is about to unlock a very big deposit.
The largest of its kind IN THE WORLD.
Its potential has arrived from nowhere, busting into ‘Tier 1’ status and attracting mining behemoths…including Rio Tinto.
This has all the makings of a classic rags to riches story. Click here for the full take.
The market indicator that tells us why tensions could ease
Last Friday, I was on the road driving back from Melbourne to the Southern Highlands after spending a few days with my colleagues in our office.
Every so often, I made stops and checked the price of gold and gold stocks.
What I noticed made me think.
Gold and oil spiked in the morning as Australia woke up to the news that Israel and Iran were exchanging missiles and rockets. The markets were pricing in a war.
Gold moved to as high as US$3,440 an ounce while oil jumped to over US$75 a barrel. But after our markets closed, I noticed gold and oil started easing and continued doing so in US trading.
Come Monday, we saw a small spike in both gold and oil before they started to drop. As of this morning, oil rose again but gold remained below US$3,400 an ounce, a notch lower than late last week when things started to heat up in the Middle East.
Gold stocks behaved similarly rallying sharply late last week, with companies like Evolution Mining [ASX:EVN], Westgold Resources [ASX:WGX], and Gold Road Resources [ASX:GOR] making new highs. A few mid-tiers even increased by more than 10% during the day.
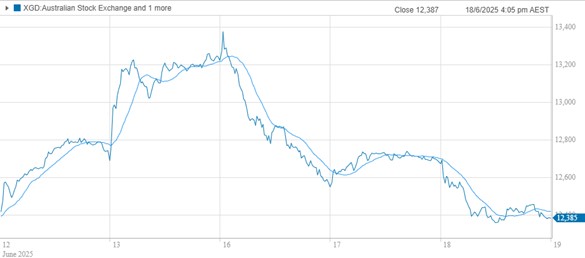
Since this week though, we’ve seen them retreat quite a bit. The ASX Gold Index [ASX:XGD] spiked on Monday to almost 13,400 points. It then gave back most of its gains since the outbreak of the conflict:
| |
| Source: CommSec |
The ASX Gold Index is now almost 8% lower than its highs at market open on Monday.
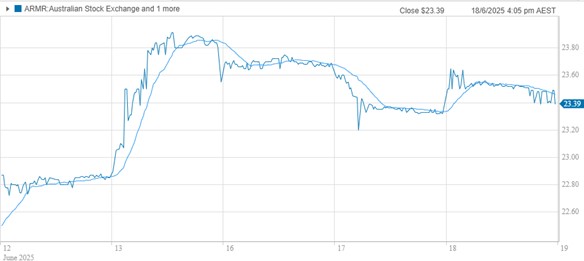
Moving on from gold, the Betashares Global Defence ETF [ASX:ARMR] shows a similar trend, gently giving back the gains from last week:
| |
| Source: CommSec |
How to read the unfolding situation
As I write this, the market is pricing in a more rational outcome than the headlines and rhetoric we’re seeing online.
All these could change suddenly.
But something crucial is missing right now that could cause the conflict to blow out further.
Just as I mentioned earlier in today’s piece, a fight escalates into an all-out brawl when others pile on. Regional conflicts similarly become a global war when other nations mobilise their forces.
The key allies of the two respective nations – the US and NATO, on one side, and Russia and China, on the other, are currently watching the situation closely. No doubt the Trump administration and the Kremlin have publicly warned about their plans to act if their interests are attacked. However, neither side’s allies have decided to send troops or participate in offensive strikes against their foes.
Should this continue, expect Israel and Iran to exchange a few more missiles to vent their anger. And hopefully, just like India and Pakistan, their spats are contained and we avert a bigger conflict.
In such times with the fog of war, I believe your best chance at reading what’s going on is to look at gold, oil, gold stocks and the defence stocks ETF. They’ll help you gauge the geopolitical landscape better than the journalists and geopolitical pundits.
To get a more detailed discussion of my reasoning and the implications on gold and gold stocks, consider checking out this video with Ausbiz host Andrew Geoghegan on Tuesday afternoon.
If you’re interested in getting started on building a precious metals portfolio to protect your wealth, sign up for my newsletter, The Australian Gold Report.
God bless,
|
Brian Chu,
Editor, Gold Stock Pro and The Australian Gold Report
Advertisement:
REVEALED:
Australia’s 60-Cent
‘Secret Weapon’
It’s a tiny ASX stock that could hand the United States, NATO, and its allies a key advantage in case another major conflict breaks out.
That could make this stock very valuable and potentially profitable for investors over the coming months.
Brian Chu is one of Australia’s foremost independent authorities on gold and gold stocks, with a unique strategy for valuing big producers and highly speculative explorers. He established a private family fund that only invests in ASX-listed gold mining companies, being one of a few such funds in Australia, putting his strategy and research skills to the test under public scrutiny. He currently writes two gold-focused investment advisories.
In his Australian Gold Report, Brian helps you build long-term wealth in physical gold and a select portfolio of hand-picked stocks comprising mainly producers with proven revenue streams and appealing risk-reward profiles. He uses his original valuation metrics and a tried-and-tested investment strategy to help you to deliver sustained outperformance against industry benchmarks.
In his more specialised Gold Stock Pro service, Brian helps readers trade some of the most exciting, speculative gold mining plays on the ASX. He uses his proprietary system — based on the famous Lassonde Curve model, which tracks the life cycle of mining stocks. His aim is to help you navigate the gold and silver cycles, and to capitalise on the bull market for opportunities to deliver outsized gains.
Brian’s Premium Subscriptions
Source link