If this is the 1970s: Then the Date is 1 November 1973 – Fat Tail Daily
Are we living in the 70s?
I can’t tell you, I wasn’t there, but it’s an interesting analogy.
The fear of inflation, the eroding value of cash, and now spiking oil prices.
Of course, nothing can repeat exactly. The event that’s said to have launched hyperinflation in the 1970s, the Yom Kippur War, only lasted 20 days.
Today’s war is now into its 26th day.
So, maybe we’re not living in the 70s, but something much worse?
But it’s not so much the war that’s important here; it’s the flow of oil.
For now, the Strait remains mostly shut except for a few renegades, like Japan.
Japan is a long-term ally of the US, yet when push comes to shove, energy matters more than friends.
Japan receives about 90 per cent of its oil shipments through this strait. It’s keen to make a deal with Iran and avoid economic calamity. That seems to be underway.
There are also reports that Iran is looking to charge vessels a $2 million ‘toll fee’ to pass through the Strait without being sunk.
Pre-War, up to 140 ships passed through the Hormuz Strait, including roughly 60 oil/gas tankers.
Capitalism is alive and well in the Iranian regime.
Assuming the daily count lifts to just a fraction of these pre-war numbers in the coming weeks, well, that could sustain Iran’s war effort against the US and Israel far longer than most anticipate.
But here we are, twenty-six days into the war and the oil flow remains pretty much shut.
So, what does 1973 tell us?
While the Yom Kippur War lasted just 20 days, oil flows to the West remained closed for far longer.
Arab producers maintained their strict oil embargo against the West for a further 5 months after the war in the Middle East.
And once oil began to flow (post-embargo), oil prices remained high.
But the consequences went far beyond that…
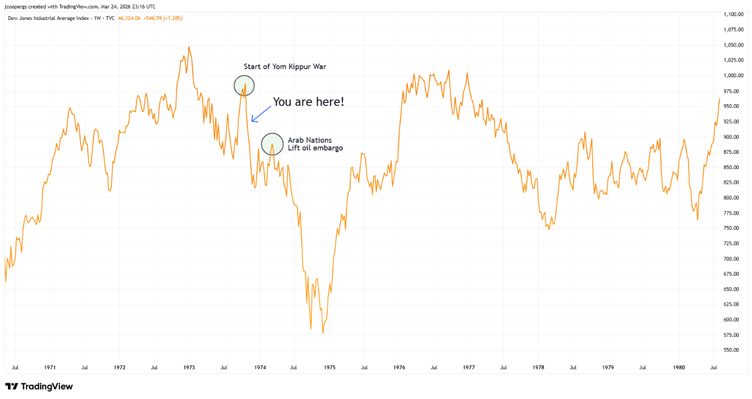
6 months after the Yom Kippur War began, the US Dow Jones Industrial Average [NYSE: DJI] fell 17% from its 1973 top.
But the real stock market crash didn’t take place until July 1974, about 8 months AFTER the start of the conflict.
From the 1973 pre-war top to the 1974 stock market bottom, the DJI fell 45%. It’s not unreasonable to assume that today’s richly valued tech-heavy Nasdaq would have fared much worse.
Source: Trading View
[Click to open in a new window]
That’s a tad frightening if we’re drawing on 1970s parallels, and it’s a risk to keep in mind.
But the outlier was commodities, particularly energy and gold.
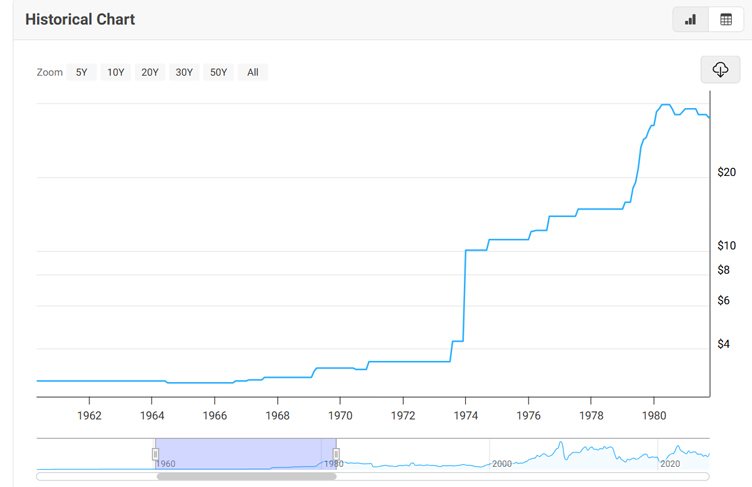
This historical chart from Macro Trends shows the price of West Texas Intermediate (WTI) crude, adjusted for inflation, throughout the 1970s:
Source: Trading View
[Click to open in a new window]
Futures traded for a measly $3.50 per barrel prewar. Postwar, they climbed above $10 per barrel.
And by the end of the 1970’s, oil was trading above $30 per barrel.
About 750% higher from the start of the decade!
Could that happen again? Let’s hope not.
Before events in Iran, oil traded at about $72 per barrel. The shock came as oil tipped past $100 per barrel, delivering a mere 40% increase.
And that was well below the 1970’s oil price shock.
So, clearly, there are differences, but that doesn’t mean you should ignore this important event and use it as a yardstick for what might lie ahead.
Until next time.
Source link