Tempur Sealy (TPX): Bedding Premiumization Offset By Headwinds In U.S. Mattress Market


PM Images/DigitalVision via Getty Images
Synopsis
Tempur Sealy International (NYSE:TPX) specialises in the design, manufacturing, and distribution of bedding products. Its portfolio of brands includes Tempur-Pedic, Sealy, and Stearns & Foster. Over the last three years, TPX’s revenue year-over-year growth has been relatively flat due to challenging macroeconomic conditions affecting its North America segment.
Additionally, rising costs caused its profit margins to contract annually as well. In 1Q24, TPX’s top line fell modestly due to the same reason, which is challenging macroeconomic conditions. However, its 1Q24 margins showed resilience. Looking ahead, the US mattress market outlook for 2024 is flat to slightly down, and this is expected to create slight headwind for TPX. On a brighter note, the US mattress market is showing signs of premiumization, which works in the favour of TPX due to its portfolio of brands. Given the mixed outlook, I am recommending a hold rating for TPX.
Historical Financial Analysis

Author’s Chart
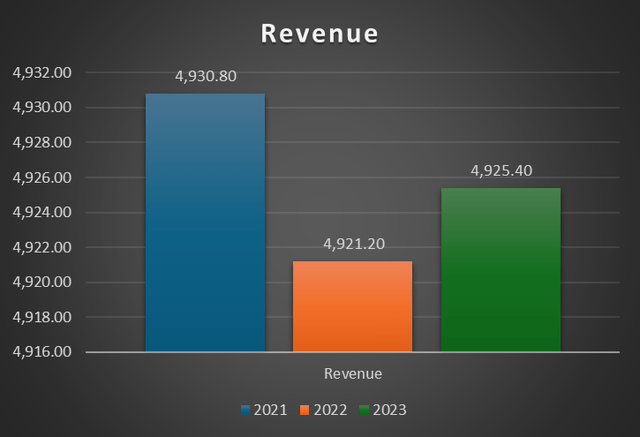
In 2022, net sales fell 0.2% to $4.921 billion from 2021’s $4.930 billion. The growth in TPX’s international segment was offset by weakness in its North America segment. International segment net sales increased by 21.5%, while North America segment sales fell by 4.7%. The decrease in the North America segment was due to challenging macroeconomic conditions.
In 2023, net sales grew 0.1% to $4.925 billion. Again, the growth in the international segment was offset by the decrease in net sales in the North America segment. In North America, the challenging macroeconomic conditions seen in 2022 continued into 2023, and they are putting pressure on US consumer behaviour. In essence, TPX has faced headwinds from macroeconomic challenges for the past two years.
Author’s Chart
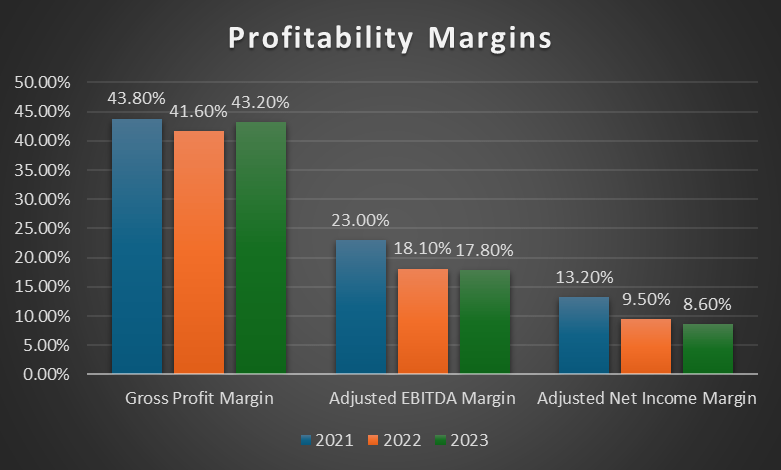
Regarding TPX’s margins, its adjusted EBITDA margin and adjusted net income margin are showing signs of contraction over the three-year period. On the other hand, its gross profit margin has remained relatively flat year-over-year.
In 2022, its adjusted EBITDA margin contracted to 18.10% from 2021’s 23%. The contraction was caused by 2022’s lower net income compared to 2021. The decrease in 2022’s net income was driven by increased cost of sales, selling and marketing expenses, and general, administrative and other expenses. Even though the adjusted EBITDA margin continued to contract in 2023, the contraction was modest at approximately 0.3%, showing signs of stabilisation.
Moving onto adjusted net income margin, it is showing the same contraction trend as adjusted EBITDA margin. For the same reason, which is rising costs, TPX’s adjusted net income margin fell from 13.20% in 2021 to 9.50% in 2022. However, in 2023, contraction was modest, as it fell to 8.6%.
First Quarter 2024 Earnings Analysis
For 1Q24, TPX’s net sales fell 1.5% to approximately $1.189 billion. Its North America [NA] business segment was down 2%, while its international business segment was flat. In the NA segment, the decrease was caused by the challenging macroeconomic conditions. As a result, it is putting downward pressure on consumer spending patterns, which ultimately affects TPX. Although net sales in the wholesale channel fell, it was offset by growth in the direct channel. This is a reflection of the strength of TPX’s e-commerce business.
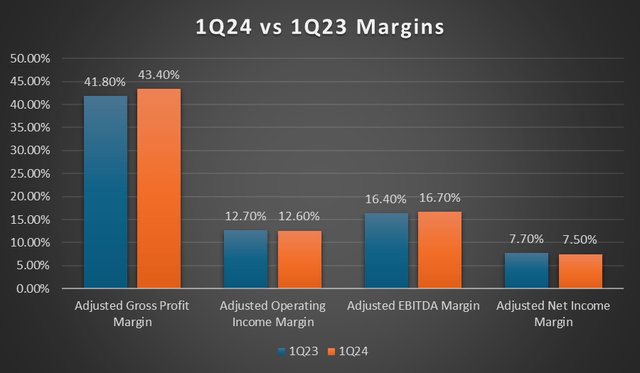
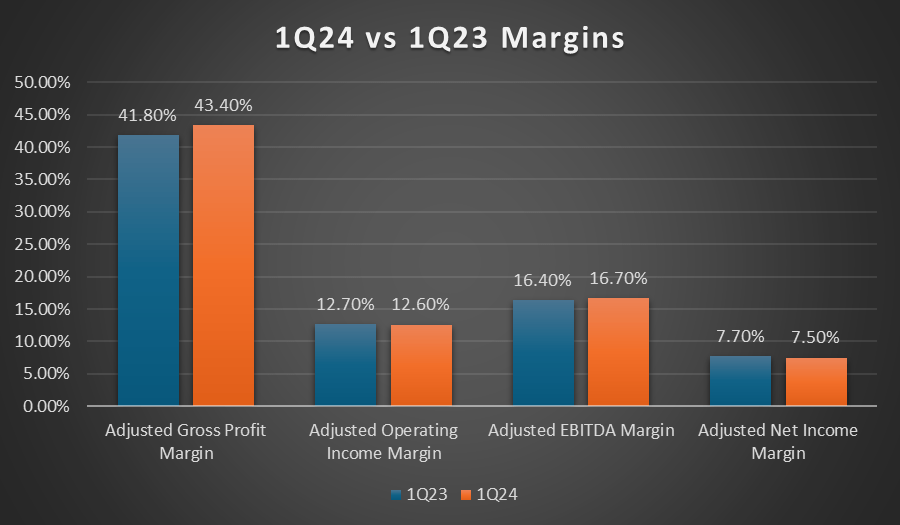
Moving onto profitability margins, TPX performed well despite the slight weakness in its top-line performance due to challenging macroeconomic conditions. Overall, all four margins remained relatively flat year-over-year. Its adjusted gross profit margin expanded slightly to 43.40%, driven by favourable commodity costs and operational efficiencies, but was partially offset by disruption caused by the production line changeover to support new OEM distribution. TPX’s adjusted operating income margin reported was 12.60%, its adjusted EBITDA margin was 16.70%, and its adjusted net income margin is 7.50%.
Author’s Chart
Headwind in US Mattress Market

Investors Relations
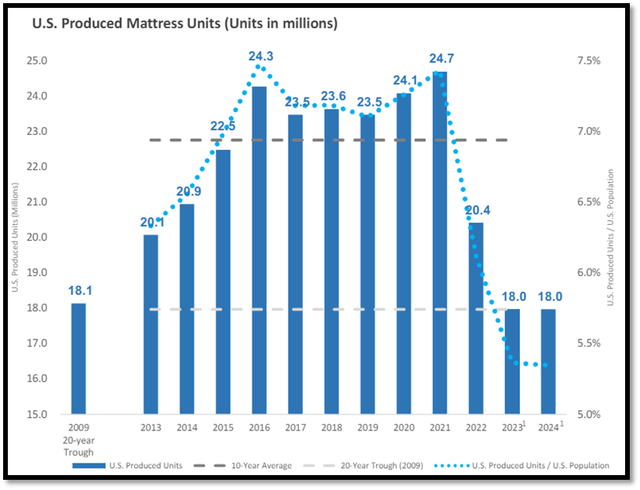
The chart above shows US mattress production over the last 10 years. From 2013 to 2021, US mattress production has been consistently growing. US mattress production peaked in 2021 with a record of 24.7 million units.
However, the US mattress market took a turn in 2022, when production decreased to 20.4 million units. This represents a year-over-year decrease of 17.4%. For 2023, the decreasing trend continued as production declined further to 18 million units. In just two years, US produced mattresses fell 27%.
The decline seen in 2022 and 2023 was largely due to the challenging macroeconomic conditions, such as high inflation and interest rates. These challenging macroeconomic conditions are putting pressure on TPX’s end clients.
For 2024, management expects produced mattress units to be flat to slightly down as they anticipate headwinds in the first half of the year. On a brighter note, they do expect some recovery in the second half of the year. Therefore, we can expect this mixed outlook on produced mattress units to have an impact on TPX’s FY2024 financial performance.
Portfolio of Brands Ranging from Value to Premium
Investors Relations
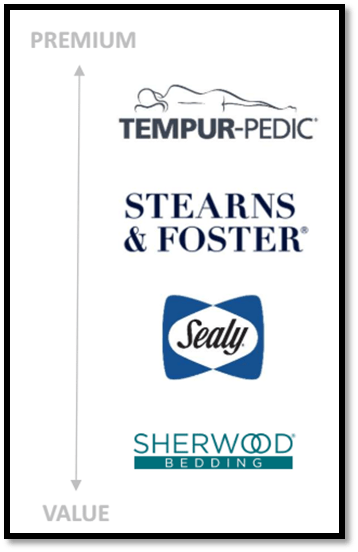
TPX owns a portfolio of iconic brands such as Tempur-Pedic, Sealy, and Stearns & Foster. Tempur-Pedic targets the premium category, as its price range is from $2,200 to $9,998. Coming in second is Stearns & Foster, with a price range of $1,800 to $6,450. Sealy is the third, with a price range of $300 to $3,500. On the other hand, Sherwood Bedding offers private label offerings.
Bedding Premiumization Will Benefit TPX
Investors Relations
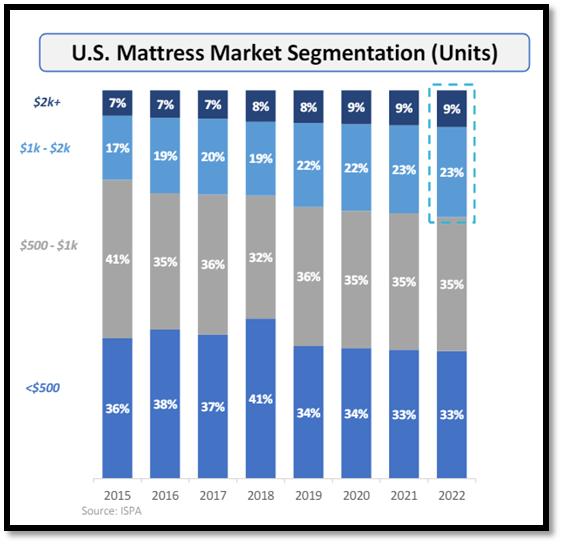
Based on the US mattress market segmentation chart, it is showing a trend towards premiumization of the US mattress market as there is an increasing preference for mattresses with a higher price.
For the $2,000 and onwards segment, its share has increased from 2015’s 7% to 2022’s 9%. Additionally, the $1,000 to $2,000 segment has grown from 17% to 23% over the same time period. In total, these segments have grown their share by 8%. They are gaining market share from the $500 to $1,000 and less than $500 segments, with the former losing more market share. For the $500 to $1,000 segment, its share has shrunk from 41% down to 35%, while the less than $500 segment has lost 3% over the same period.
Therefore, this trend towards premiumization in the US bedding industry is expected to support TPX’s growth outlook as it has a portfolio of brands that target the mid to premium segment. Brands such as Tempur-Pedic and Stearns & Foster.
Relative Valuation Model

Author’s Valuation Model
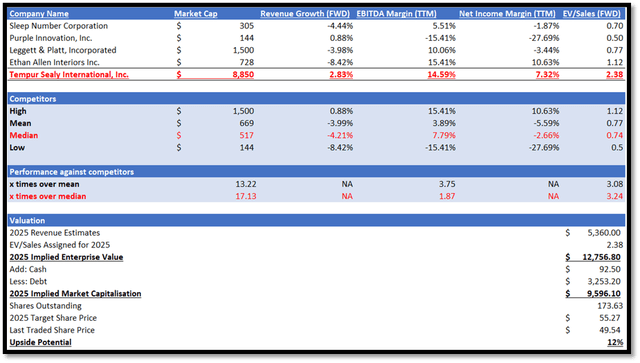
TPX specialises in the manufacturing, distribution, and sale of bedding products. It operates in the home furnishing industry. I will be comparing TPX against its peers, which also operate in the same industry, in terms of growth outlook and profitability margins such as EBITDA margin trailing twelve months [TTM] and net income margin TTM.
TPX outperformed its peers in terms of growth outlook. TPX has a forward revenue growth rate of 2.83%, while its peers’ median forward revenue growth rate is negative 4.21%. This suggests that most of its peers are expected to face declining revenue, while TPX is expected to grow.
Regarding profitability margins, TPX outperformed its peers as well. TPX’s EBITDA margin TTM of 14.59% is higher than peers’ median of 7.79%, which is almost double of theirs. In terms of net income margin TTM, TPX reported a positive net income margin TTM of 7.32%, while its peers’ median is negative 2.66%.
Currently, TPX’s forward EV/Sales ratio is sitting at 2.38x, higher than peers’ median of 0.74x. Given TPX’s strong outperformance in both growth outlook and profitability margins, it is fair for TPX to be trading at a premium.
For 2024, the market revenue estimate for TPX is $5.06 billion, while EPS is $2.72 per share. For 2025, the revenue estimate is $5.35 billion, while EPS is $3.18 per share. Looking at the US mattress market outlook as discussed, the market’s modest revenue estimates are justified. Additionally, management guided FY2024 adjusted EPS to be between $2.60 and $2.90. The midpoint is $2.75, which aligns with the market’s estimation as well. Therefore, by applying my target 2025 EV/sales ratio to TPX’s 2025 EPS estimate, my 2025 target price for TPX is $55.27.
Risk and Conclusion
The risk to my thesis is regarding the change in economic conditions, such as inflation. For TPX, the bedding industry it operates in is impacted by the price volatility of petroleum-based and steel products. The reason behind it is because they affect the cost of polyurethane foam, polyester, and steel innerspring component parts, and these materials play a significant part in TPX’s production cost. If inflation were to cool down, the prices of these items would also come down, and it would have a significant impact on TPX’s margins. Once TPX’s margins start to show signs of expansion or strengthening, the market will re-evaluate its valuation for TPX upwards.
TPX’s historical financials have shown flat revenue growth attributable to challenging macroeconomic conditions, partially offset by strength in its international segment. Additionally, TPX’s margins came under pressure due to rising costs. For 1Q24, revenue fell a modest 1.5% due to continued challenging macroeconomic conditions. However, 1Q24’s margins were robust when compared to 1Q23.
For 2024, the US mattress market is anticipated to be flat to slightly down. Headwinds are expected to happen in the first half of the year, with recovery anticipated for the second half. On a brighter note, there is a trend of bedding premiumization in the US, and this is expected to create tailwind for TPX due to its portfolio of brands. Given the mixed outlook for TPX as discussed, I am recommending a hold rating for now.
Source link