Unsustainable: The One Word To Describe The Economy And Markets

samdiesel/E+ via Getty Images
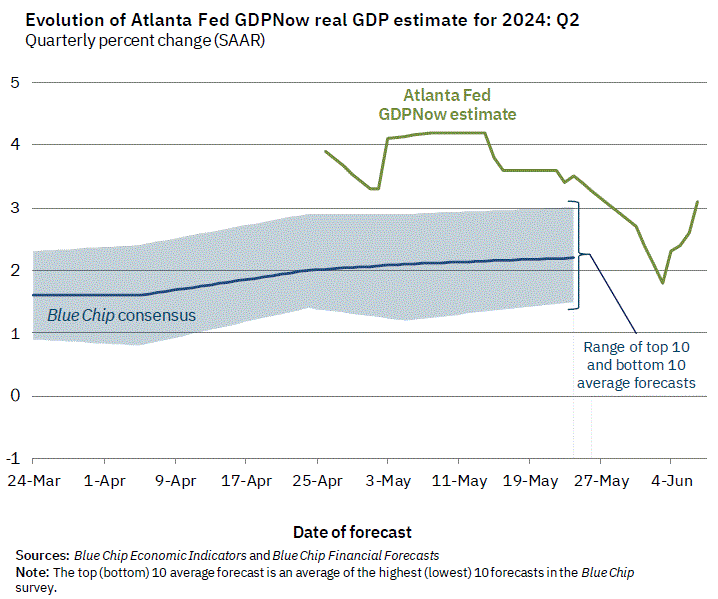
There is one word right now that best describes both the economy and the markets, with the major indices at all-time highs in my mind right now. And that word is Unsustainable. Equities have continued to rise despite economic growth slowing from 4.9% in the third quarter of last year, to 3.4% in the fourth and a paltry 1.3% in the first quarter of this year. In addition, GDP growth estimates have come down over the last month for second quarter growth.
GDPNow
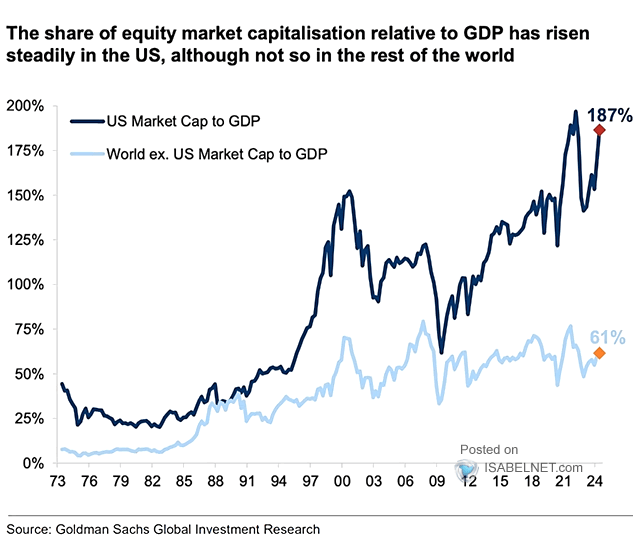
The chart below gives a helpful graphical description of how detached equities have become from the economy. As you can see, we are easily exceeding the extreme metrics that existed just before the Internet Boom turned into the Internet Bust at the turn of the century. That bubble popping triggered an over 80% fall in the NASDAQ until that index bottomed in 2002 and saw the S&P 500 cut in half as well.
Goldman Sachs Global Investment Research/Zero Hedge
NVIDIA Corporation (NVDA) has replaced Cisco Systems (CSCO) as far as being the poster boy for this bout of ‘irrational exuberance’ nearly a quarter-century later, as the AI revolution is the biggest paradigm shift for the economy since the birth of the widespread internet in the 90s. This AI juggernaut is now the second most valuable company in the market with over a $3 trillion market capitalization and now accounts for 6.5% of the overall market cap of the entire S&P 500. NVIDIA has become over $1 trillion bigger than all the energy companies in the index, including Exxon Mobil (XOM) and Chevron (CVX) and its market cap is nearly the size of the GDP of the United Kingdom. NVDA has also gained more than $1 trillion in market cap in less than 35 trading days, which is about the only thing increasing at a faster pace than the federal debt.
Seeking Alpha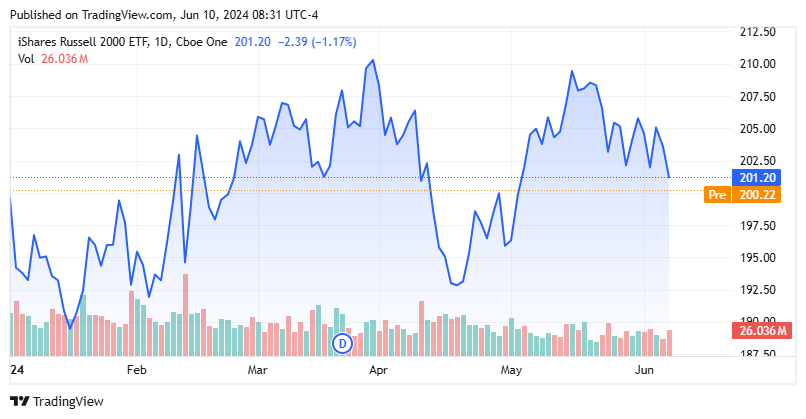
NVIDIA is a core contributor to the lousy breadth of the market. Last week, the NASDAQ posted a near 2.4% while the small-cap Russell 2000 was off just over one percent in trading. So far in 2024, the NASDAQ is up nearly 16% while the Invesco S&P 500® Equal Weight ETF (RSP) has risen just under five percent for the year and the Russell 2000 is just barely in the black in 2024.
Let’s do a valuation exercise to show how extreme valuations have become by looking at S&P 500 earnings before the Federal Reserve began to hike rates in mid-March of 2022 compared to the last four quarters of performance.
S&P 500 Earnings by Quarter
Q2 2021: $48.39
Q3 2021: $49.59
Q4 2021: $53.94
Q1 2022: $45.99
Q2 2023: $48.58
Q3 2023: $47.65
Q4 2023: $47.79
Q1 2024: Right at $53.00 with a few companies left to report
We will throw in some other key data points to compare the two periods.
Fed Funds rate YE21: 0% to .25%
Currently: 5.25% to 5.50%
National Debt YE21: $28.4T
Currently: $34.6T
S&P 500 YE21: 4,766
Currently:5,432
NASDAQ YE21: 15,180
Currently: 17,655
The bottom line is that investors are paying much higher earnings multiples at these levels now with the Fed Funds rate 525bps higher than they were at the end of 2021 when we were still in a ZIRP environment.
Then we have Federal Debt that has increased by more than $6 trillion since the end of 2021. And despite being in an economic expansion, the U.S. is still seeing deficit spending of six to seven percent of GDP on an annual basis. This has contributed to economic growth, but also to inflation.
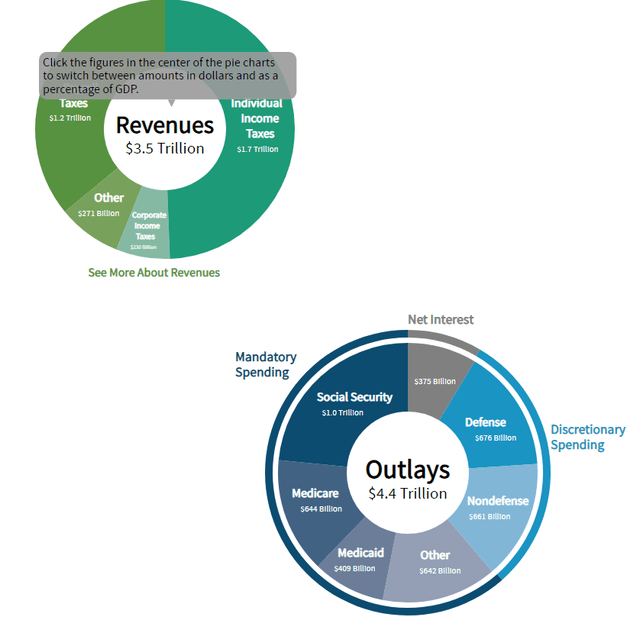
FY2019 Federal Budget (Congressional Budget Office)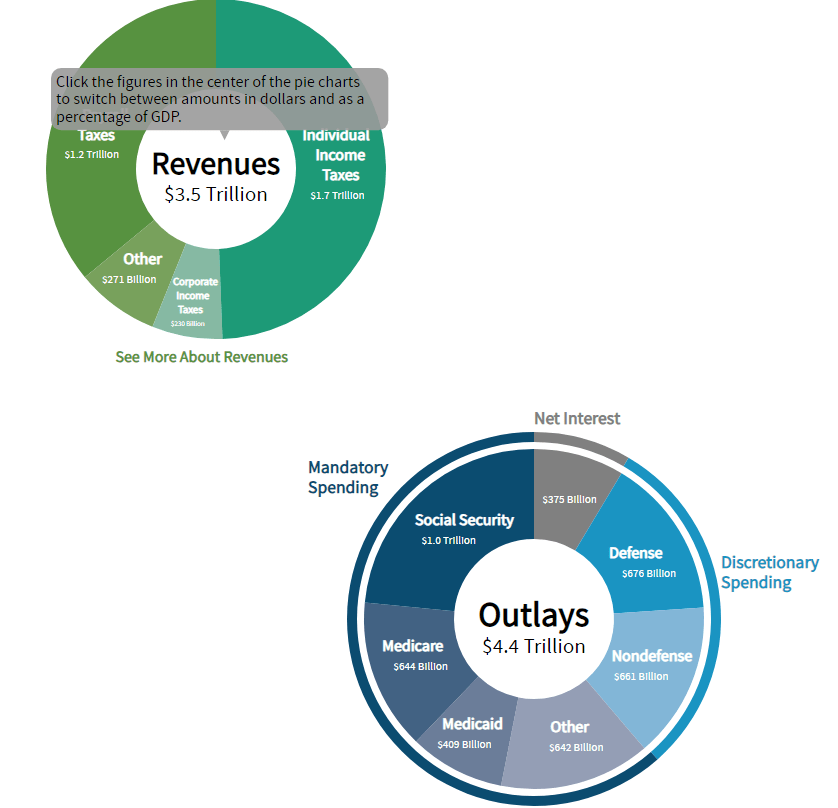
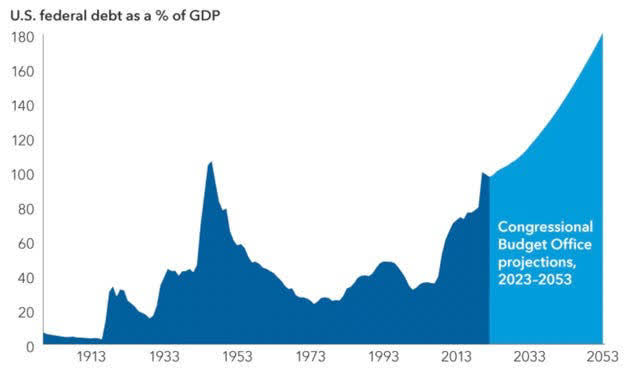
The huge budget gap is almost entirely due to increased spending. In FY2019, the federal government took in $3.5 trillion in revenues and had $4.4 trillion in outlays. In FY2023, the federal government’s outlays had soared to $6.13 billion even as revenues continued to increase at a more modest rate to $4.71 trillion. With interest due to service the debt at a now over $1 trillion run rate at current interest rates and the debt to GDP ratio already at its highest level in U.S. history, this is clearly unsustainable.
CBO/Capital Economics
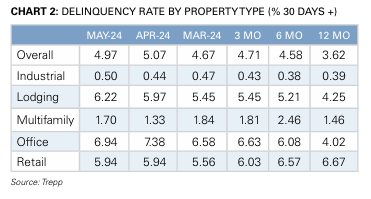
Not to look at gift horse in the mouth as everyone enjoys a rally, but the market seems to be pricing in perfection with the S&P 500 getting close to being valued at 22 times forward earnings. The proxy war with nuclear armed Russia in Ukraine seems to be escalating at a quickening pace (and getting little media attention) and Commercial Real Estate or CRE continues to deteriorate.
May CMBS Delinquency Rate By Property Type (Trepp)
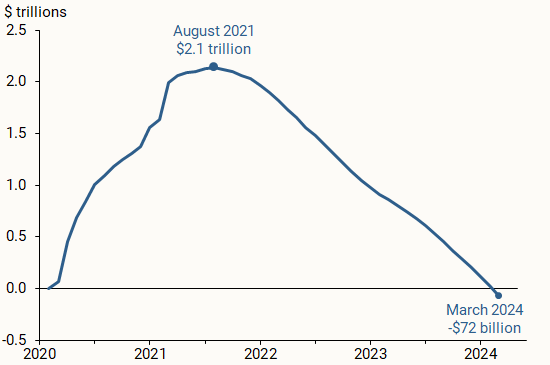
In addition, the consumer has spent all the excess savings from all the Covid stimulus and has personal savings rates less than half the pre-pandemic rate, The May BLS jobs number last Friday was a joke (full-time positions were whacked while part-time positions climbed 286,000), we have a brutal and divisive election on the horizon (and based on results in Europe this weekend, probably a seismic shift in outcome), economic growth has decelerated significantly from the last half of 2023, ratings on regional banks are being cut, there is little notable insider buying in stocks, etc….
U.S. excess personal saving (Bureaus of Economic Analysis)
I know the market is supposed to climb a ‘wall of worry‘ and that in the near future we will all be skinny thanks to GLP-1 weight loss drugs and have AI powered robotic servants, but this future utopia seems fully priced into the market.
Therefore, I remain very cautious around my portfolio composition. Wednesday, I added some funds to my short-term treasury holdings, yielding over 5.3%. Short-term treasuries now make up approximately half of my portfolio, with covered call holdings making up almost all the rest. I also executed some small orders on some out of the money, long-dated bear put spreads against the SPDR® S&P 500® ETF Trust (SPY), just in case Nirvana doesn’t materialize in the year ahead. I view this as cheap portfolio insurance on a very uncertain and unsustainable market.
Source link