SP500: The Bounce Is Likely Exhausted (SP500)


MichaelSvoboda/E+ via Getty Images
The V-shaped bounce
The S&P 500 (SP500) was on a wild ride since August 1st, crashing from the 5550 level to the 5100 level, and snapping back to the 5550 level – in what it looks like a V-shaped bounce, as the chart below shows. However, the S&P 500 is still below the all-time high reached on July 16th.
So, what’s next for the S&P 500? The recent volatility is an indication of a broken market, and the bounce is likely nearly exhausted.
Yahoo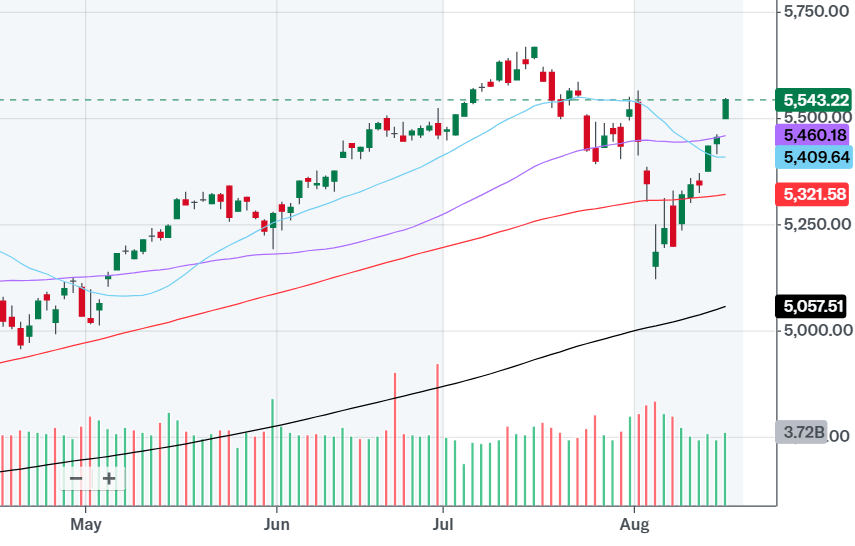
What’s behind the recent volatility?
The recent volatility has been caused primarily by the rise in the Japanese Yen (FXY) due to the 1) more hawkish Bank of Japan with an interest rate hike and 2) more dovish Fed, with the expectations of aggressive interest rate cuts due to the slowing labor market and a possible imminent recession (the Sahm rule trigger).
Institutional investors borrow the Yen at a low-interest rate, and convert the Yen to the US Dollar to invest in US equities and other higher-yielding investments. That’s the Yen Carry Trade.
The trade is unhedged, and it works as long as the Yen does not appreciate. When the Yen appreciates, the institutional investors are forced to sell their investments and convert the US Dollar back to the Yen. That’s the Yen Carry Trade blowup.
The Yen started rising in mid-July which was also when the S&P 500 peaked, and the rise culminated on August 5th with a sharp move higher above the key technical resistance of 200dma, as the chart below shows. That was the Black Monday for Japanese stocks, which crashed by around 15%, but the fall in US stocks was limited to 4-6% at the bottom.
Barchart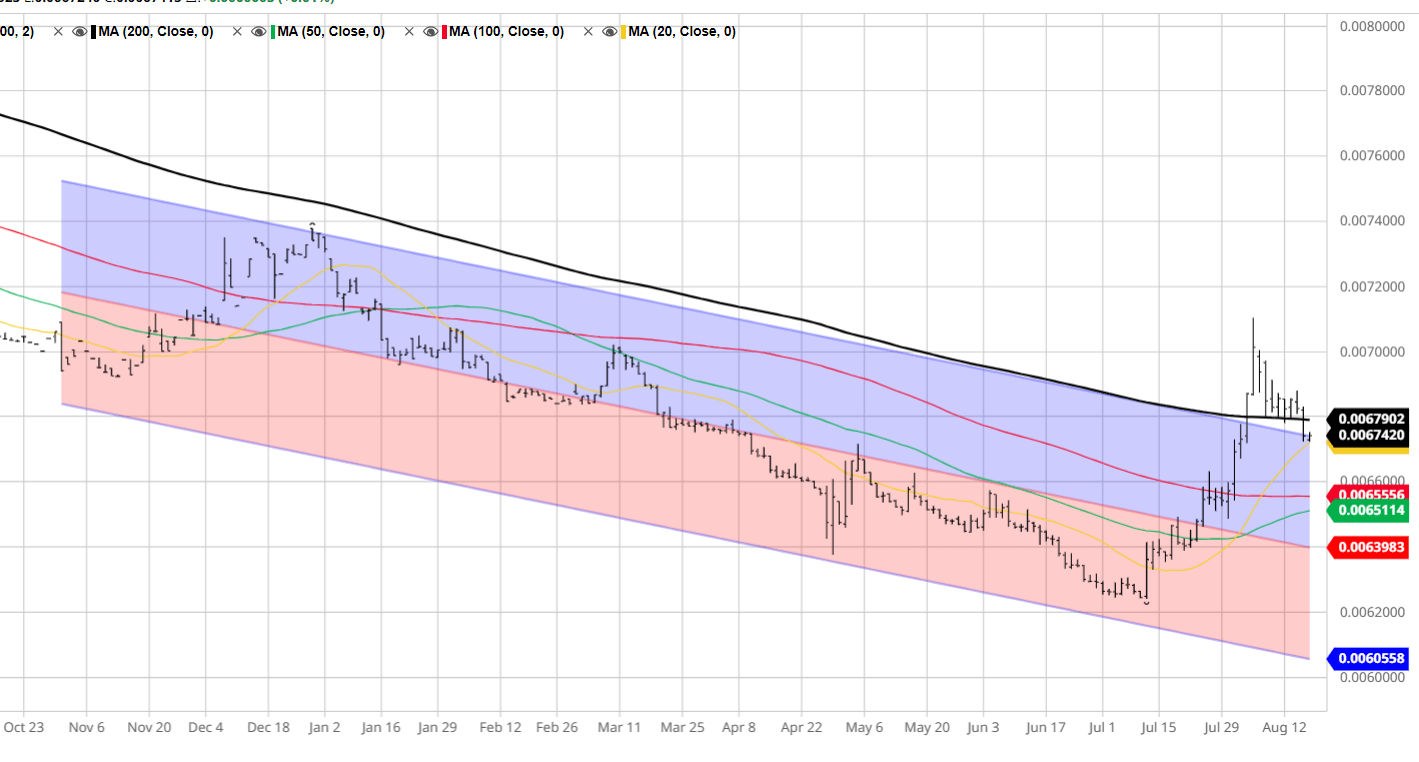
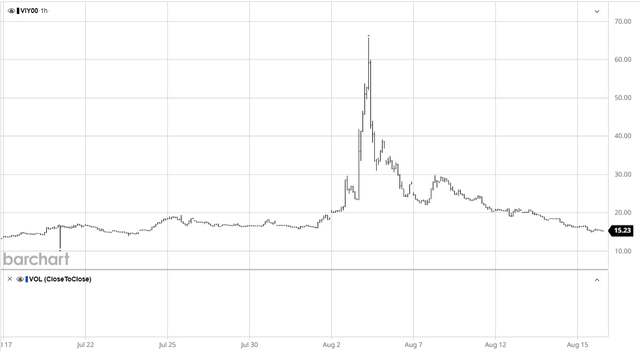
The spike in the Yen and the crash in the Japanese stocks caused a massive spike in the S&P 500 Volatility Index on August 5th to above the 60 level, which is comparable to the Lehman Brothers moment in 2008 and the Covid moment in 2020. Here is the 1-month chart of the VIX:
Barchart
There are other fundamental variables that explain the recent volatility. As I suggested on August 5th when the Yen Carry Trade started to unwind, it was a perfect storm:
It’s the perfect storm with the Yen carry trade bust, the Gen AI bubble burst, and an imminent major geopolitical escalation. The market selloff is just starting with the S&P 500 approaching the 10% correction, but it will be volatile with sharp rallies as well.
The Gen AI hype has been fading due to the realization that the Gen AI CapEx is possibly unprofitable, high costs, and low Gen AI implementation. Thus, the Gen AI stocks, such as Nvidia (NVDA) have fallen 20-25% from the top – which further encouraged selling and accelerated the Yen Carry Trade blow-up as the Gen AI bubble started to burst.
In addition, the geopolitical situation in the Middle East suddenly escalated to the point of a possible regional war. Also, the war in Ukraine and spread to the Russian territory, which is another major escalation.
What’s the proper strategy now?
The spike in VIX to above 60 is usually a buying opportunity, if the spike signals that “something is broken” like a major credit event, and that’s followed with a major intervention (from the Fed or policymakers). So, my initial strategy on Monday morning on August 5th was to reduce the short position and possibly go long, as I explained:
So, I reduced the short position in SPX and was considering even going long – and this was based on the VIX. But I did not go long SPX and used the rally to re-short. We are still in “the perfect storm”, and in my opinion the recent rally is just a “dead-cat bounce”, meaning it is likely to reverse.
However, nothing really was broken on August 5th, as there was no credit event, and thus, there was no policy intervention. Thus, the plan was to reduce the short position – and to re-short the “dead cat bounce”.
Since August 5th, the S&P 500 staged a V-shaped recovery because:
- The rise in the Japanese Yen has stalled.
- The VIX fell back to 15.
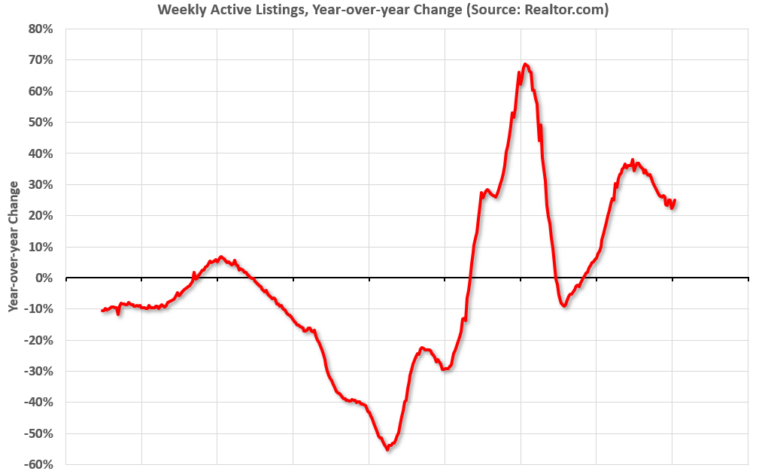
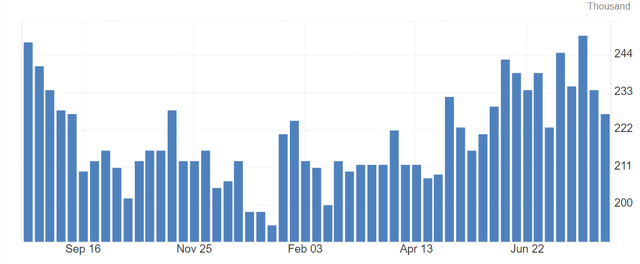
The labor market data has been better over the last two weeks based on the New Claims for Unemployment data. The New Claims dropped from 250K down to 227K.
This data point was important in triggering the bounce in the stock market, as it reduced the probability of an imminent recession, and more importantly, stopped the rise in the Japanese Yen, which crushed the VIX – as the Fed is now unlikely to cut aggressively.
Trading Economics
Thus, the V-shape bounce in the S&P 500 (SPX) is now possibly exhausted because the VIX is back to 15. The VIX is unlikely to drop significantly below 15 given the broad macro situation. So, that trade is now likely over.
The markets are now facing the following:
- The Gen AI bubble burst. The recent V-shape bounce has been led by Nvidia and Semiconductors (SMH). The next key event will be the Nvidia earnings report on August 28th. Given that Gen AI hype is fading, and given that Nvidia is still trading at a PS ratio of 36, the bubble burst is likely to continue.
- The Fed. The market expects the Fed to cut in September, possibly even by 50bpt, and to keep cutting at each meeting in 2024. The Fed will cut if the labor market weakens – and that, a recession. If the recent better labor market data holds, the Fed might not need to cut in September at all. The next big event is the Fed’s Jackson Hole conference on August 23rd, where Powell will signal the next move.
- The geopolitical situation, which is currently unfolding with the ceasefire negotiations in Qatar. The key financial implications here are the potential spike in the price of oil (USO).
Ultimately, fundamentally the S&P 500 is facing a recessionary bear market, and corporate earnings have been painting a picture of a weakening consumer. This week, it was the Home Depot (HD) who warned about consumer spending.
The soft-landing is very unlikely given the unfolding deglobalization and the supply-side inflationary pressures, even as the economy slows down.
The proper strategy here is to be cautious and reduce the exposure to the stock market. The recent bounce is an opportunity to sell at a higher price.
Source link