S&P Global Stock: High Returns On Assets & Share Buybacks, But Very Expensive (NYSE:SPGI)


SeanShot
Business Overview
S&P Global Inc. (NYSE:SPGI) provides credit ratings, analytics, benchmarks and workflow solutions to capital, commodity, and automotive markets. It consists of 5 business segments:
- S&P Market Intelligence: provides multi-asset-class data and analytics packaged in purpose-built workflows, to help trading and investment professionals, government bodies, corporations, and universities to generate alpha and manage credit risk. This segment earns subscription revenues derived from data distribution, valuation services, analytics, and credit ratings information via feed and web channels.
- S&P Global Ratings: provides credit ratings, default likelihoods, research, and analytics to market participants to make decisions about investing in fixed income instruments. This segment operates in over 25 countries around the world.
- S&P Global Commodity Insights: provides price data, analytics, software & services, and industry insights to allow the commodity and energy markets to be more transparent and efficient. This segment’s customers include producers, intermediaries, and traders in the energy, petrochemicals, metals, and agricultural industries.
- S&P Global Mobility: provides solutions to the whole automobile industry value chain including manufacturers, suppliers, retailers, consumers, and finance & insurance companies. This segment earns both subscription and non-subscription revenues.
- S&P Dow Jones Indices: provides index and valuation benchmarks for wealth managers, institutional investors, and investment advisors. Indices generates revenues from investment vehicles based on the indices constructed by this segment, exchange-traded derivatives, index-related licensing fees, and data & customized index subscription fees.
S&P Global until recently had an Engineering Solutions segment, which was sold on May 2, 2023. Over half of S&P’s revenues are recurring subscription revenues, and over half of S&P’s revenues are sourced from the US:
S&P Global 2023 10-K Filing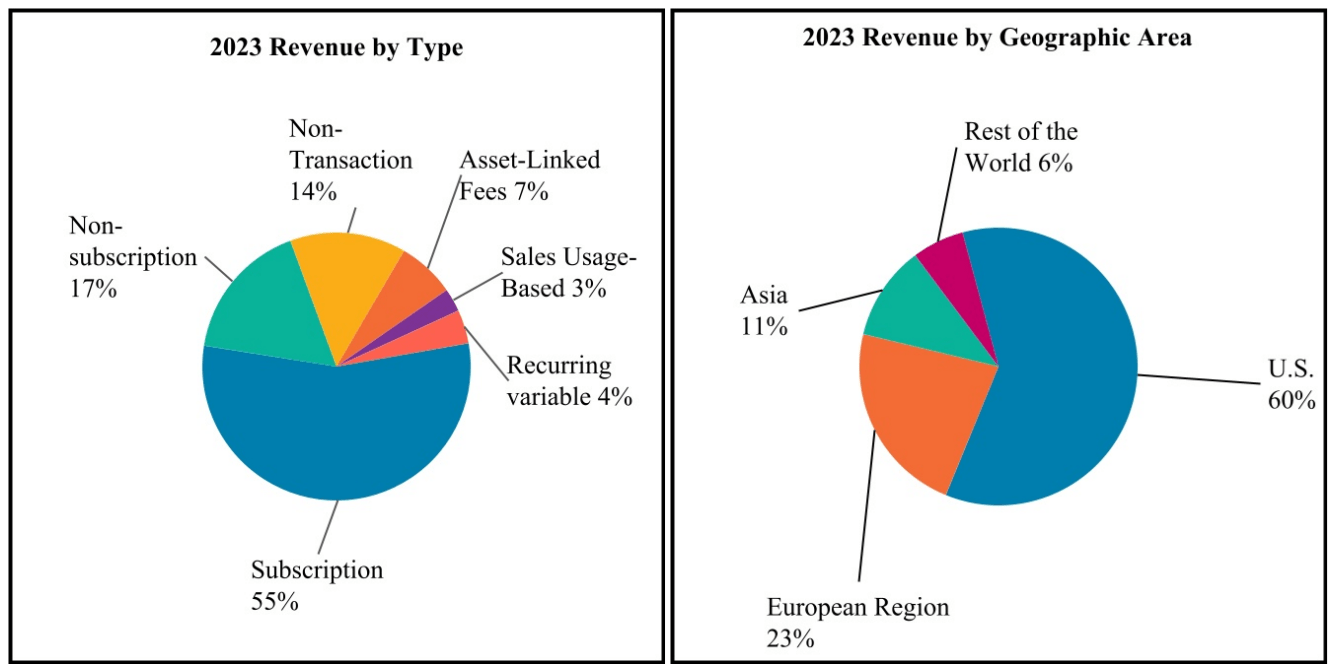
S&P grows by sustaining its market share of the ratings & analytics demand in the world economy – as economies grow, so does demand for credit ratings on credit instruments & corporations, as well as need for information in larger and larger commodity markets.
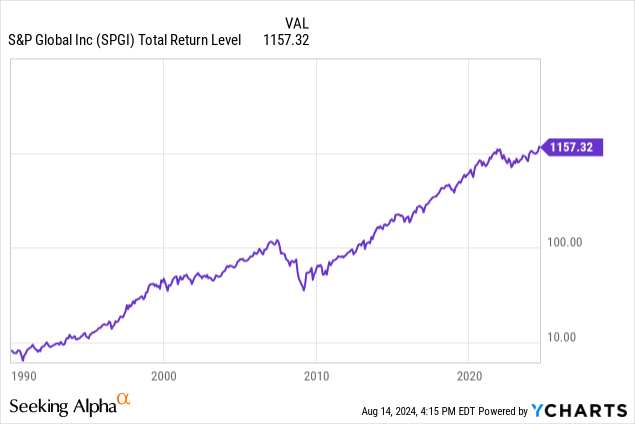
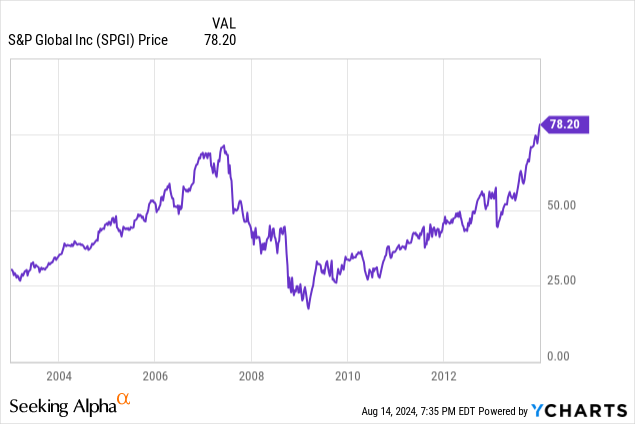
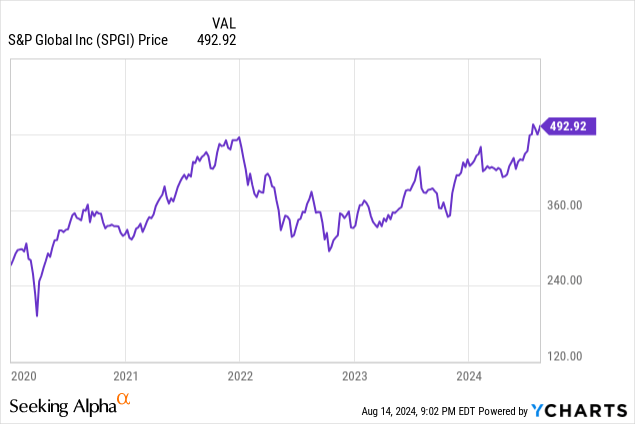
Let’s take a quick peek at S&P Global’s track record on the stock market:
S&P Global’s stock price in 1990 was about $7. That $7 invested 34 years ago would be worth $1,157.32 today assuming all dividends are reinvested, working out to a compound annual return of 16.2% per year on average.
The picture above shows one critical risk in investing in S&P Global: large dislocations and stresses in the credit markets could have a drastic impact on the market value of their shares. Note the large drop in 2020 due to the COVID crisis and the very large drop due to the 2007 – 2008 financial crisis. This is because S&P Global through its credit ratings business is heavily dependent on the volume of lending activity in the credit markets for revenues. Additionally, S&P Global’s reputation was severely damaged by the 2007-2008 financial crisis, which further added to the massive drop. But more on that later.
S&P Global’s moat consists of its reputation and brand name. S&P is always building, maintaining, and defending its reputation, as S&P’s clients in the aggregate manage trillions of dollars worth of assets using S&P’s insights because S&P’s past performance allows its name to carry weight. Additionally, there are high barriers to entry into S&P’s lines of business, as newcomers need to build their reputation which takes time and effort.
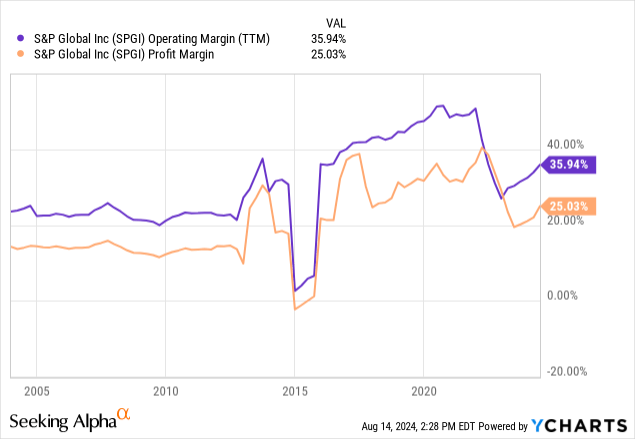
S&P is one of the “Big 3” credit ratings agencies that forms an oligopoly along with Fitch and Moody’s, which together control most of the credit ratings market in the US. The existence of the oligopoly means that S&P operates in a space of reduced competition as compared with other market structures (except monopoly), which in turn is protective of S&P profit margins, which are quite fat:
In short, S&P’s entrenched reputation and oligopolistic market position allow it to effectively compete in its markets and defend its market position and profitability. This moat will allow us to extrapolate into the future based on S&P’s past performance, and be reasonably sure that the extrapolation will turn out to be generally correct.
Recent Financial Performance
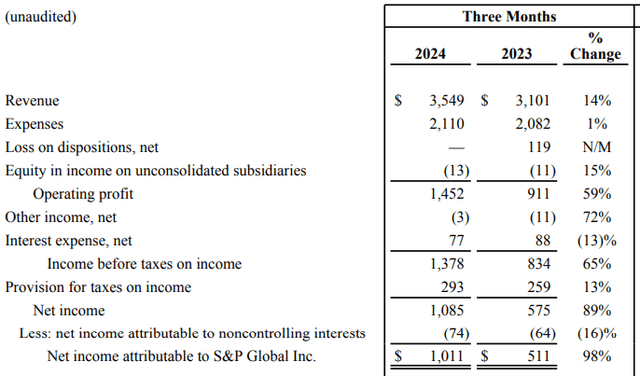
Q2 2024 financial results came out on July 30, and they were quite positive. S&P Global reported revenues of $3.549 billion, up 14% year on year, with revenue from subscription products rising 8%.
The following is a breakdown of the movement by business segment:
S&P Global Q2 2024 Earnings Release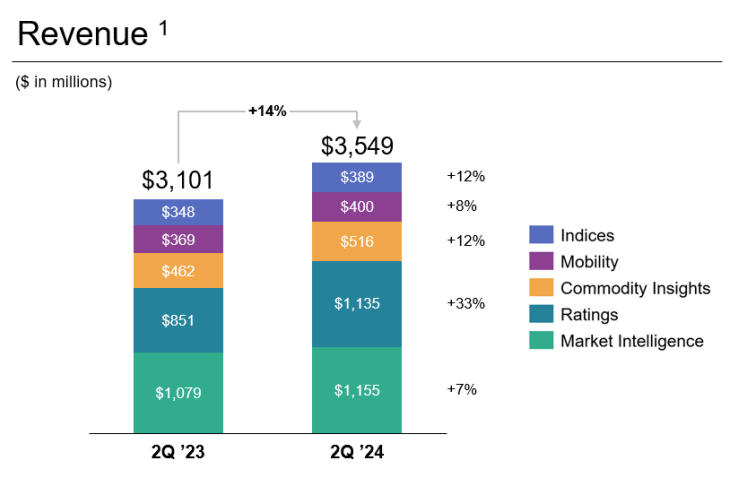
- Market Intelligence was up 7%, impacted by continued softness in the financial services end market. Focus is on improving performance and adding new content, as well as integrating markets’ fixed income securities data. S&P Global expects this segment to grow by 6% to 7.5% including the contribution of the acquisition of Visible Alpha.
- Ratings segment was boosted by 63% growth in transaction revenue; non-transaction revenue was up 9% year on year.
- Commodity insights grew 12% year on year, especially driven by double digit growth in Price Assessments and Energy And Resources Data & Insights due to strong performance in crude & refined products.
- Mobility grew 8% year on year, due to increased dealer revenue, continued success with CARFAX, and strong subscription sales.
- Indices revenue was up 12% due to high underwriting volumes. Additionally, the global ETF market saw massive inflows of $300 billion during this period, highlighting the shift to passive investing. This segment is expected to grow about 10-12% this year overall.
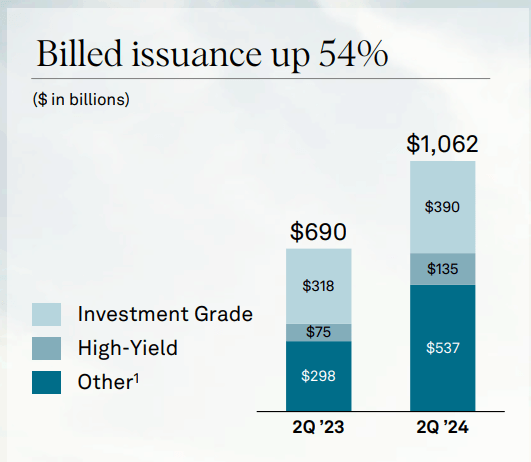
The Ratings business growth in particular was heavily positively influenced by massive increases in billed issuances in bank loans & high yield debt:
S&P Global Q2 2024 Conference Call Presentation
Revenue from rating services in the private markets increased by over 70% year on year in Q2. Additionally, during Q2 S&P Global achieved nearly $200 million in revenue synergies, faster than the pace set by the goal of $350 million in revenue syneries in 2026.
Two strategic investment areas saw revenue growth: Sustainability & Energy Transition by 23% from $70 million to $87 million driven by demand for Advisory Services and subscription offerings, and Private Market Solutions by 26% from $106 million to $134 million driven by debt, bank loan, and CLO ratings.
On an generative AI note, during Q2, S&P Global launched ChatAI on Platts Connect, as a new platform that combines Platts Dimenions Pro with IHS Connect, which allows access to huge amounts of data, research, and insights to power global commodity markets. ChatAI is designed to help end users navigate the huge amount of information and data present in their databases in a real time conversational way. An internal tool developed was new functionality in the S&P Spark Assist platform that 14,000 of S&P Global’s employees uses on a daily basis. There are other examples of such AI tools being developed within the company; in short S&P Global is highly active in using and developing new tools using generative AI.
Here’s how the top line growth trickled down into bottom line growth:
S&P Global Q2 2024 Earnings Release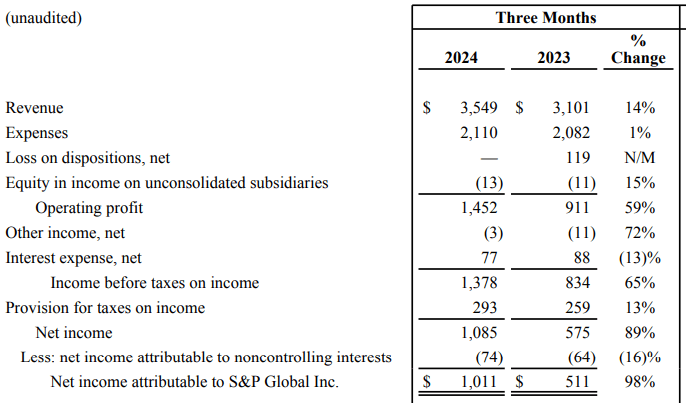
Net income was up a whopping 98%, largely driven by strong growth in ratings & indices business, particularly due to the increase in debt issuance. S&P Global expects to accelerate its share buybacks to total of $1.5 billion in Q3. Management updated its guidance for FY 2024 to the following:
S&P Global Q2 2024 Earnings Supplemental
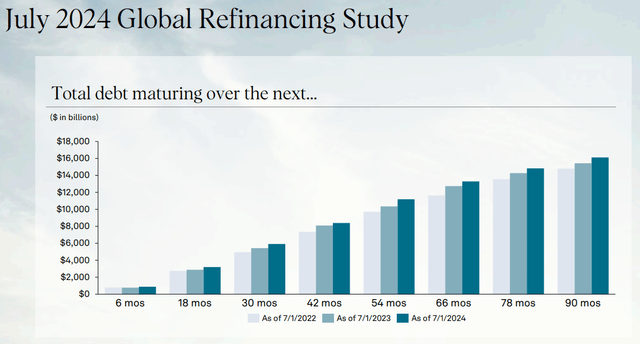
This guidance assumes that global GDP growth is 3.3%, US inflation is at 3%, and an average Brent crude price of $84/barrel. Given the dramatic increase in debt issuance in the first half of the year, S&P Global now expects debt issuance to grow about 25% year on year, higher than the previously guided range of 6 – 10%. The following chart of expected debt maturities across the economy will give a sense of S&P’s ratings business volume in the months and years ahead:
S&P Global Q2 2024 Conference Call Presentation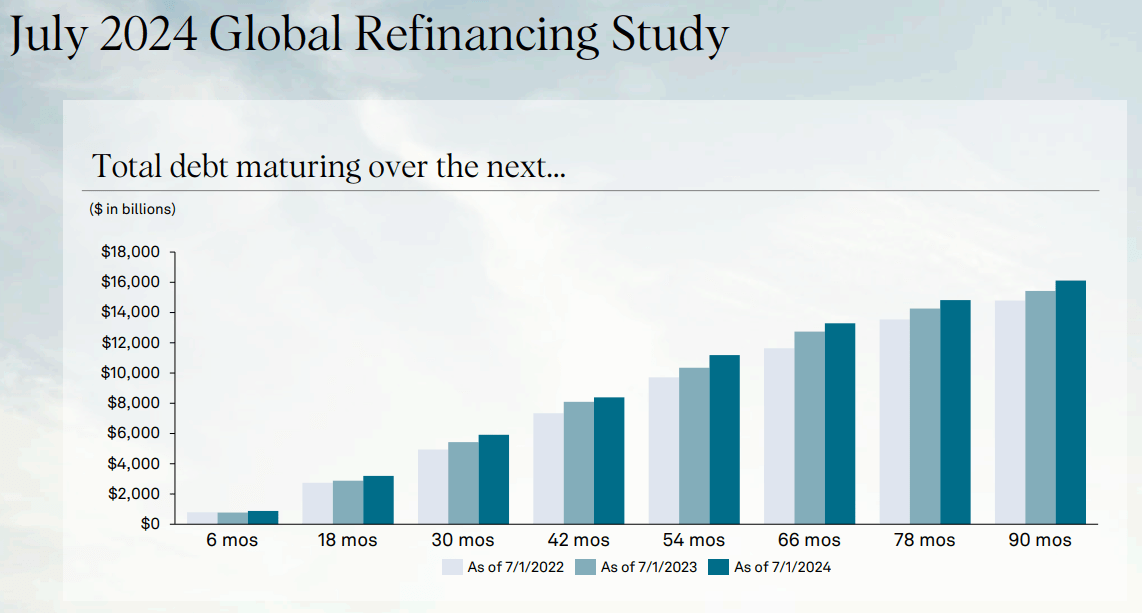
As debt matures and is refinanced, S&P Global gets new business opportunities in rating the refinanced debt.
If I had to extrapolate out into the future, I would start with forecasts of global & US GDP growth and credit growth across the world, as these are the main drivers of S&P Global’s business. A press release by the OECD in May 2024 predicted global GDP growth of 3.1% in 2024 and 3.2% in 2025, while US growth is expected to be 2.6% in 2024 and slowing down to 1.8% in 2025 due to higher borrowing costs.
In the US, the Senior Loan Officer Opinion Survey on Bank Lending Practices survey from July 2024 showed that banks reported tighter lending standards and unchanged demand for commercial & industrial loans in Q2 2024 for firms of all sizes, and tighter standards and weaker demand for all CRE loan cateories. In terms of loans to households, banks reported unchanged lending standards and weaker demand for all categories of residential real estate loans as well as home equity lines of credit. This is in line with a deceleration of the US economy overall.
This suggests that S&P Global’s Q3 and Q4 2024 figures as well as 2025 figures may not be quite as strong as its Q2 2024 figures, though I would still expect growth across the board for all segments of S&P Global but at a somewhat slower pace. Clearly S&P Global is still going strong.
Recent Acquisitions
S&P Global grows partly by opportunistic acquisitions that are accretive to their product offerings. S&P conducted 5 such acquisitions in 2023 and 2024:
- Jan 3, 2023: ChartIQ was acquired to be added to S&P Global’s Market Intelligence segment, as it is a top notch data visualization tool that works across web, mobile, and desktop.
- Jan 4, 2023: TruSight Solutions was acquired to be integrated into S&P Global’s Market Intelligence segment by expanding the breadth and depth of S&P Global’s third party vendor risk management solutions, by providing quality validated assessment data designed to reduce vendor due diligence burden on service providers for the financial services industry.
- Feb 16, 2023: Market Scan Infomation Systems Inc. was acquired, to be added to S&P Global’s Mobility segment because it was a premier provider of automotive incentive & pricing intelligence, which is complementary to existing services for dealers, OEMs, lenders, etc.
- May 1, 2024: Visible Alpha was acquired to be added to S&P Global’s Market Intelligence Capital IQ Pro platform, because it is a provider of fundamental investment research capabilities.
- May 14, 2024: World Hydrogen Leaders was acquired to be added to S&P Global’s Commodity Insight segment, which provides customers with full coverage of the hydrogen and its derivatives value chain.
S&P Global’s Previous Financial Results
It might help to get a sense of how S&P Global came to become what it is today to have more historical context for understanding the business.
Income Statement Takeaways
I’ll begin by showing income statement figures for S&P Global from 2003, 2013, and 2023:
| All Figures In Millions Except Per Share Data | 2003 | 2013 | 2023 |
| Revenue | 4,828 | 4,875 | 12,497 |
| Expenses | |||
| Operations | 2,006 | 1,584 | 4,141 |
| Selling & General | 1,740 | 1,737 | 3,159 |
| Depreciation | 83 | 86 | 101 |
| Amortization Of Intangibles | 33 | 51 | 1,042 |
| Total Expenses | 3,862 | 3,458 | 8,443 |
| Gain (Loss) On Dispositions | – | – | (70) |
| Other Income (Loss) | 172 | (12) | – |
| Equity In Income On Unconsolidated Subsidiaries | – | – | (36) |
| Operating Income | 1,137 | 1,405 | 4,020 |
| Other Expense (Income), net | – | – | 15 |
| Interest Expense, net | (7) | (59) | (334) |
| Income Before Taxe | 1,130 | 1,346 | 3,671 |
| Provision For Taxes | 442 | 443 | 778 |
| (Loss) Income From Discontinued Operations | – | (26) | – |
| Gain On Sale Of Discontinued Operations | – | 589 | – |
| Net Income | 688 | 1,466 | 2,893 |
| Less: Net Income Attributable To Noncontrolling Interests | – | (90) | (267) |
| Net Income Attributable To S&P Global | 688 | 1,376 | 2,626 |
| Earnings Per Share, Diluted | 3.58 | 4.91 | 8.23 |
| Weighted Average Shares Outstanding, Diluted | 192.0 | 279.8 | 318.9 |
Note that if we take out the gain on sale of discontinued operations, S&P Global did not grow from 2003 to 2013. This is because of its role in the 2007-2008 financial crisis. Long story short, high market demand for AAA rated debt instruments caused the purveyors of structured debt instruments to pressure the ratings agencies into giving them the rating they wanted, AAA, on the instruments they wanted to sell. They wanted to sell highly convoluted structured securities where assorted mortgages were packaged, sliced into tranches, and then the tranches could be packaged and re-tranched again, so on, turning low rated debt into AAA instruments in the process. They pressured the agencies by shopping around between them. The agencies, pressured to make profits as publicly traded companies, relaxed their ratings standards and rubber stamped a AAA label on massive amounts of instruments that should have been labeled junk. The end result was massive reputational damage to the ratings agencies, S&P Global among them.
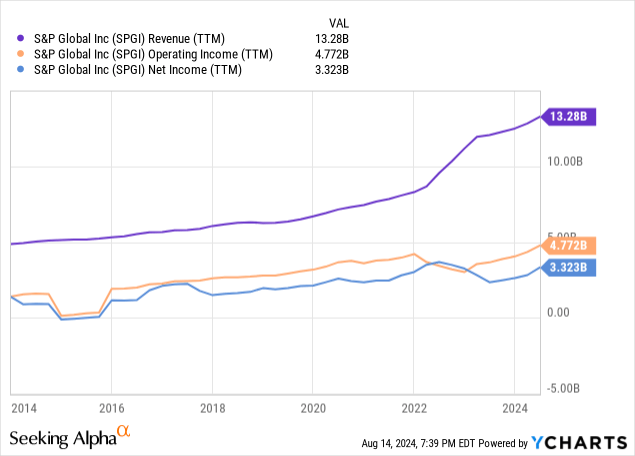
Above is S&P Global’s share price from 2003 to 2013. Has S&P Global’s reputation recovered? Unfortunately since I’m not in the market for credit ratings so I don’t have first hand knowledge. But I can default to reading the market as a proxy; S&P’s share prices have long since recovered, and so I would say that its reputation (its moat) is functionally intact – it still does business – but it is permanently scarred on the corners because people have long historical memories of events such as the financial crisis. That finally leads us to the recent past. In short, S&P has thrived since 2014: check out the graph below of S&P Global’s revenues, operating income, and net income:
Since 2014, S&P Global has almost tripled itself in size in terms of revenues and profits. Not a bad recovery at all. The reason is simple: S&P Global’s business segments are leveraged according to the levels of US and international equity markets, as well as credit growth of all sorts across the world. This is because S&P’s indices business is based on assets under management according to their indices, and their ratings business depends on constantly having new bonds and debt instruments to rate. As long as the world economies are growing, S&P’s business grows alongside them.
Balance Sheet Takeaways
Next, let’s look at its balance sheet at the end of 2013 and 2023 to see what difference 10 years made there. Figures here were taken from their respective past 10-K filings.
| All Figures In Millions | Year End 2013 | Year End 2023 |
| Assets | ||
| Current Assets | ||
| Cash & Equivalents | 1,542 | 1,290 |
| Restricted Cash | – | 1 |
| Short-Term Investments | 18 | 26 |
| Accounts Receivable | 979 | 2,826 |
| Deferred Income Taxes | 108 | – |
| Prepaid & Other Current Assets | 228 | 1,000 |
| Assets Held For Sale | 61 | – |
| Total Current Assets | 2,936 | 5,143 |
| Property & Equipment | ||
| Buildings & Leasehold Improvements | 436 | 424 |
| Equipment & Furniture | 430 | 628 |
| Property & Equipment, gross | 866 | 1,052 |
| Less: Accumulated Depreciation | (617) | (794) |
| Property & Equipment, net | 249 | 258 |
| Right Of Use Assets | – | 379 |
| Goodwill | 1,412 | 34,850 |
| Other Intangible Assets | 1,033 | 17,398 |
| Asset For Pension Benefits | 261 | 1,787 |
| Other Non-Current Assets | 170 | 238 |
| Total Assets | 6,061 | 536 |
| Liabilities & Equity | ||
| Current Liabilities | ||
| Accounts Payable | 219 | 557 |
| Accrued Compensation & Contributions To Retirement Plans | 427 | 906 |
| Short-Term Debt | – | 47 |
| Income Taxes Currently Payable | 15 | 121 |
| Unearned Revenues | 1,309 | 3,461 |
| Other Current Liabilities | 402 | 1,053 |
| Liabilities Held For Sale | – | – |
| Total Current Liabilities | 2,372 | 6,125 |
| Long-Term Debt | 799 | 11,412 |
| Lease Liabilities – Non-Current | – | 541 |
| Pension & Other Postretirement Benefits | 264 | 199 |
| Deferred Income Taxes | 205 | 3,690 |
| Other Non-Current Liabilities | 267 | 522 |
| Total Liabilities | 3,907 | 22,489 |
| Redeemable Noncontrolling Interest | 810 | 3,800 |
| Commitments & Contingencies | – | – |
| Equity | ||
| Common Stock, $1 par value | 412 | 415 |
| Additional Paid-In Capital | 447 | 44,231 |
| Retained Income | 7,384 | 18,728 |
| Accumulated Other Comprehensive Loss | (196) | (763) |
| Less: Common Stock In Treasury | (6,746) | (28,411) |
| Total Equity – Controlling Interests | 1,301 | 34,200 |
| Total Equity – Noncontrolling Interests | 43 | 100 |
| Total Equity | 1,344 | 34,300 |
There are some things to note in these balance sheets:
- S&P Global is an asset light business; it runs on brains and computers and offices, not steel and scaffolding. Hence its property & equipment account is quite tiny compared to companies with similar market cap. This is a plus, in that because returns on tangible assets is very high, each dollar of profit requires far less invested capital than at a more typical firm.
- The assets are dominated by current assets and goodwill & intangibles. There is a lot of goodwill & intangibles because S&P Global makes acquisitions of other ratings agencies & intellectual services companies, whose balance sheets are also asset light and whose purchase price is significantly higher than their book value. Here’s a full list of acquisitions conducted by S&P Global – unfortunately most of the price tags are undisclosed.
- If we strip out goodwill and intangibles from the balance sheet, S&P Global’s tangible book value is negative $17,948 million (!).
- The retained income account has increased quite dramatically, indicating that S&P Global has been reinvesting its profits back into itself for growth.
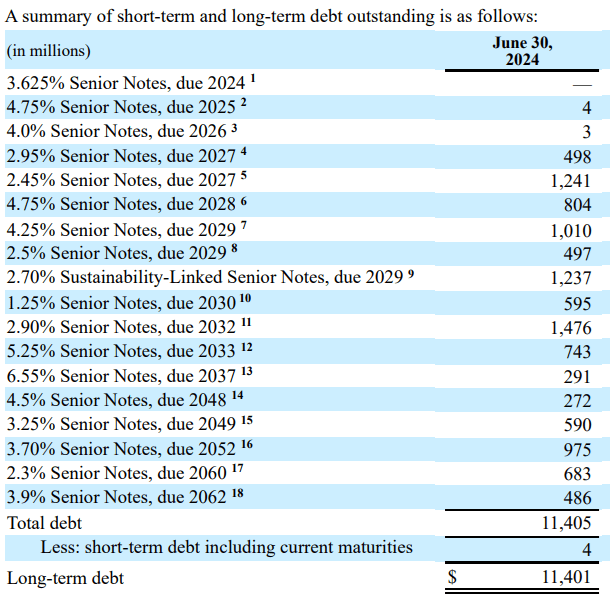
Note that much of S&P Global’s debt was added when interest rates were low, between 2013 and 2022. Note the low coupon rates on most of its senior notes, as well as the relative lack of maturity walls in the future:
S&P Global Q2 2024 10-Q Filing
Our hope is that now that interest rates are higher, management will be far more cautious about accumulating long term debt for any reason. S&P Global is a cash flow machine and ideally should be paying for its acquisitions in cash. Additionally, its share buybacks should also be done with cash, as issuing debt to buy back shares is mortgaging the company’s future financial performance in exchange for short term share price boosts. Only time will tell what S&P Global management will choose to do.
Cash Flow Statement Takeaways
Next let’s look at some select columns of cash flow data to see management’s capital allocation decision making. In the table below, all figures were derived from SeekingAlpha’s “Financials” page for S&P Global.
| Operating Cash Flow | Net Debt Issued (Repaid) | Net Shares Issued (Repaid) | Dividends Paid | Capital Expenditure | Cash Acquisitions | Divestitures | |
| 2023 | 3,710 | 586 | (3,400) | (1,147) | (143) | (296) | 1,014 |
| 2022 | 2,603 | 1,665 | (12,107) | (1,024) | (89) | 210 | 3,509 |
| 2021 | 3,598 | 0 | (43) | (743) | (35) | (99) | 16 |
| 2020 | 3,567 | (118) | (1,209) | (645) | (76) | (201) | 18 |
| 2019 | 2,776 | 218 | (1,266) | (560) | (115) | (91) | 85 |
| 2018 | 2,064 | 86 | (1,692) | (503) | (113) | (401) | 6 |
| 2017 | 2,016 | 0 | (975) | (421) | (123) | (83) | 2 |
| 2016 | 1,560 | (71) | (1,090) | (380) | (115) | (211) | 1,498 |
| 2015 | 227 | 2,817 | (980) | (363) | (139) | (2,396) | 14 |
| 2014 | 1,227 | 0 | (169) | (326) | (92) | (71) | 0 |
There are a few takeaways to be had:
- S&P Global has consistently increased its dividend payout over this period.
- It is a consistent repurchaser of shares, generally done by using its operating cash flow.
- In 2015 it paid for its acquisition of SNL Financial by issuing debt.
- In 2022 it made a very large lump sum share repurchase, financed with cash, as well as operating cash flow, some debt issuance, and a large divestiture.
Overall this paints a picture of a management that is judicious about using debt, that pays for dividends and capital expenditure using its operating cash flows, and is willing to opportunistically repurchase shares at low share prices – note that it very likely repurchased the dip in 2022:
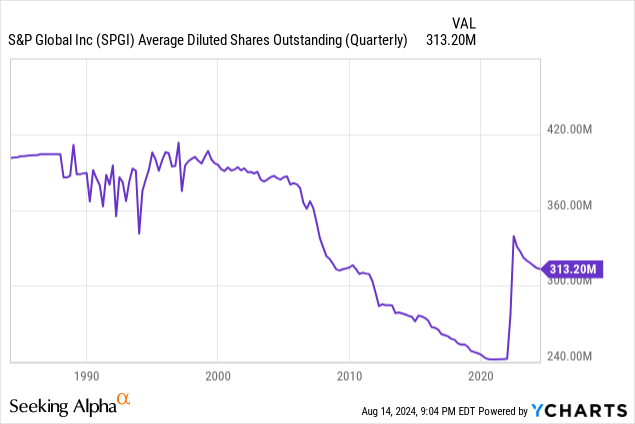
Finally, let’s look at S&P Global’s share count over time: we know from its cash flow statement that it is a consistent repurchaser of shares:
Note that the large increase in the share count in 2022 coincides with the closing of the merger with IHS Markit. The combined entity had an enterprise value of $140 billion.
Valuation Of S&P Global Common Shares
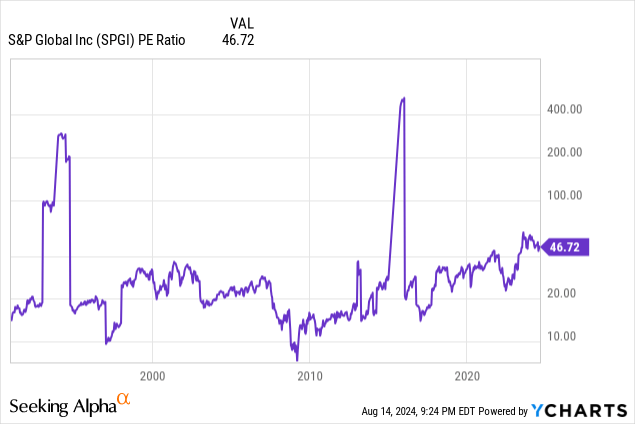
I’ll use two metrics to consider S&P Global’s current market valuation. First, let’s start with its historical P/E ratio:
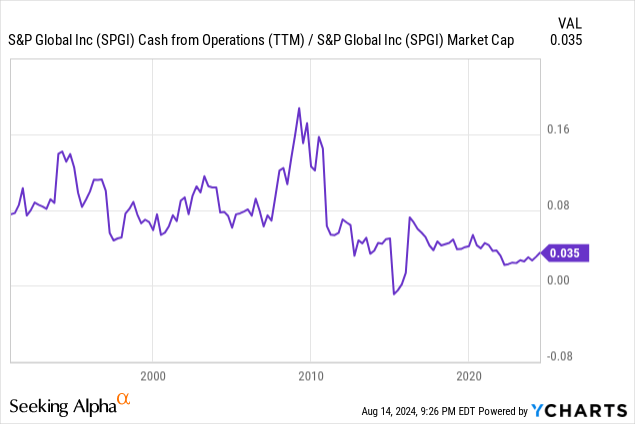
Except for two blips in 1996 and 2016, S&P Global has traded between 10x and ~50x P/E, historically speaking. Currently it trades at 46.72x, which suggests that S&P Global is currently valued near its historical extreme high. This suggests that now is not a good time to initiate a long position, and might be a good time to sell to take some profits. Next let’s consider operating cash flow divided by market cap, or operating cash flow yield:
Under this metric, the lower the ratio, the higher the market valuation. S&P Global’s operating cash flow yield is currently 3.5%, which is near the extreme low of its historical valuation range. Again, this suggests that now is not a good time to start a position, and might be a good time to sell to take profits.
I overall rate S&P Global a “sell” because of its overextended valuation. It is however a fundamentally good business, but it’s just too expensive to my taste.
Risks & Exposures Of S&P Global
- S&P Global’s operations rely on secure processing, storage, and tranmission of confidential & sensitive data. A breach of cybersecurity could cause its clients to lose faith in S&P Global’s ability to protect sensitive data and stop doing business with them.
- S&P Global operates in markets that are continuously changing and needs to continually adapt to customer needs. S&P Global invests in innovation, new offerings, and enhancements to their products & their delivery. It is possible that the new products can fall short of satisfying market demands.
- S&P Global is investing heavily in AI to complement and support its business operations. However AI is continually evolving, and issues such as new laws and regulations, government scrutiny, competition, litigation, etc. could impair their ability to protect their data and develop AI in ways that their customers find useful and appropriate for their needs.
- S&P Global considers many of its products and services to be proprietary. If they fail to defend their intellectual property, it could cause harm to the value of those assets, damage their reputation, and/or impair their ability to compete. For instance, it is unclear whether intellectual property laws and regulations where S&P operates will allow them to defend their intellectual property from misuse by AI in the future.
- Changes in security trading and issuing volumes, flows in and out of investment products, interest rates, and market volatility could impair S&P Global’s business. Additionally as we saw from S&P Global’s long term total return level chart, participation in large financial crises and reputational losses can have a severe negative impact on the market value of its shares.
- S&P Global is heavily dependent on Amazon Web Services for cloud computing capacity. Disruptions or interference with AWS service continuity could negatively impact their business.
Source link