If Big Tech Bear Is Here, TQQQ Sliding To 2022 Lows Next?

PM Images
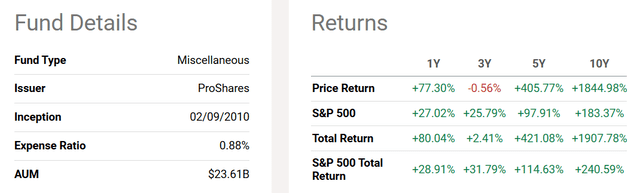
Financial leverage is a great thing during economic booms and oversized stock market gains. That’s exactly the definition explaining the terrific returns outlined by the ProShares UltraPro QQQ ETF (NASDAQ:TQQQ) over the last decade. With a daily performance goal of 3x the gains of the NASDAQ 100 index, holding this security during a Big Tech growth phase has absolutely been a winning idea. One might even believe “pigs can fly” if you have been a long-term holder since the 2016 boom in Big Tech began. The 10-year total return number approached +2,000% in July! Making money is easy, just buy the dips.
Seeking Alpha Table – TQQQ, Price & Total Returns, Different Time Periods, 10 Years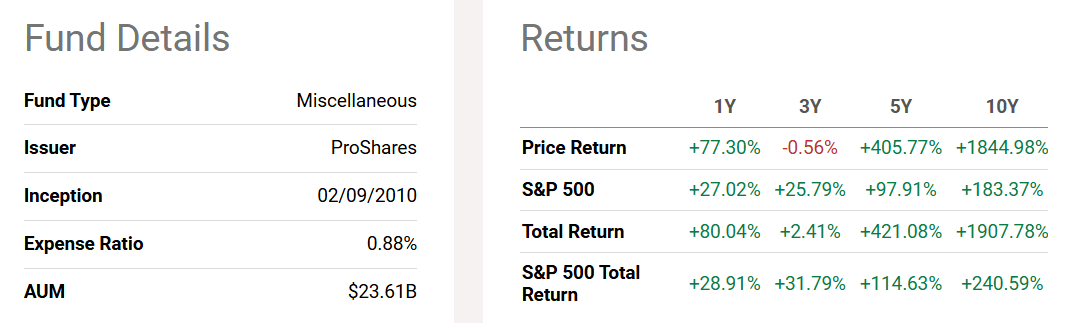
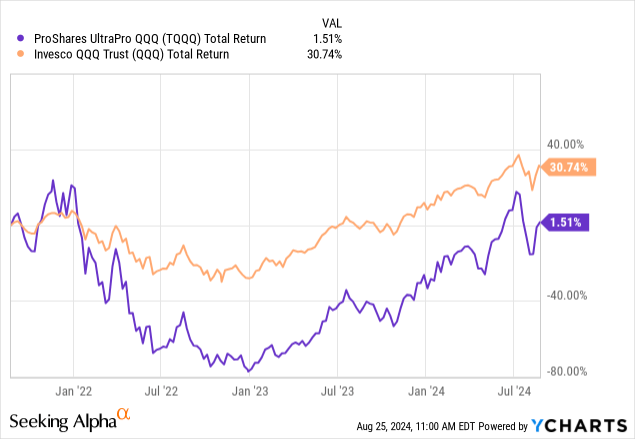
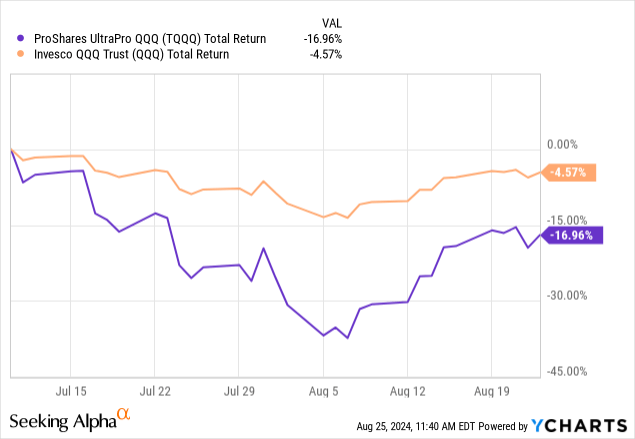
However, leverage is a double-edged sword. On Wall Street, the largest declines in the market have also been exaggerated in the TQQQ product. And, the “cost” of creating the leverage (premiums on swaps that act like an interest expense, plus ETF management fees) does have a long-term impact, when little progress is being made in the underlying index. Below, you can see on the 3-year chart how owning the 1x plain-vanilla Invesco QQQ ETF (QQQ) total return advance of +30.7% has easily bested the minor TQQQ +1.5% gain. The ProShares UltraPro QQQ performance has actually been less than the rate of return available from risk-free cash investments!
YCharts – TQQQ vs. QQQ, Total Returns, 3 Years
Because of the costs of running this leveraged product, and the way compounding math works after a monster selloff (where far superior percentage gains daily are required to make up for a massive loss), TQQQ has yet to surpass its November 2021 high print.
Of immediate concern for me is the bearish reversal in technical momentum taking place at the Big Tech names in July-August. I have written many articles on this phenomenon, with a real focus on the wild swings in the Ease of Movement indicator.
What’s been playing out on the charts in late summer is exactly the kind of trading action that has pinpointed previous peaks in the technology sector during 2000 and late 2021. So, the odds of major price gains from here look to be very minimal, if not completely off the table, going into 2025.
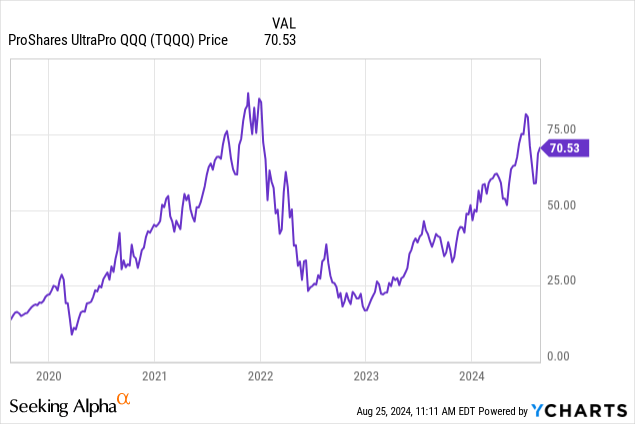
One simple way to prepare for another bear market in Big Tech is to sell and avoid leveraged-long securities like the TQQQ design. Those continuing to hold this ETF must understand the risk of investment losses are sky-high today. Honestly, 3x the losses in the QQQ could be devastating, just like the -70% TQQQ drop during the 2020 pandemic and crushing -80% blow during 2022. A similar percentage dump would actually put price back to $20 to $25, very near 2022’s low number!
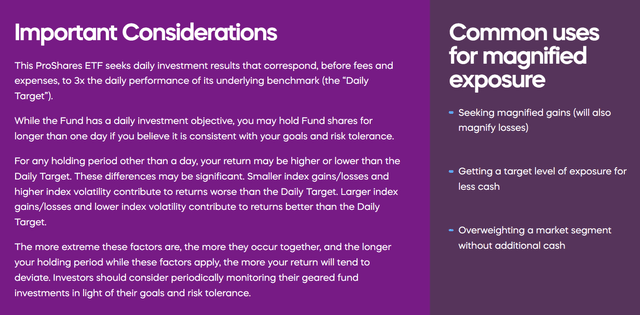
YCharts – TQQQ, Price Changes, 5 Years ProShares Website – TQQQ Risks & Uses, August 25th, 2024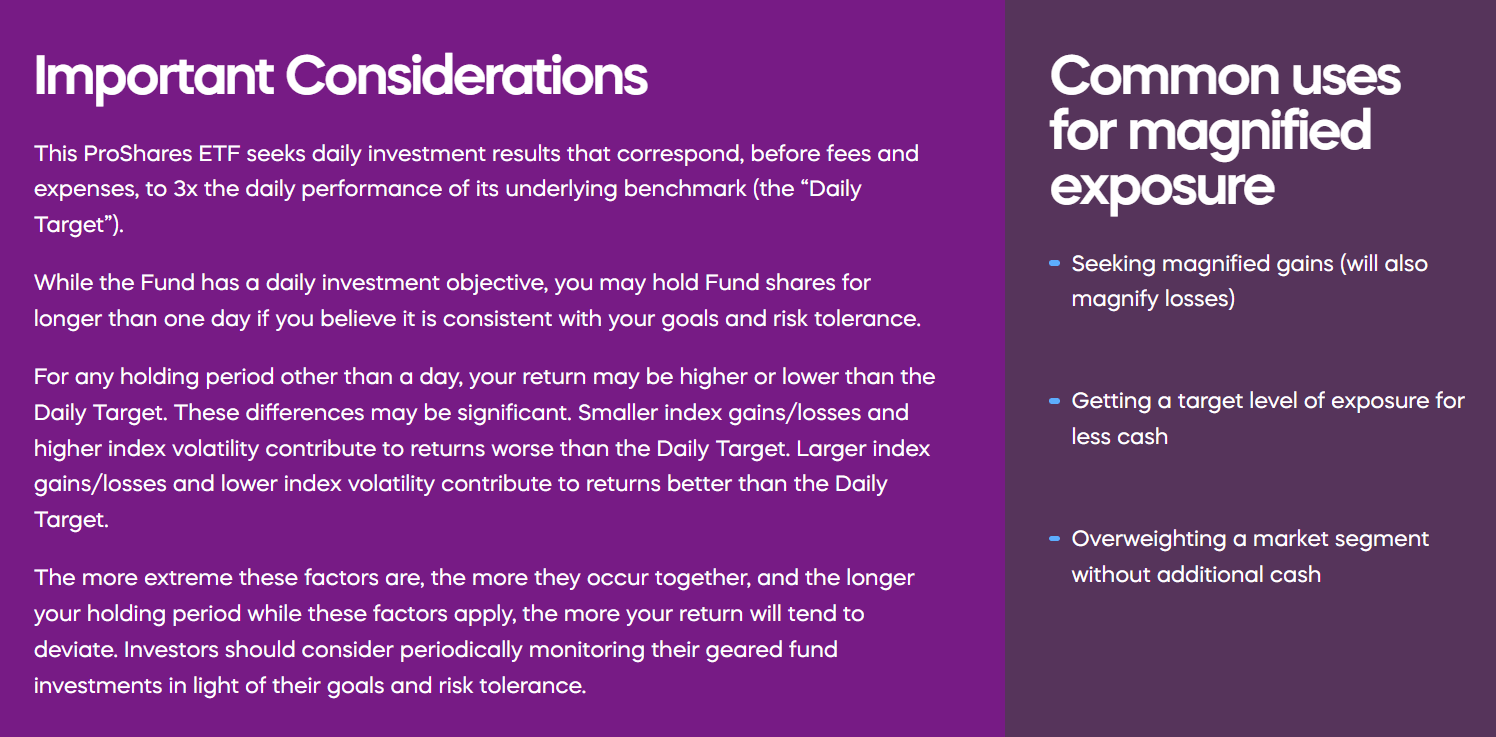
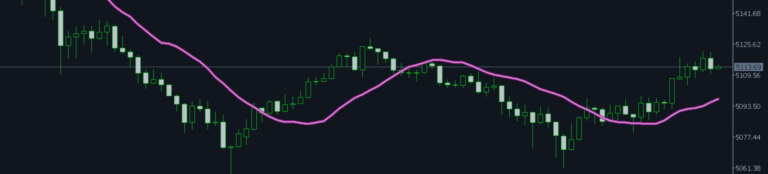
Ease-of-Movement Indicator
What is the 14-day “Ease of Movement” calculation, and what can it tell us? Unusually large drops to 52-week lows or even all-time lows in the EMV calculation can pinpoint a vacuum of buyers, in terms of supply/demand dynamics. The readout from this momentum indicator in July-August is very minor sell volumes have generated truly outsized price declines for a vast number of Big Tech names. What do you think will happen if/when sell volumes pick up? Price is forced to decline to find supply for transactions.
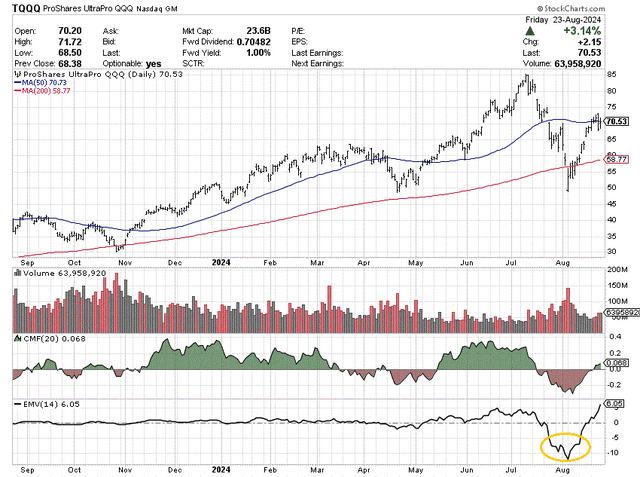
TQQQ just experienced its largest percentage decline since 2022. The good news for holders of the trust is a nice rebound to $71 off the early August low of $49 has opened a smart area to unload your position. If the selloff is to continue, resistance near the 50-day moving average should prove quite monumental.
I have drawn a 12-month chart below of daily price and volume trading activity. I have circled in gold the crazy-bad, all-time low readings in late July and early August for the 14-day EMV calculation. In addition, the 20-day Chaikin Money Flow indicator has corroborated the concept of sizable capital moving out of TQQQ.
StockCharts.com – TQQQ, 1 Year of Daily Price & Volume Changes, Author Reference Point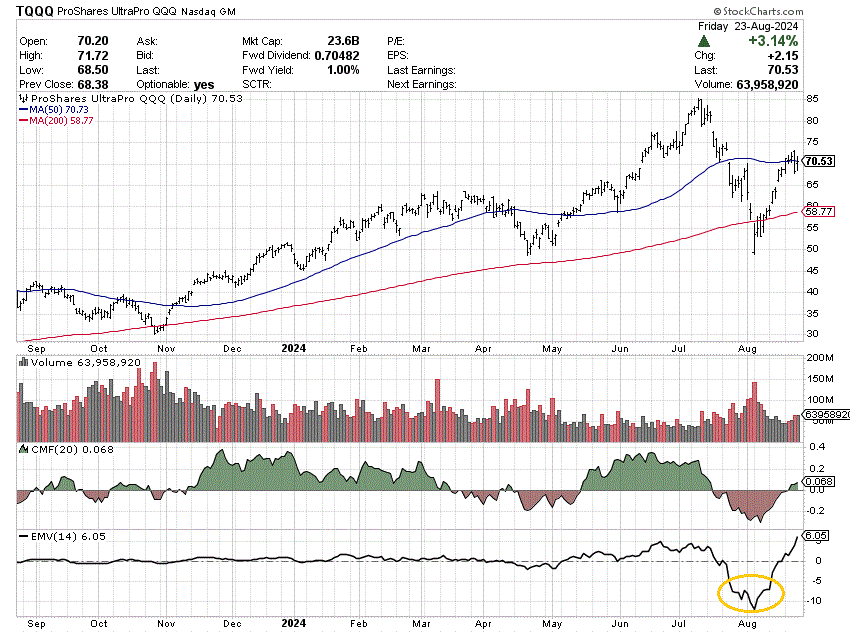
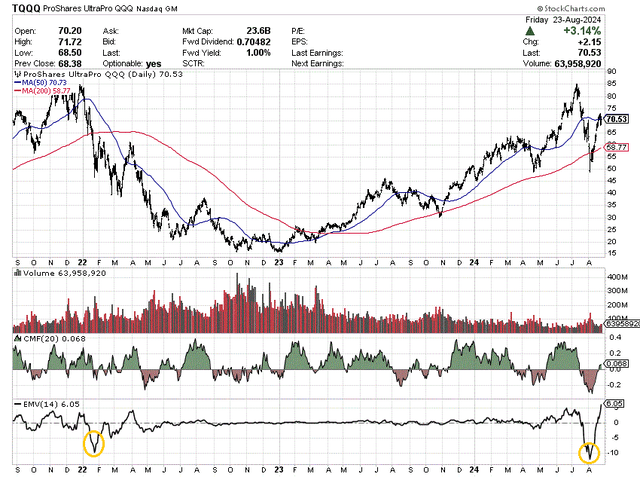
Below you can review how the then record low EMV score in January 2022 screamed investors should get out of Big Tech names and TQQQ specifically. I have circled this experience in gold also. You will notice the best time to buy TQQQ over the last three years was when the EMV score (which is a function of the price level) was flatlining around zero during late 2022 and early 2023. Heavy volume with little price change at a depressed level is typical of major bottoms, while low volume, high price, and volatile EMV scores are the norm at tops.
StockCharts.com – TQQQ, 3 Years of Daily Price & Volume Changes, Author Reference Points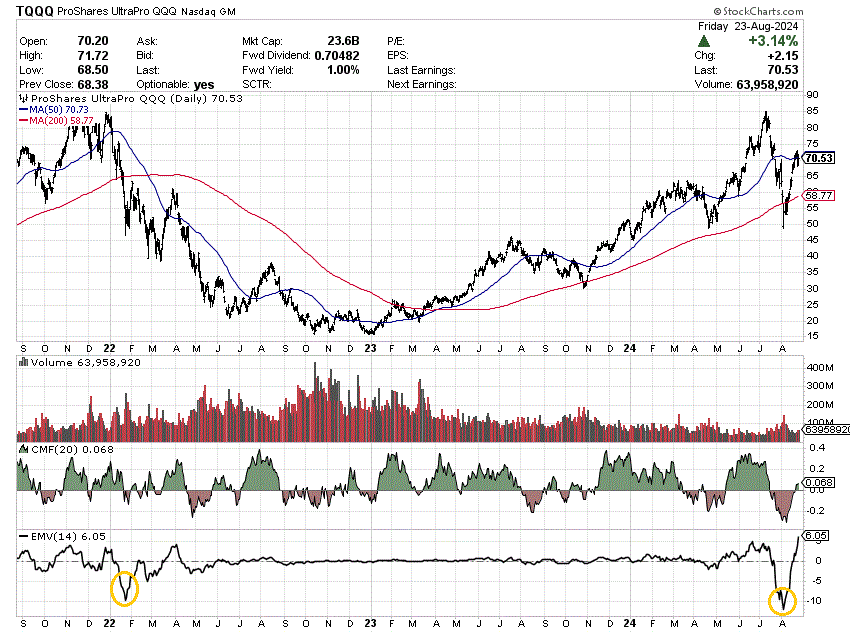
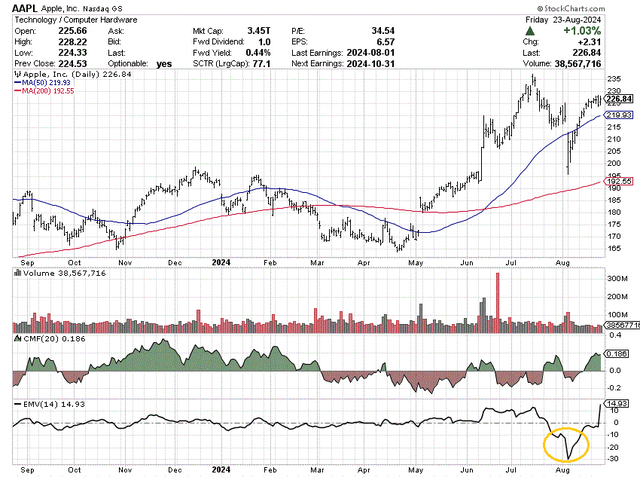
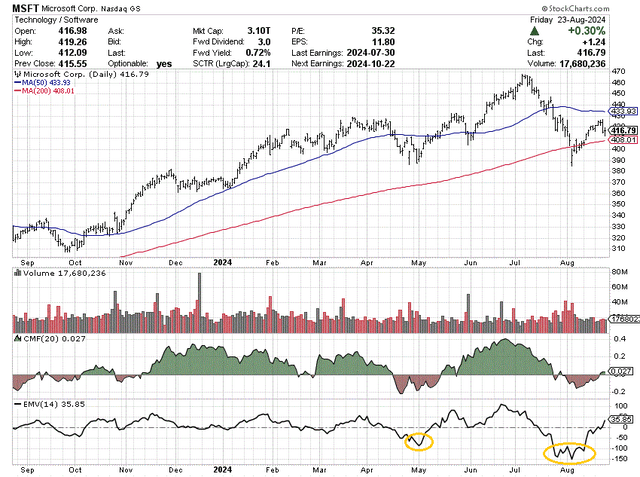
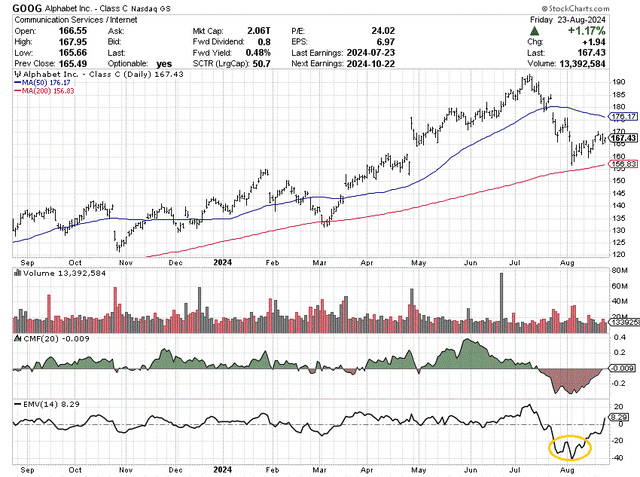
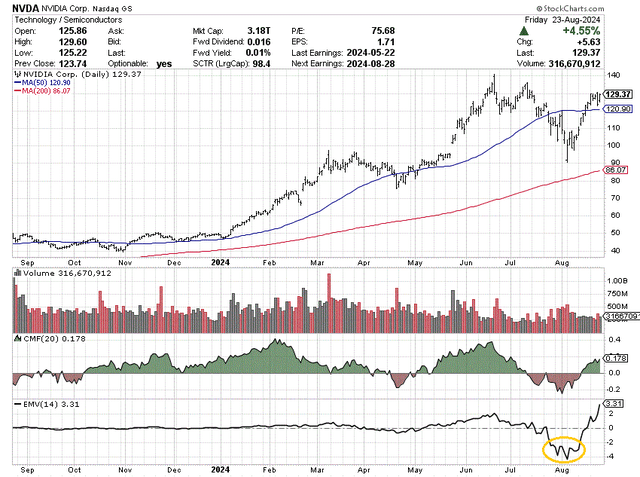
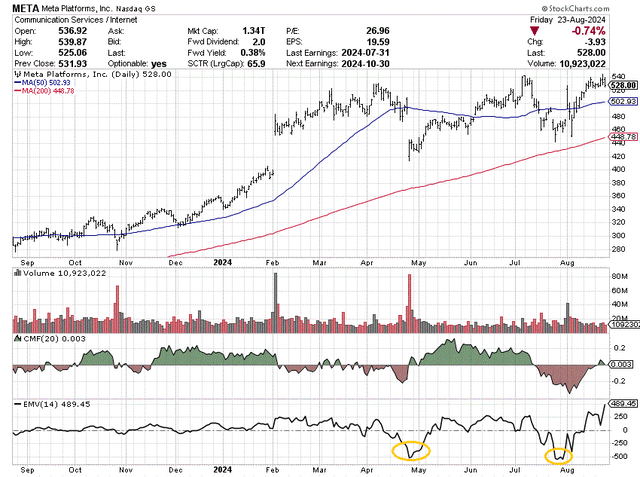
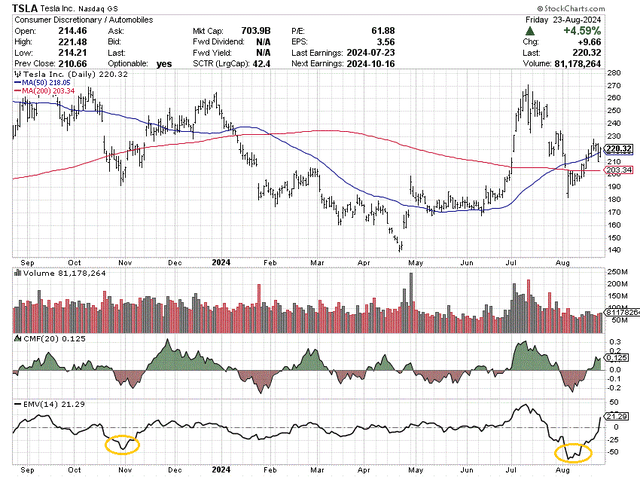
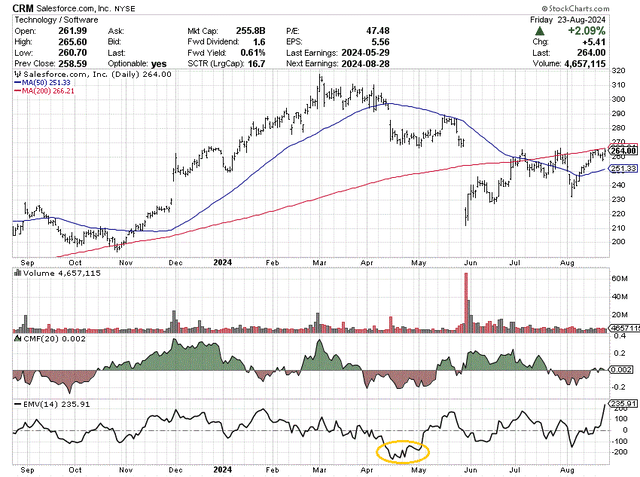
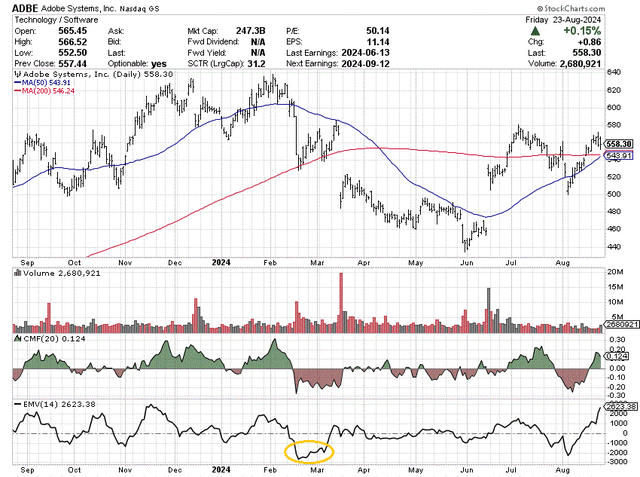
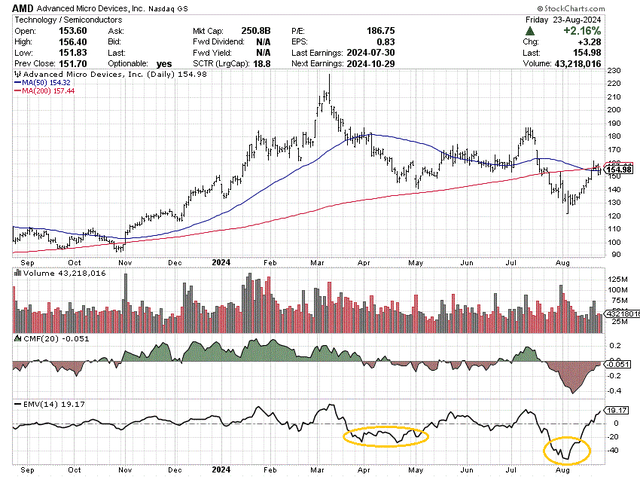
Below, I have charted the sharp deterioration and wild swings in the EMV statistic for a number of QQQ’s highest-weighted Big Tech darlings, with new 52-weeks lows circled in gold. You will notice EMV problems started to appear in the spring. This list includes Apple (AAPL), Microsoft (MSFT), Alphabet (GOOG) (GOOGL), NVIDIA (NVDA), Meta Platforms (META), Amazon (AMZN), Tesla (TSLA), Salesforce (CRM), Adobe (ADBE), and Advanced Micro Devices (AMD).
Apple
StockCharts.com – Apple, 1 Year of Daily Price & Volume Changes, Author Reference Point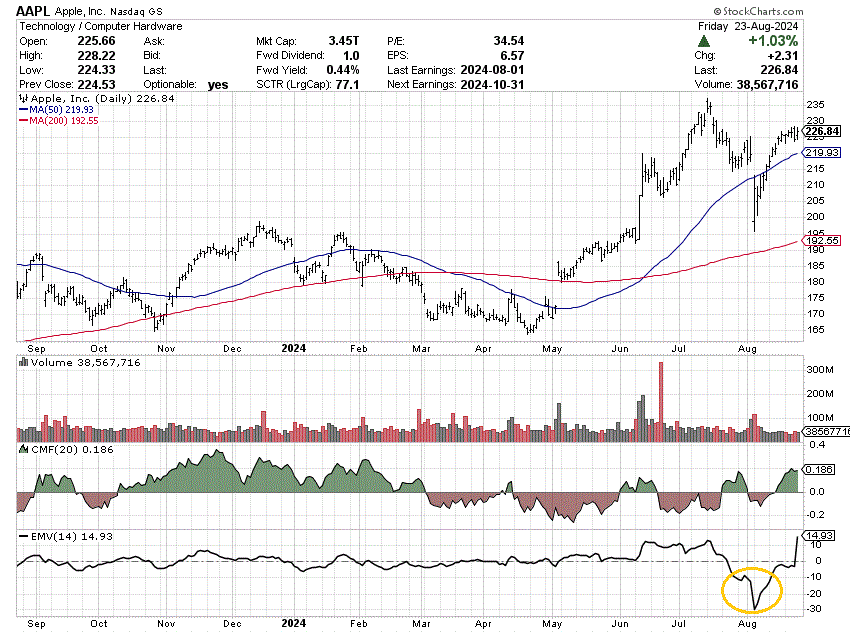
Microsoft
StockCharts.com – Microsoft, 1 Year of Daily Price & Volume Changes, Author Reference Points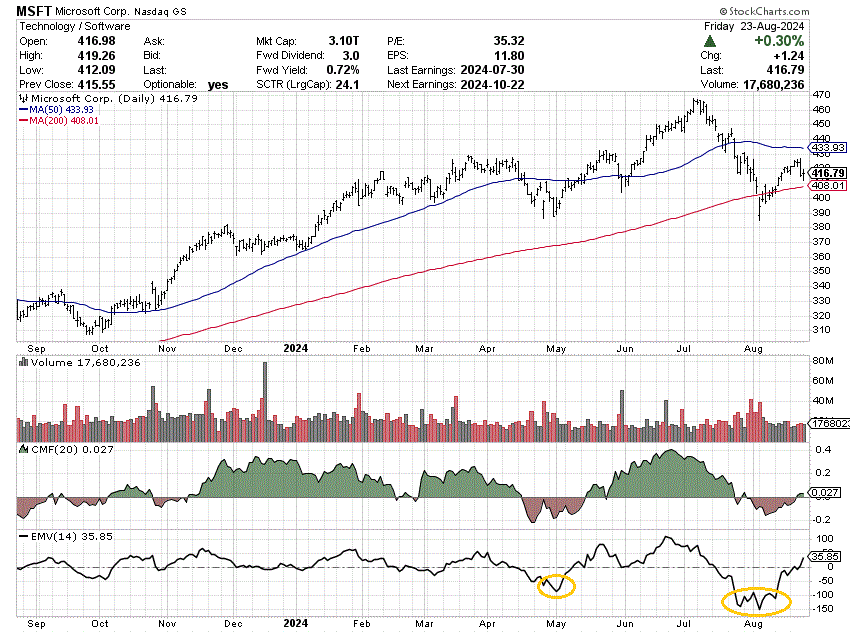
Alphabet
StockCharts.com – Alphabet, 1 Year of Daily Price & Volume Changes, Author Reference Point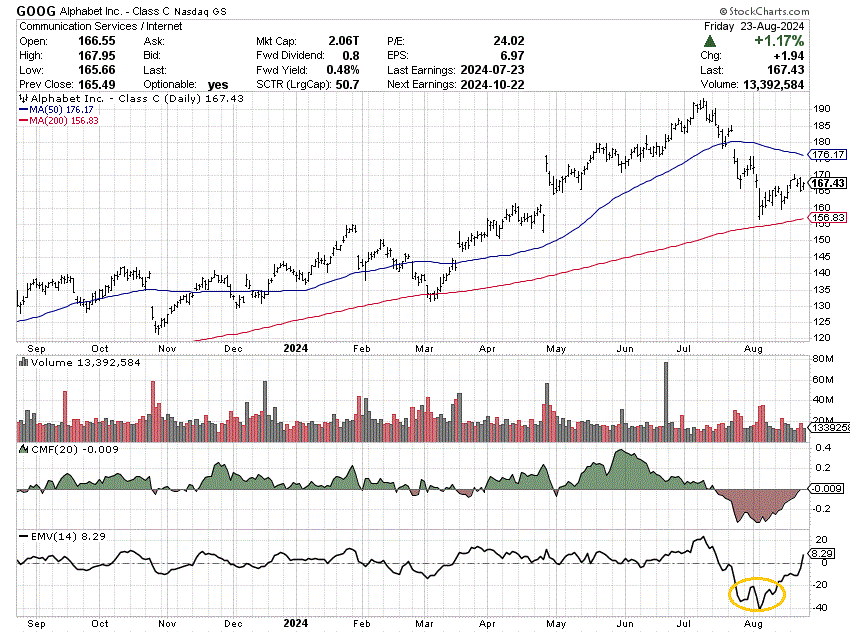
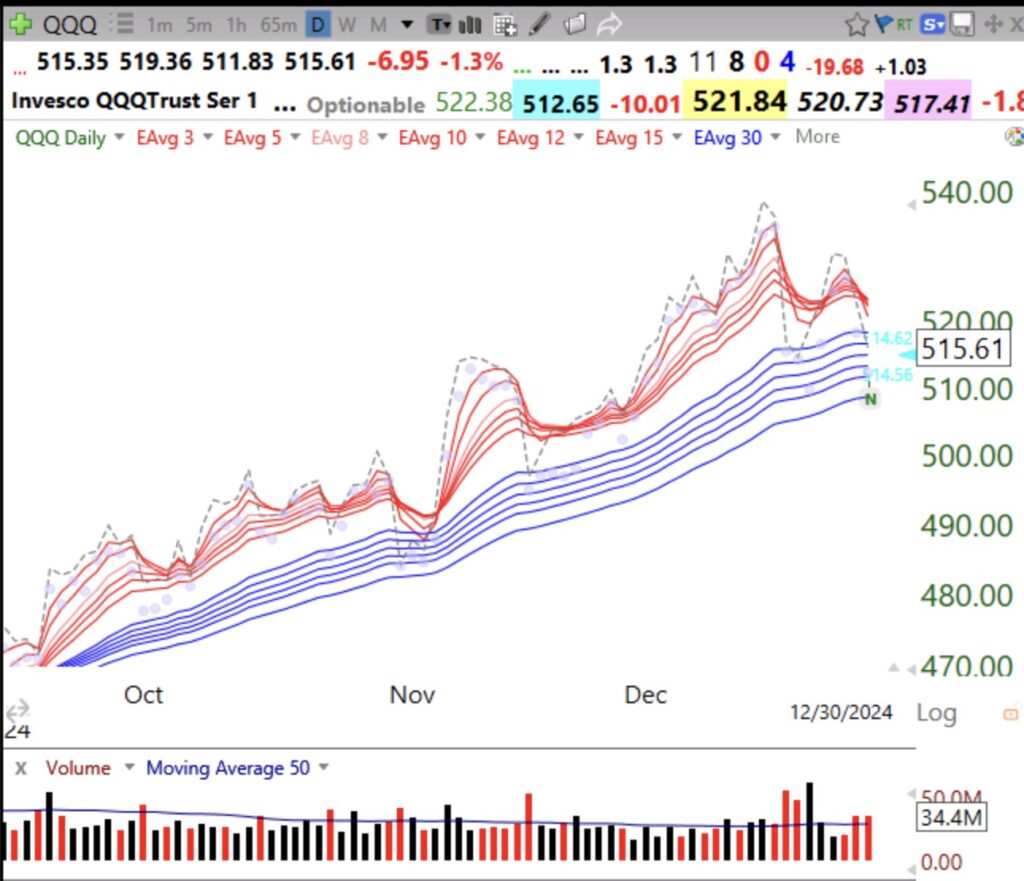
NVIDIA
StockCharts.com – NVIDIA, 1 Year of Daily Price & Volume Changes, Author Reference Point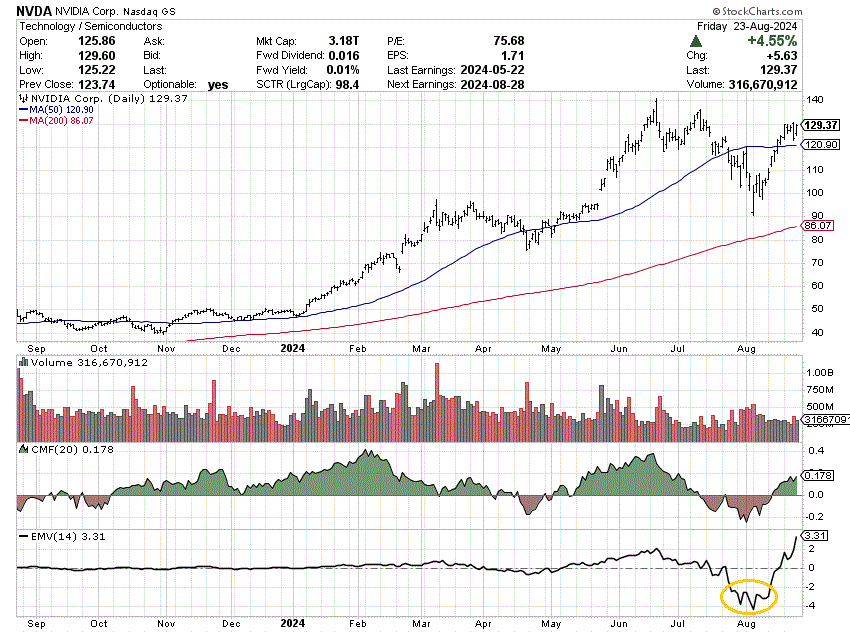
Meta Platforms
StockCharts.com – Meta Platforms, 1 Year of Daily Price & Volume Changes, Author Reference Points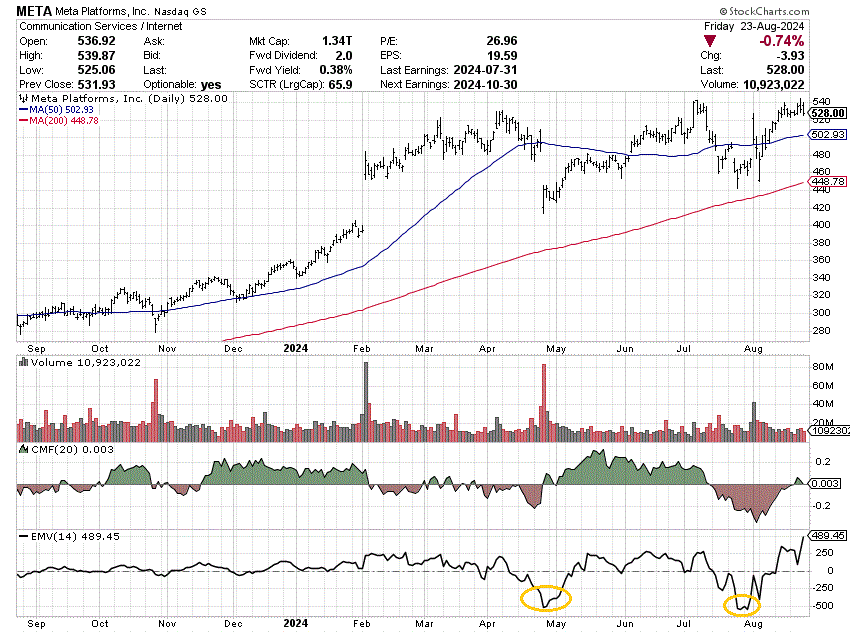
Amazon
StockCharts.com – Amazon, 1 Year of Daily Price & Volume Changes, Author Reference Points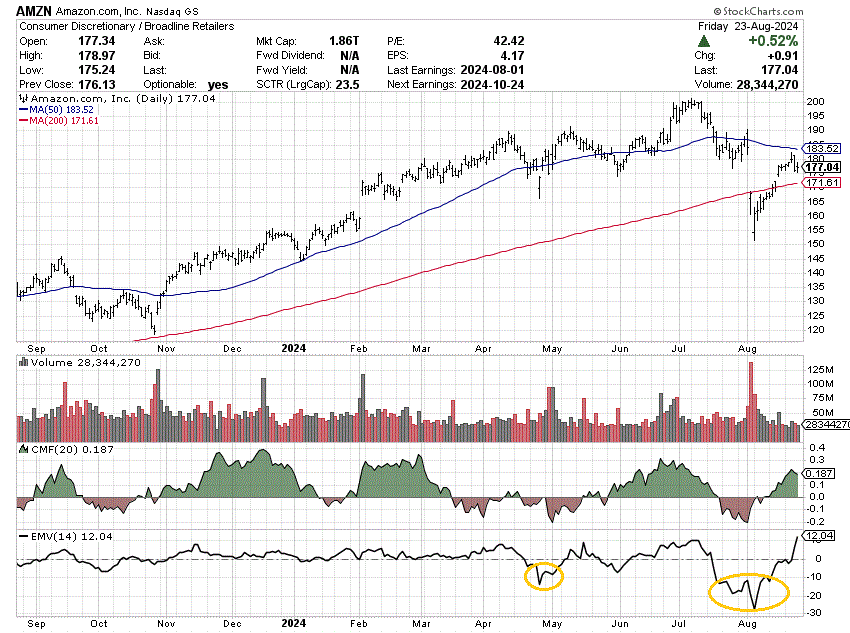
Tesla
StockCharts.com – Tesla, 1 Year of Daily Price & Volume Changes, Author Reference Points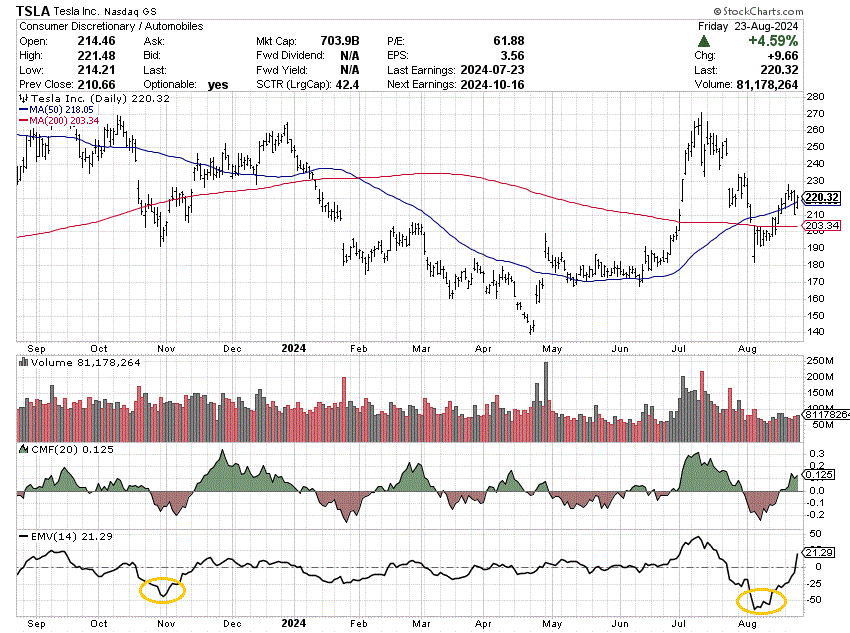
Salesforce
StockCharts.com – Salesforce, 1 Year of Daily Price & Volume Changes, Author Reference Point
Adobe
StockCharts.com – Adobe, 1 Year of Daily Price & Volume Changes, Author Reference Point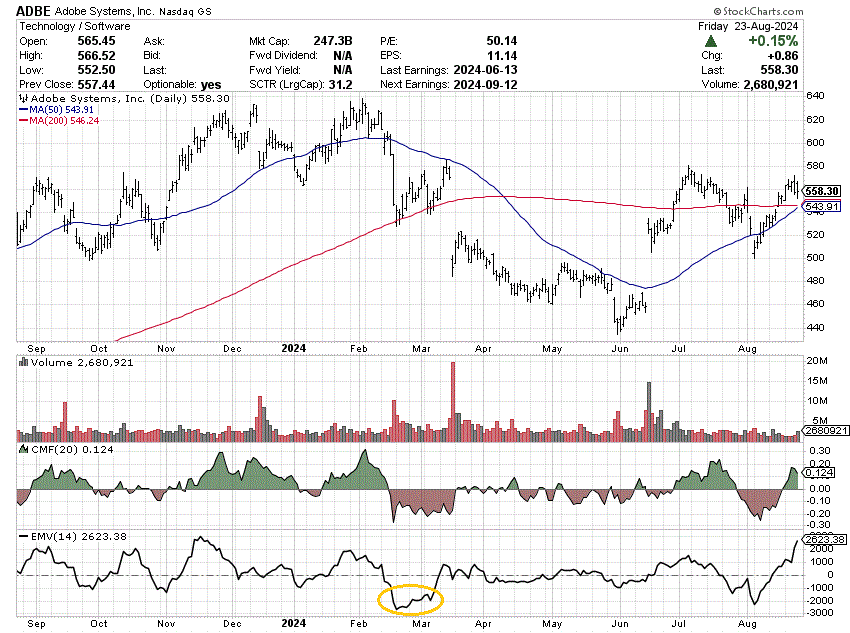
Advanced Micro Devices
StockCharts.com – Advanced Micro Devices, 1 Year of Daily Price & Volume Changes, Author Reference Points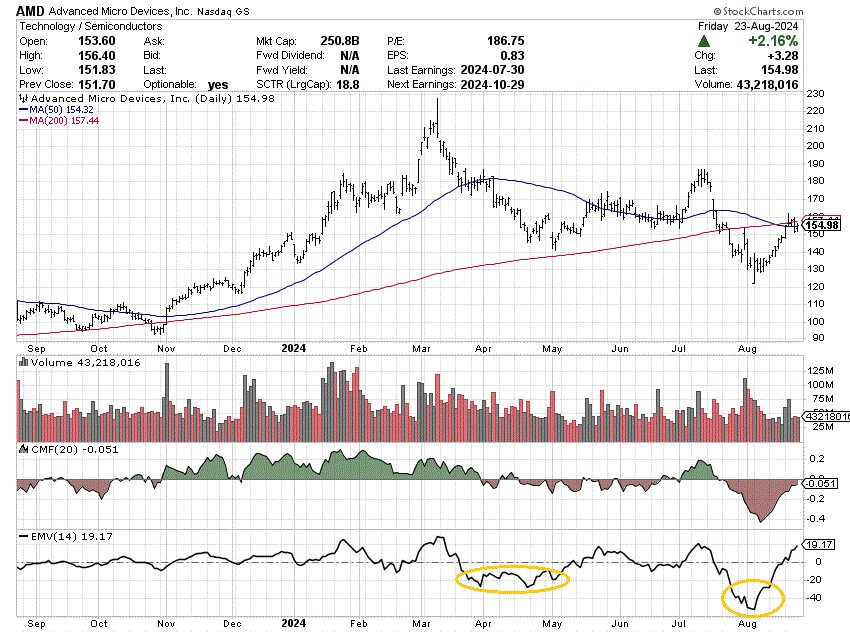
Final Thoughts
I will admit I have been worried about the clearly overvalued technology sector of the market for some time, writing a sell article on the ProShares UltraPro QQQ ETF in November 2023 here (with price at $40). If you feel you must ignore my view based on this earlier call, I completely understand your logic. Just remember, trees only grow so high into the sky. Likewise, there are limits to stock valuation/pricing extremes, especially as operating business growth stalls.
With TQQQ exaggerating QQQ moves to such a degree, on top of leverage costs skewing long-term performance during downturns, keeping this 3x product in your portfolio is akin to playing a high-stakes game of “Press Your Luck.” All told, a sub-$25 price by the end of 2024 would kind of vindicate my warnings to avoid this security. We’ve already experienced two -70% drawdowns in TQQQ over the last five years. Why not a third, as the global economy slows?
I continue to rate TQQQ a Strong Sell for the risk-averse. Conservative investors should just ignore this investment vehicle in their accounts. And, if you own it with decent gains over the recent past, you cannot go broke taking a profit. However, you still can lose your paper profits in a new bear market (and/or economic recession), with 3x the leverage on any drawdown in the NASDAQ 100 index. The total return performance from QQQ’s July 10th peak is testament to the risk-side of the equation for newbies or those caught up in the perma-bull mentality now widespread on Wall Street.
YCharts – TQQQ vs. QQQ, Total Returns, Since July 10th, 2024
What could keep TQQQ above $70 in price the rest of 2024? That’s a great question. I would guess only a true “Goldilocks” economic pattern of rising GDP growth, with even lower inflation and interest rates, is now necessary to prevent a substantial selloff in Big Tech stocks.
Nevertheless, if interest rates rise from any jump in crude oil (as commodity inflation returns) or the global economy slides into recession, a serious bear market on Wall Street will be difficult to avoid.
Thanks for reading. Please consider this article a first step in your due diligence process. Consulting with a registered and experienced investment advisor is recommended before making any trade.
Source link