The Boyar Value Group’s Q2 2025 Letter


Andrei Askirka/iStock via Getty Images
“Since quantitative information about the present is so readily available, success in the competitive field of investing is more likely to be the result of superior judgments about qualitative factors and future events.” – Howard Marks
A Market at New Heights—But Not Without Risks Beneath the Surface
The U.S. stock market bounced back sharply in the second quarter of 2025, with the S&P 500 gaining 10.9%—erasing its 1Q losses and bringing its year-to-date return to +6.2%. While this may appear to be another chapter in the post-pandemic bull run (which briefly paused in 2022 due to inflation concerns), a closer look reveals a far more complex picture.
The most jarring moment came in early April, when President Trump’s surprise “Liberation Day” tariff announcement rattled global markets. The proposal included a 10% universal tariff, along with reciprocal tariffs ranging from 11% to 50% on countries with which the U.S. runs the largest trade deficits. Some country-specific rates were even higher—China, in particular, faced tariffs so steep they would have made U.S.-China trade virtually uneconomical. The result: the average effective U.S. tariff rate surged to its highest level since the 1930s, shifting investor perception from tactical brinkmanship to a potential structural shift in trade policy.
Within days of President Trump’s announcement, the VIX surged to 52.3—its highest reading since the early pandemic days. That level is exceedingly rare: the VIX has only closed above 50 on 75 trading days over the past 35 years. Those events have historically clustered around major crises—the dot-com bust, the global financial crisis, COVID-19, and now “Liberation Day.” The market’s response—across both bonds and equities—was brutal, with the S&P 500 falling 19% from its prior high (just shy of bear market territory) by the April 8 low, prompting the administration to pause most of the reciprocal tariffs on the very next day.
Counterintuitively, there’s a silver lining in extreme “fear index” readings: according to The Motley Fool, after the VIX closed above 50, the S&P 500 has historically returned an average of 34.4% over the next year (interestingly, since the VIX closed above 50 on April 8, the S&P 500 has already advanced 26%!), and 71.6% over the next three years. The VIX quickly retreated after most tariffs were paused, closing the quarter at 16.7 as markets recovered their earlier losses.
This wasn’t the only policy risk weighing on sentiment. Concerns over Fed independence resurfaced as speculation mounted that Trump might replace Chair Powell before his term ends. At the same time, Moody’s downgraded the U.S. credit rating from Aaa to Aa1—the first such move in over a decade (and leaving the U.S. without a AAA rating by any of the rating agencies)—citing persistent deficits, political dysfunction, and growing doubts about fiscal discipline. While the Fed has held rates steady since December 2024, growing divisions between dovish and hawkish voices have added a new layer of policy uncertainty heading into the second half. Combined with elevated valuations, Middle East tensions, continued friction with Russia, and a resurgent international market, it made for a quarter that was anything but tranquil beneath the surface.
A Tale of Two Quarters
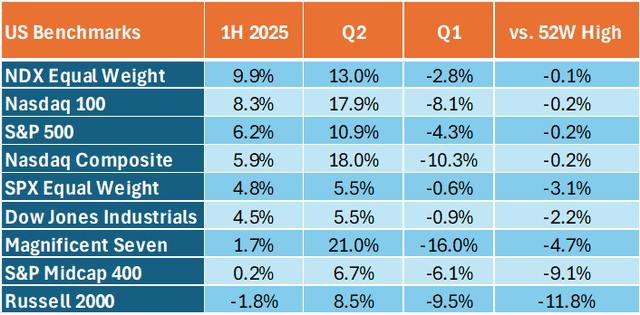
The first half of 2025 was a tale of two very different quarters. The Russell 2000 dropped -9.5% in Q1 before rebounding by +8.5% in Q2. The Nasdaq Composite, down more than -10% in Q1, surged +18% in Q2. The Magnificent Seven, long the engine of market gains, posted an eye-popping +21% return in Q2—but that followed a bruising -16% Q1 decline (leaving it only slightly ahead of the beginning of the year).
Source: Nasdaq.com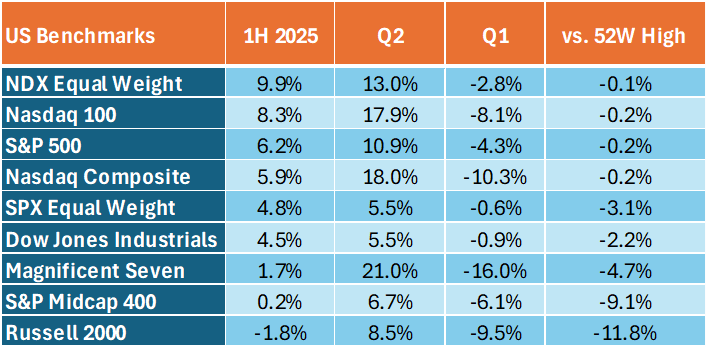
This reversal was driven by a combination of trade policy relief, a surprisingly resilient labor market, and a still-strong consumer—all in the face of mounting economic uncertainty. Unemployment remained near 4% throughout the quarter, and job growth averaged roughly 150,000 per month, helping support wage gains in the 3.5% to 4+% range.
Consumer spending, while not robust, held up better than expected, with many payments companies and retailers reporting steady demand. A series of selective tariff rollbacks—sometimes referred to as TACO (“Trump Always Chickens Out”)—such as exemptions for electronics, a détente with China, and a delayed tariff deadline for the EU, helped ease investor anxiety and reverse what had been shaping up to be a difficult quarter for equities.
Strong corporate earnings also helped lift the market. Earnings rose 12.7% in Q1—nearly double analysts’ expectations. At the same time, inflation came in lower than expected, and the job market remained solid, with steady hiring and wage growth. All of this helped support the idea that, while the U.S. economy faces real challenges, it’s still holding up better than many had feared. Oil prices also dropped nearly 9% during the quarter, which—much like a tax cut—reduced costs for both consumers and businesses.
Valuations Are High—But Not Uniformly So
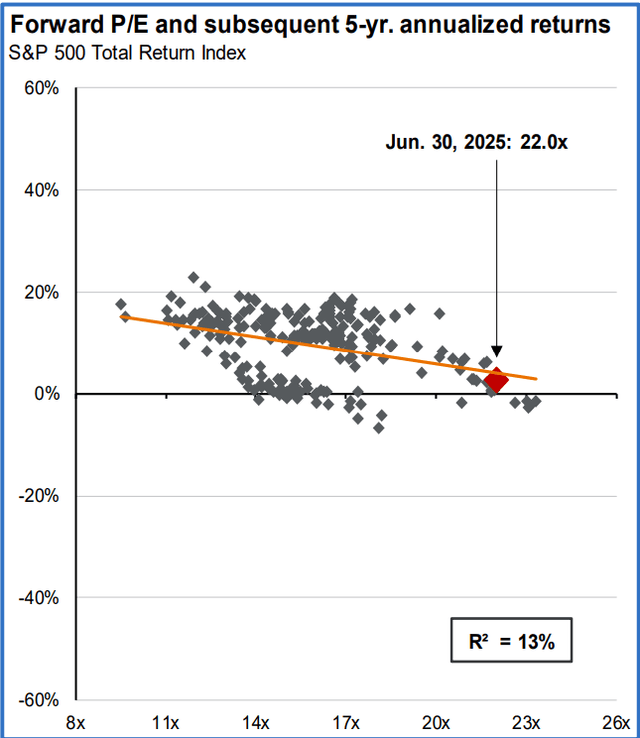
The stock market currently looks expensive by historical standards. The S&P 500 (SP500) is currently trading at about 22 times expected earnings—well above its long-term average of around 16.5x (although it is worth noting that in the April selloff, the S&P reached a more “reasonable 18x”). Valuations this high don’t automatically mean a downturn is coming, but they do suggest that future returns could be limited. In fact, according to JPMorgan, when markets have traded at similar valuation levels in the past, average returns over the next five years have tended to be well below normal.
What’s more, the equity risk premium—the extra return investors earn for taking on stock market risk instead of holding U.S. Treasuries—has fallen to just 2.4%, its lowest level since the early 2000s. In other words, investors are now taking on more risk for less potential reward. While such data suggests the overall stock market returns over the next five years may be pedestrian, we believe that individual stocks—particularly those in the small- and mid-cap space—could experience far more attractive gains.
Source: JP Morgan Guide to the Markets
Small-Cap Stocks: A Rare Bargain?
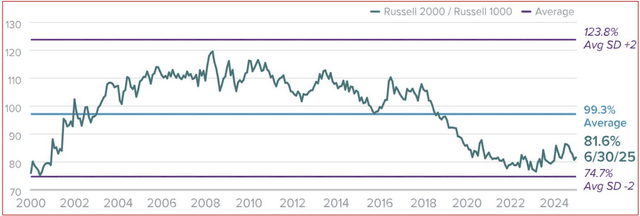
Small-cap stocks, as represented by the Russell 2000, declined 1.8% in the first half of 2025 and continue to lag their large-cap peers by a wide margin—a trend that has persisted since May 2019, during which the S&P 500 has advanced 136% compared to just 54% for the Russell 2000. Yet this prolonged underperformance has pushed small-cap valuations to multi-decade lows. On a relative basis, small caps are now trading near a 20-year low versus large caps based on enterprise value to EBIT—a valuation gap not seen since the aftermath of the dot-com bubble.
Russell 2000 vs. Russell 1000 Median LTM EV/EBIT (ex. Negative EBIT Companies)
From 3/31/20 through 3/31/25
Source: FactSet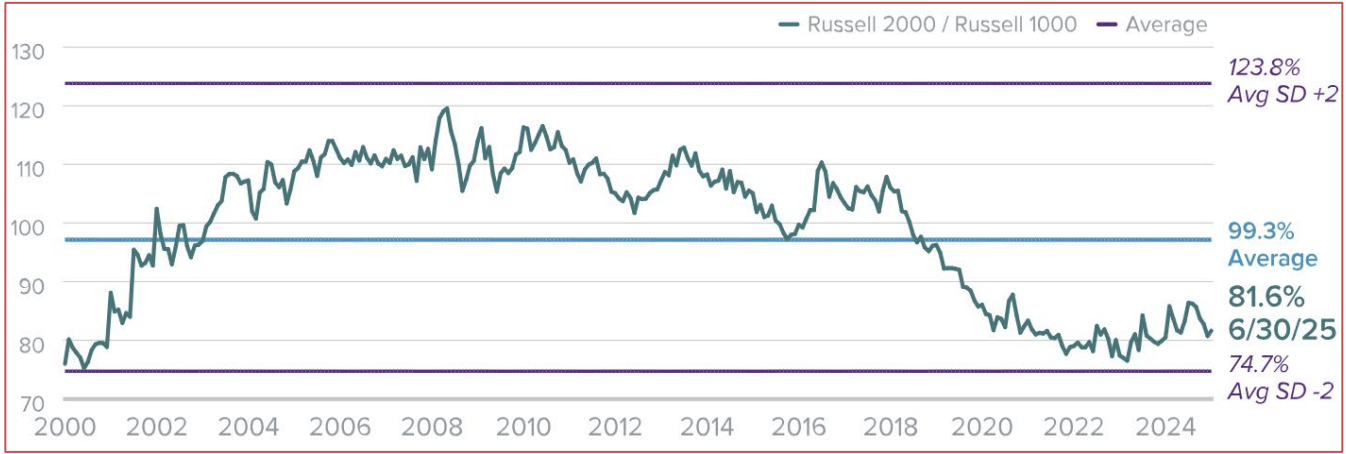
Historically, such wide performance spreads have eventually closed. In fact, since the early 1990s, the Russell 2000 has outperformed the S&P 500 on a cumulative basis, even after a long stretch of underperformance. That’s a key point: despite recent weakness, small caps have a long track record of delivering strong long-term returns—and after years in the wilderness, they may finally be due to play catch-up.
Risk Investing and the Power of Compounding
Source: JP Morgan Guide to the Markets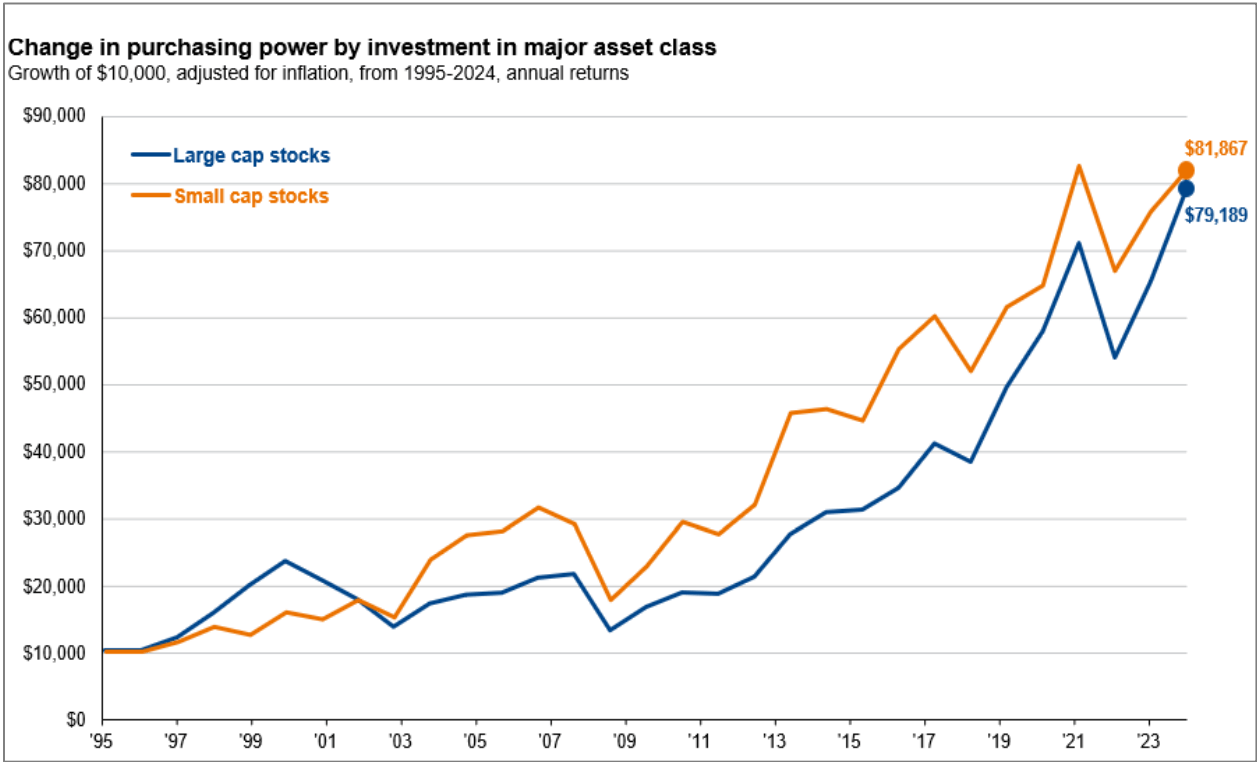
The setup appears increasingly favorable. If interest rates ease and domestic manufacturing continues to expand, smaller companies—many of which carry floating-rate debt and generate most of their revenues domestically—stand to benefit disproportionately. And if the pendulum does swing back, history suggests the rally in small caps could be both sharp and sustained.
International Stocks Shine as the Dollar Stumbles
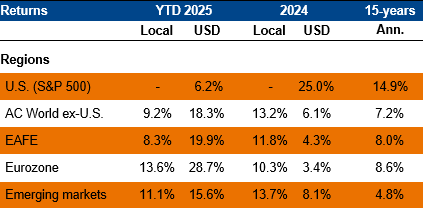
Source: JP Morgan Guide to the Markets
One of the standout stories of the first half of 2025 was the resurgence of international equities. The average international mutual fund gained 11.9% in Q2 and is now up 19% year-to-date—well ahead of U.S. stock fund returns. Emerging markets alone added $1.8 trillion in shareholder wealth, aided by easing trade tensions and one major tailwind: the weak dollar.
The U.S. dollar index has fallen nearly 11% year-to-date—its worst start to a year since 1973, when the U.S. formally cut ties between the dollar and gold. The 7% drop in Q2 alone gave international returns an extra boost, as gains in foreign markets became more valuable when converted back into dollars. In our 4Q 2024 letter, we noted that the strong dollar—when the euro hovered around $1.03—might make it a good time for Americans to book a European vacation. With the euro now closer to $1.17, that trip has gotten much more expensive. It’s a small but tangible example of how quickly currency shifts can impact both tourism demand and investment returns.
The Implications of a Weaker Dollar
The implications of a weak dollar are significant. For businesses, a softer dollar can help U.S. exporters by making their goods and services cheaper for overseas buyers. It also boosts the reported earnings of large multinationals that generate revenue abroad, as foreign currency profits translate into more dollars on the income statement. And for U.S. investors holding international stocks, currency weakness can amplify returns.
That said, there are downsides. A falling dollar raises the cost of imported goods, which can contribute to inflation and squeeze companies that rely on foreign inputs. It may also reflect broader concerns about the lack of U.S. fiscal discipline, rising deficits, or political instability—factors that can eventually weigh on investor confidence.
In the short run, the dollar’s decline has clearly benefited international markets. But like many things in investing, what starts out as a tailwind can eventually become a headwind if left unchecked.
Sentiment Is High—Perhaps Too High
Wall Street analysts are now more bullish than they’ve been in years: 56.4% of all stock ratings are now “buys,” the highest level since early 2022—just before the S&P 500 went on to decline more than 25% from its high. In Q2 2025, equity funds also saw $35.7 billion in outflows, while bond funds pulled in nearly $55 billion, according to data from The Wall Street Journal. Retail investors continued to “buy the dip” aggressively—especially in technology shares—while corporate buyback activity remained elevated, with expectations for over $1 trillion in repurchases this year.
Gold, often seen as a hedge against inflation and uncertainty, climbed another 5% in Q2 after a 20% increase in Q1. Even Bitcoin—now back above $100,000—has joined the rally, a signal that speculative risk appetite is alive and well. Meanwhile, before the quarter was through, the S&P 500 fully reversed from its tariff-induced selloff to set a new all-time high, while the VIX settled back to a pre-“Liberation Day” lull. Taken together, this paints a picture of a market that is confident—but perhaps overly so.
So, Where Does That Leave Us?
With indices near record highs, valuations elevated, and macro risks resurfacing, it’s reasonable to ask: how can investors position themselves?
As always, we believe the best approach is to focus on individual companies—not headlines. Even in an expensive market, we continue to find attractively priced businesses that are underfollowed, misunderstood, or temporarily out of favor. Many of these companies have strong balance sheets, durable competitive positions, and clear catalysts for value realization.
These opportunities don’t always align with short-term market momentum—but over time, we believe they offer the best path to compounding wealth. According to JPMorgan, since 1950 there has never been a 20-year period in which U.S. equity investors failed to earn at least 6% annually.
Staying the course has always worked best—not because it’s easy, but because it’s rarely popular in the moment.
Despite the noise—whether from Washington, Wall Street, or the geopolitical stage—we remain focused on uncovering value in places others overlook. We don’t chase fads or trade headlines. We do our homework, invest with discipline, and aim to deliver results over time—not overnight.
Best regards,
Mark A. Boyar
Jonathan I. Boyar
| Important Disclaimer The information herein is provided by Boyar’s Intrinsic Value Research LLC (“Boyar Research”) and: (a) is for general, informational purposes only; (b) is not tailored to the specific investment needs of any specific person or entity; and (c) should not be construed as investment advice. Boyar Research does not offer investment advisory services and is not an investment adviser registered with the U.S. Securities and Exchange Commission (“SEC”) or any other regulatory body. Any opinion expressed herein represent current opinions of Boyar Research only, and no representation is made with respect to the accuracy, completeness or timeliness of the information herein. Boyar Research assumes no obligation to update or revise such information. In addition, certain information herein has been provided by and/or is based on third party sources, and, although Boyar Research believes this information to be reliable, Boyar Research has not independently verified such information and is not responsible for third-party errors. You should not assume that any investment discussed herein will be profitable or that any investment decisions in the future will be profitable. Investing in securities involves risk, including the possible loss of principal. Important Information: Past performance does not guarantee future results. Any companies mentioned in this are for informational purposes only and the performance of the stock selected is not indicative of the performance of the stocks profiled in Boyar Research, the performance of the stocks selected, and the performance of Boyar Research may in fact diverge materially. This information is not a recommendation, or an offer to sell, or a solicitation of any offer to buy, an interest in any security, including an interest in any investment vehicle managed or advised by affiliates of Boyar Research. Any information that may be considered advice concerning a federal tax issue is not intended to be used, and cannot be used, for the purposes of (i) avoiding penalties imposed under the United States Internal Revenue Code or (ii) promoting, marketing or recommending to another party any transaction or matter discussed herein. |
Editor’s Note: The summary bullets for this article were chosen by Seeking Alpha editors.
Editor’s Note: This article covers one or more microcap stocks. Please be aware of the risks associated with these stocks.
Source link