
TREND PRO ➤Trend reversals with entry points displayed.


![]()
MT4 ⮞ CLICK HERE ⮜ MT4
MT5 ⮞ CLICK HERE ⮜ MT5
TPSproTrend PRO – is a trend indicator that automatically analyzes the market and provides information about the trend and its changes, as well as displays entry points for trades without repainting! Movement in financial markets usually does not occur linearly: prices show a tendency to rise and fall. To identify trends in the currency market, traders use various methods and approaches. The most accurate of them is the use of technical analysis, but this process requires deep knowledge and is not simple. When a trader understands concepts such as impulse and impulse level, they can observe how prices pass at least two correct impulses in one direction or another. Thanks to our knowledge, we can accurately identify extremums of each market movement in the form of highs and lows, where major participants were present, whose influence affected the dynamics of the market chart. A thorough analysis of each candle and each impulse, as well as the determination of extremums, is carried out automatically with the help of the TPSpro TREND PRO indicator. The created algorithm correctly identifies the specified system tools by approximately 99.9%. The indicator uses each candle, analyzing them separately, attributing them to different impulses – an upward or downward impulse. The indicator is easy to use, making it an excellent tool for both beginners and professionals.
The TPSproTrend PRO – indicator displays market lows and highs on the chart, as well as trend reversal points and breakouts (double trend reversal or more). The algorithm for determining extremes is based on the assertion that the price moves at least in two impulses (“rise-pullback-rise” or “fall-pullback-fall”). Thus, the search for lows and highs is based on a thorough analysis of each candle and their combination. The trend reversal is identified using a standard technical analysis algorithm – breaking the high in a downtrend indicates a trend reversal from a downtrend to an uptrend, and vice versa; breaking the low in an uptrend indicates a trend reversal from an uptrend to a downtrend.
ADVANTAGES
- Simple, visual, and effective trend detection.
- Ability to filter and enhance trading strategies.
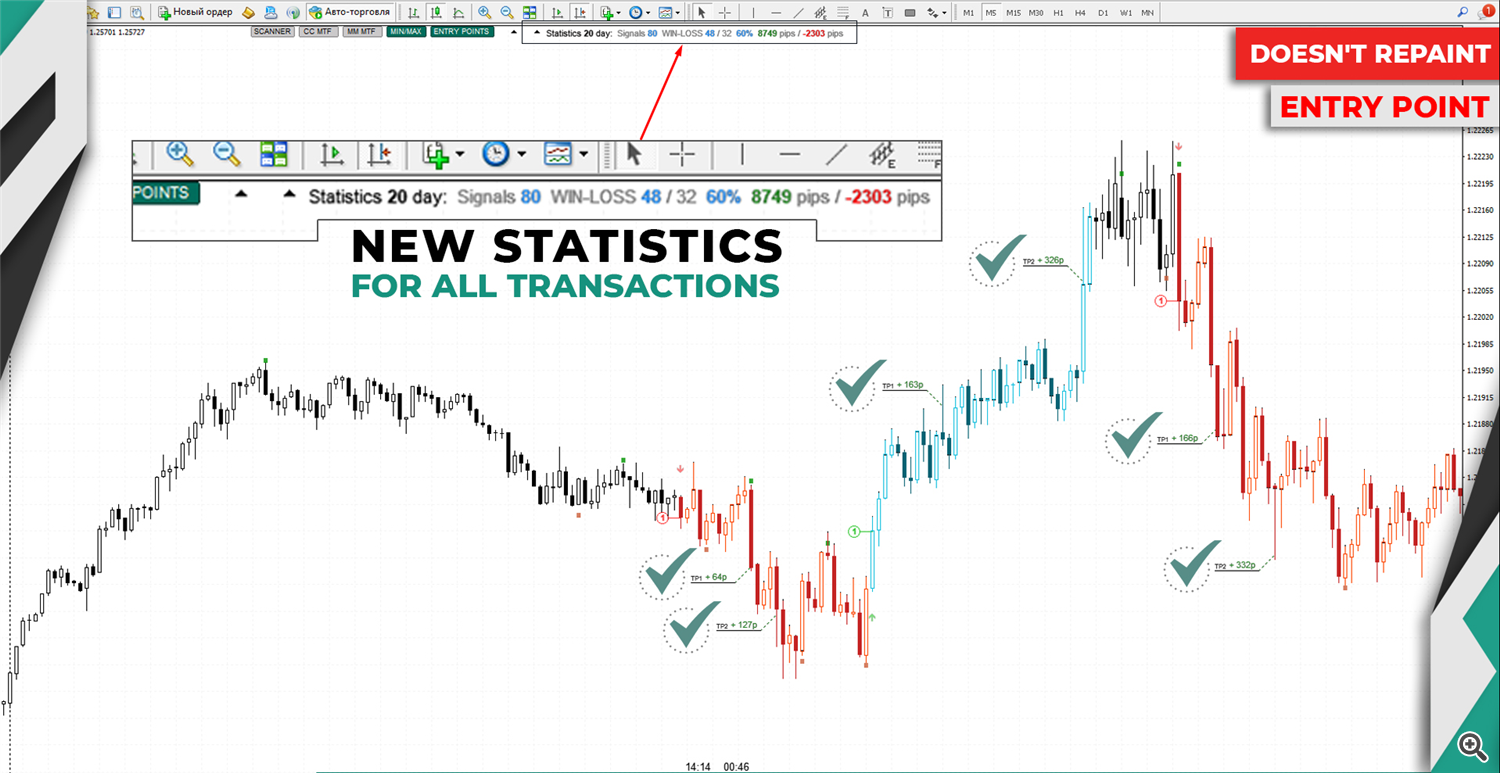
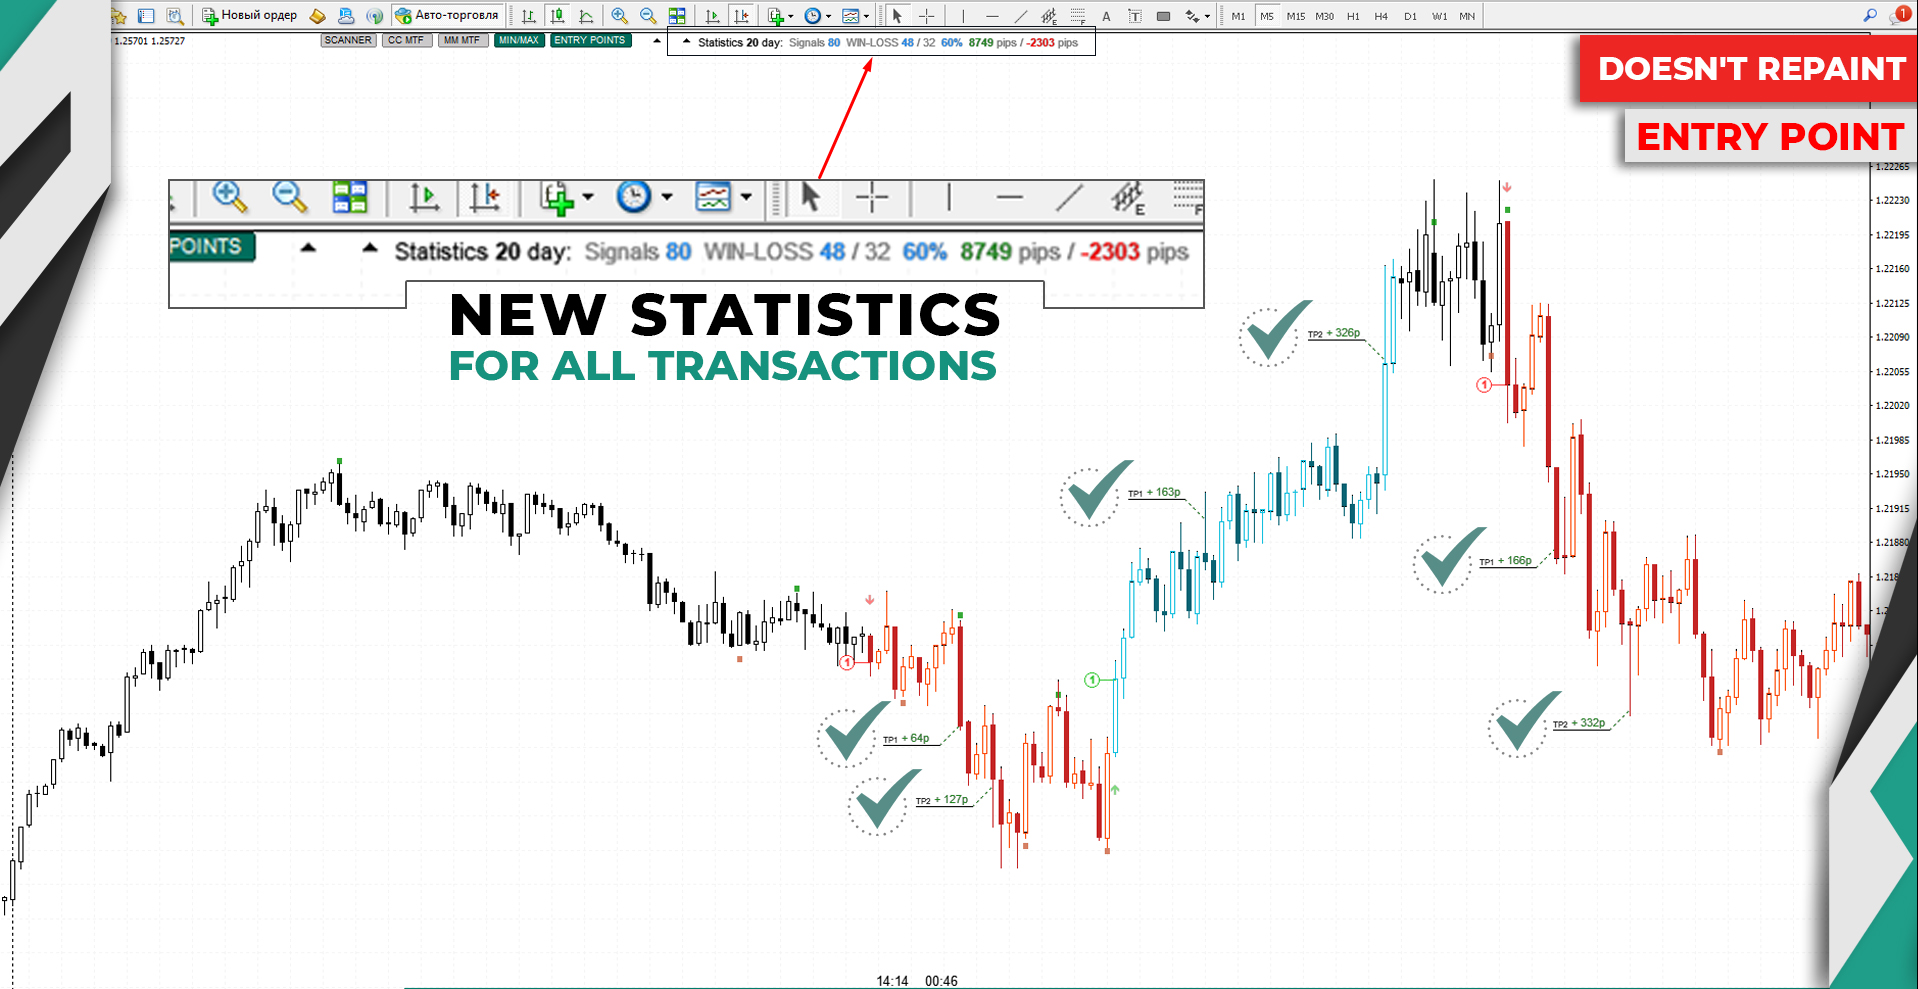
- Enhanced calculation of statistics for entry points, take-profit, and exit signals.
- The indicator never redraws, recalculates, or rebuilds signals.
- Signals are strictly provided On Bar Close.
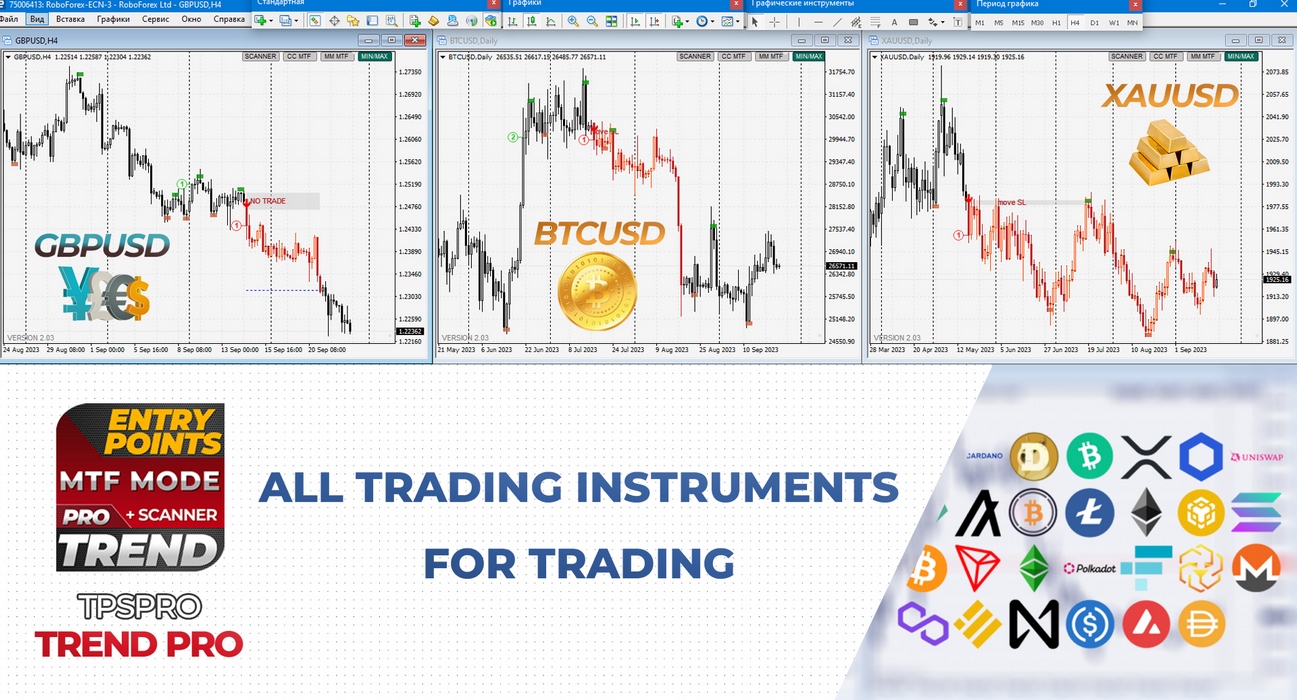
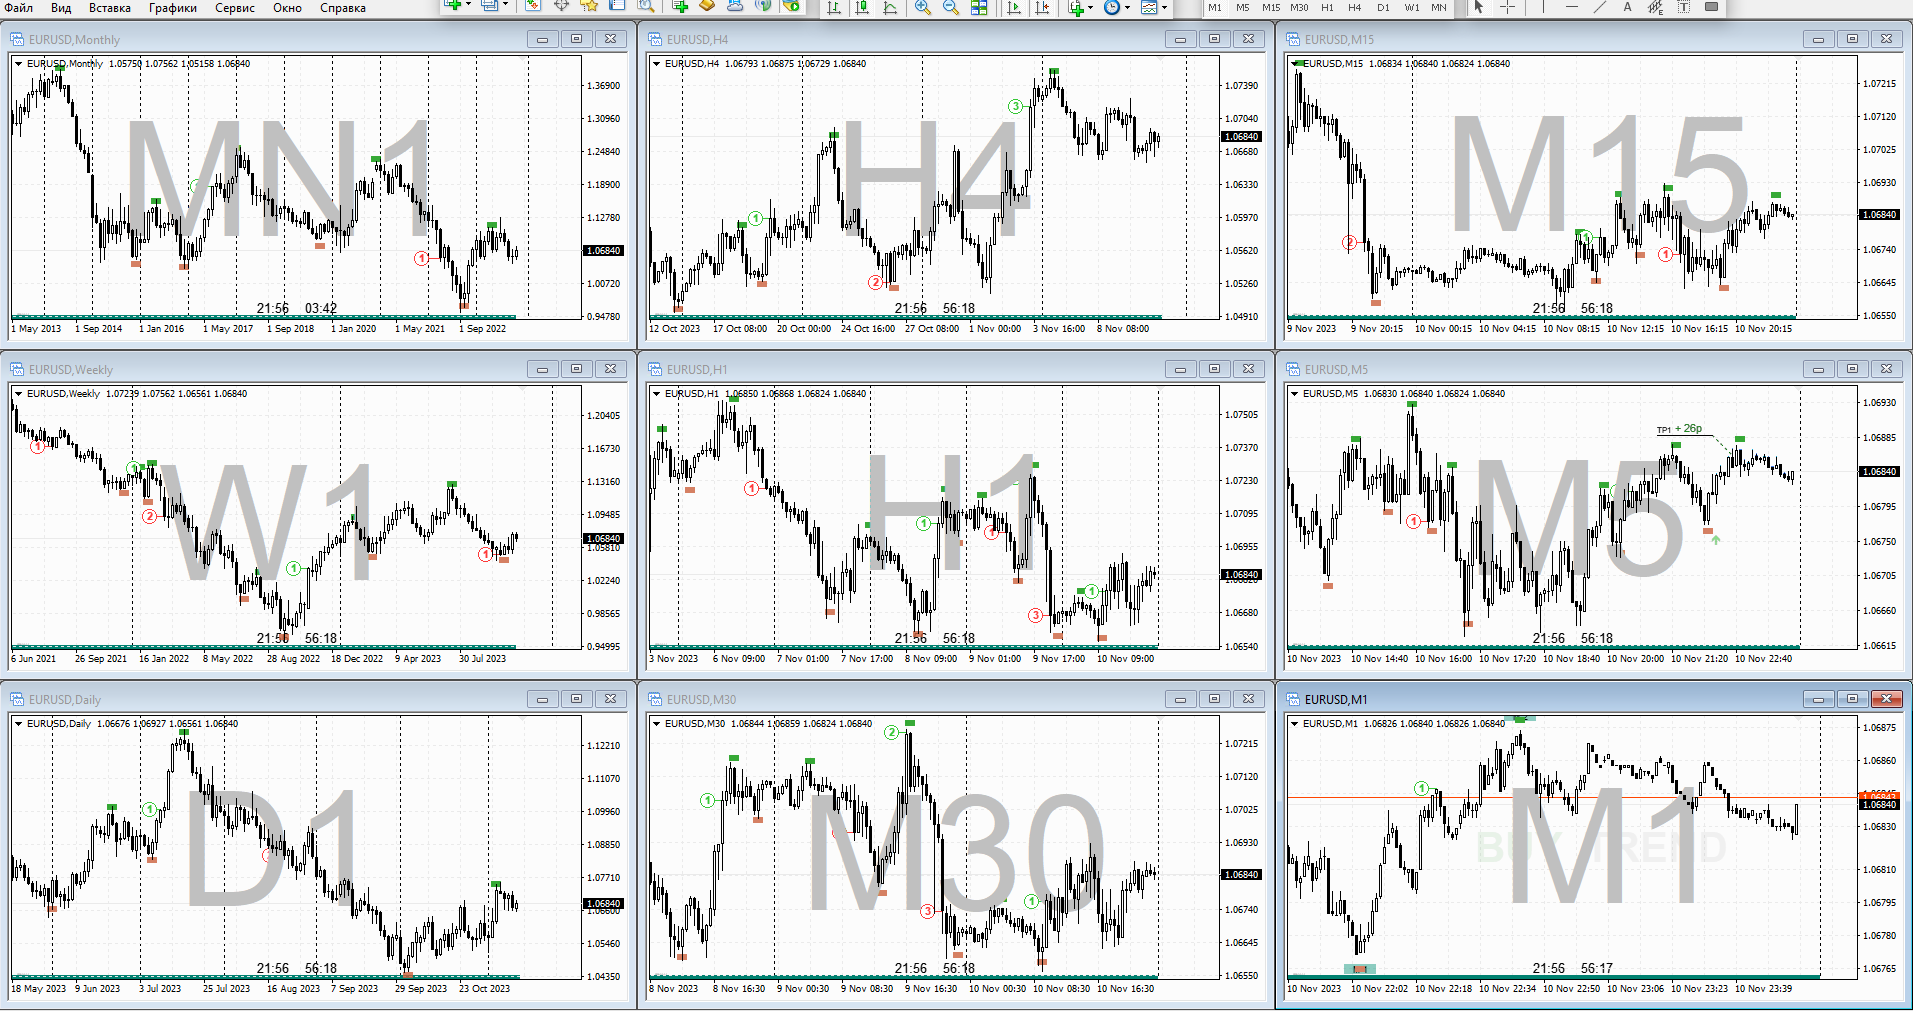
- Works with any timeframe and financial instruments, including forex, cryptocurrencies, metals, stocks, indices.
- Features pop-up notifications, email notifications, push notifications, and sound alerts. Suitable for developing expert advisors.
![]()
Once a signal appears, it remains valid! This is a crucial distinction from repainting indicators that may provide a signal and then alter it, potentially leading to a loss of funds in the deposit. Provides signals regardless of the price movement direction. The TPSpro TRENDPRO indicator generates entry signals irrespective of whether the price is moving up, down, or remains in a sideways trend.
![]()
The ascending trend implies the presence of consistently rising peaks and troughs, while the descending trend, accordingly, assumes the presence of consistently falling troughs and peaks. Thus, a trend reversal is a violation of this logic. That is, if in an ascending trend there was a breakthrough of the last trough by the body of the candle, then it is already a trend reversal. This logic is also applied in our TPSproSYSTEM trading system.
![]()
To change the trend to SELL, the price must break the last low of the BUY trend. When the candle closes below this level, it signals a trend reversal and an expected decline.
![]()
To change the trend to BUY, the price must break the last high of the SELL trend. When the candle closes above this level, it signals a trend reversal and indicates the market’s readiness for growth.
![]()
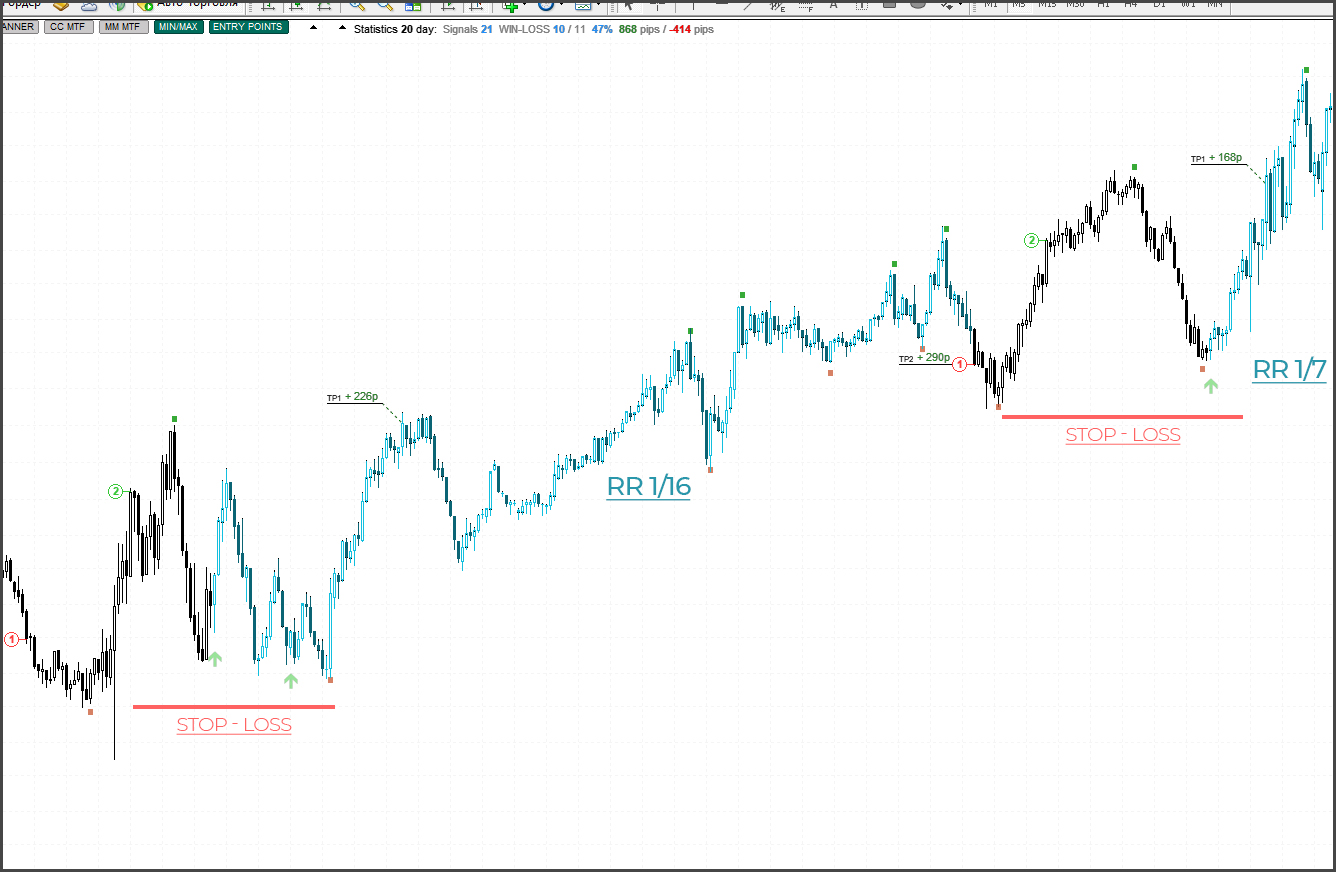
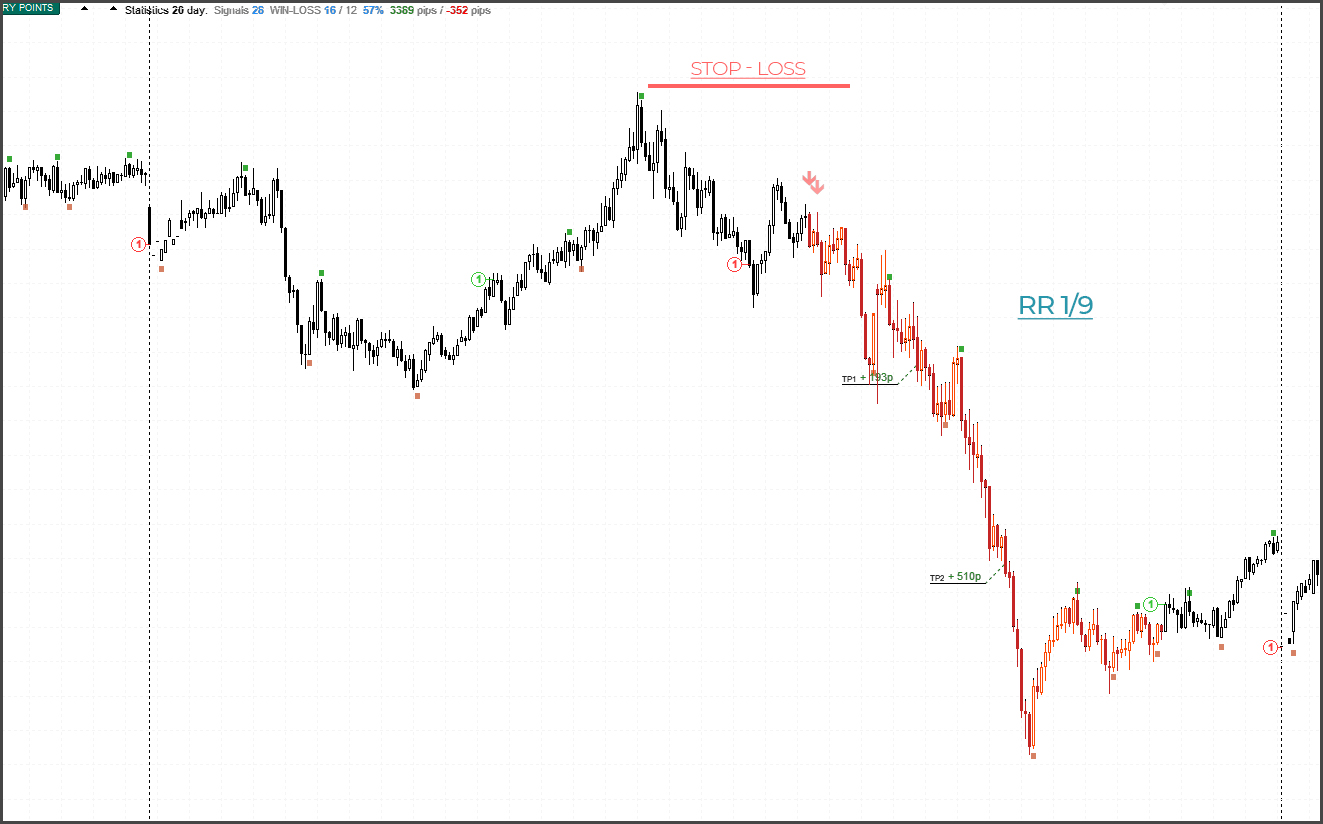
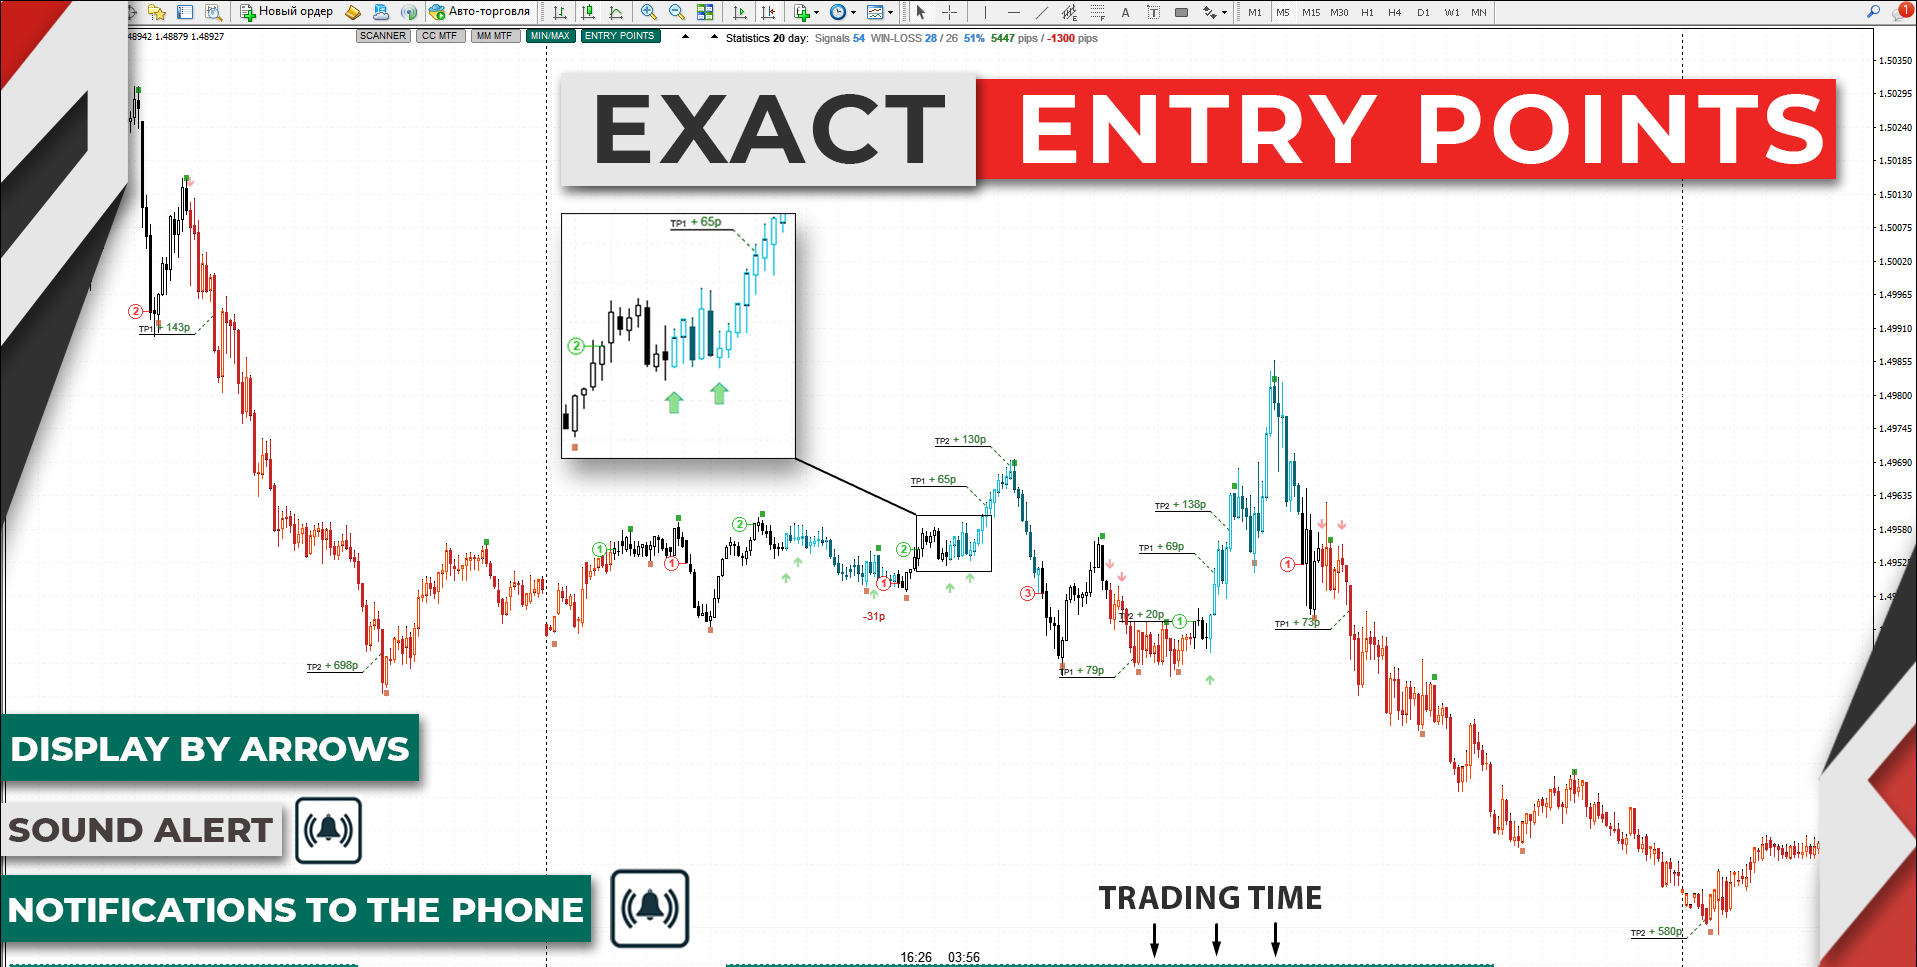
- Using the indicator’s algorithms, precise entry points can be identified, with the risk-to-reward ratio typically exceeding 1:2. This provides traders with confidence in selecting optimal moments for trades, minimizing risks, and maximizing profit potential. An additional visual cue, such as colored candle drawings after receiving a signal, helps traders navigate the market more quickly, improving the accuracy and efficiency of trading decisions. This feature is especially important for those who aim not only to minimize risks but also to take full advantage of profit opportunities.
![]()
![]()
![]()
![]()
![]()
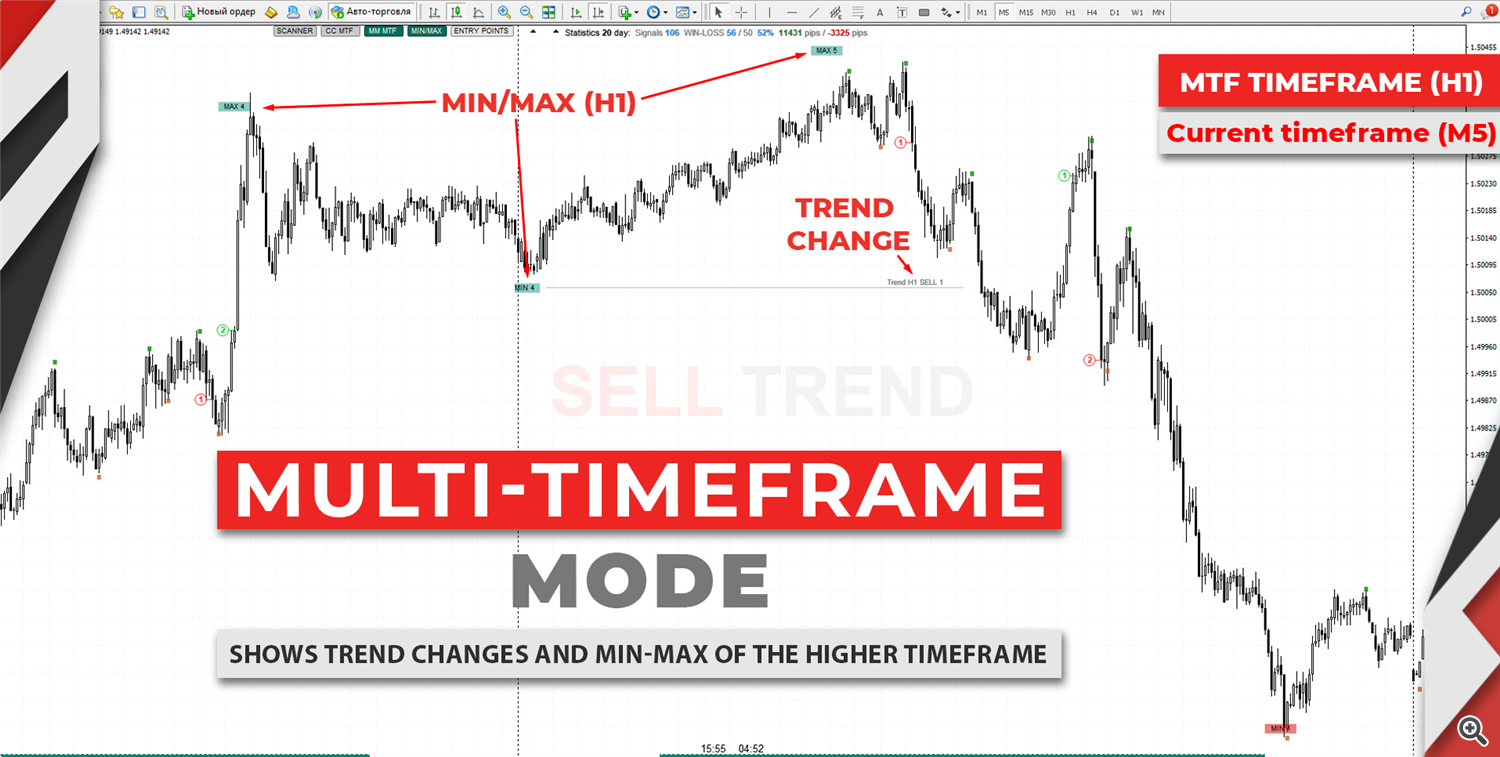
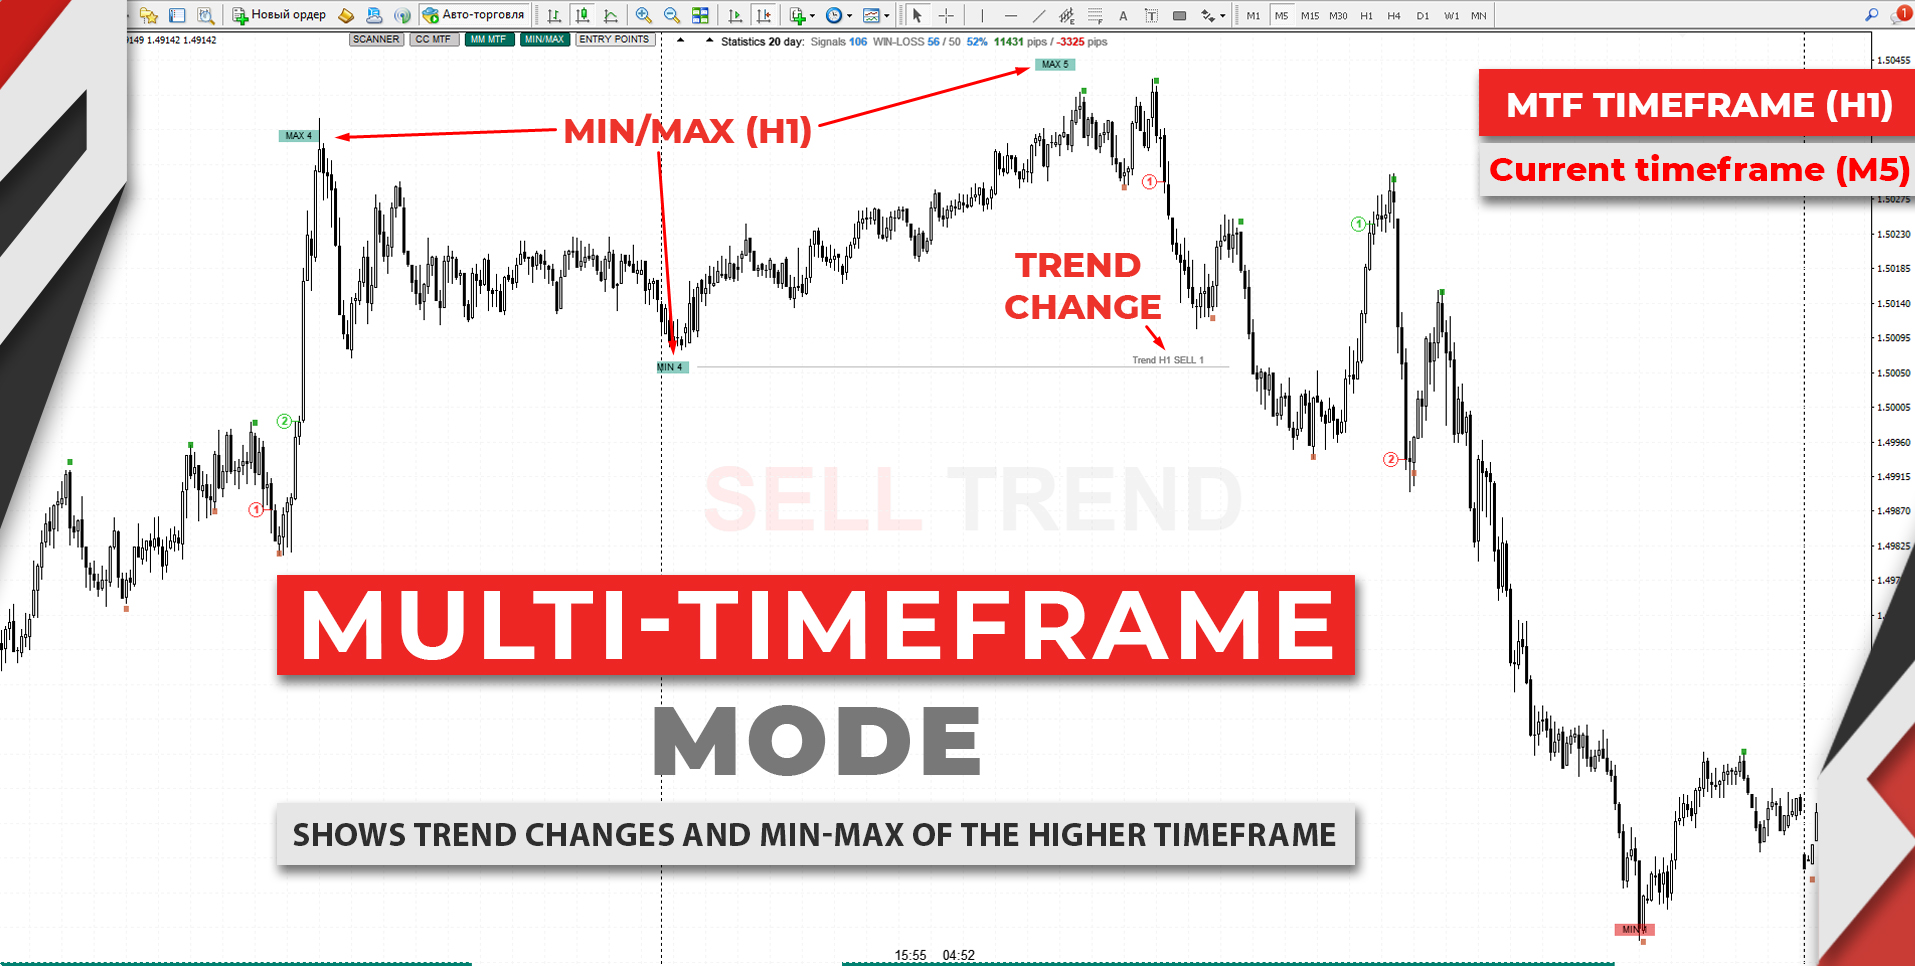
The display of MIN/MAX corrections from higher timeframes (MTF) is a new and powerful feature that significantly enhances market analysis capabilities. Now, the tool not only displays key MIN/MAX correction levels from a higher timeframe but also visualizes trend reversal points, helping you better understand market dynamics.
In addition, each MIN/MAX is now numbered, showing the order of the correction. This provides traders with a clear view of the sequence of events, allowing for easy identification of the maturity of the current trend and evaluating the potential for further movement. This feature is especially convenient, as there’s no need to switch between timeframes — all important data from the higher timeframe is displayed directly on your chart. This speeds up analysis significantly, letting you immediately see key levels and trend changes, simplifying decision-making and making your trading more efficient.
![]()
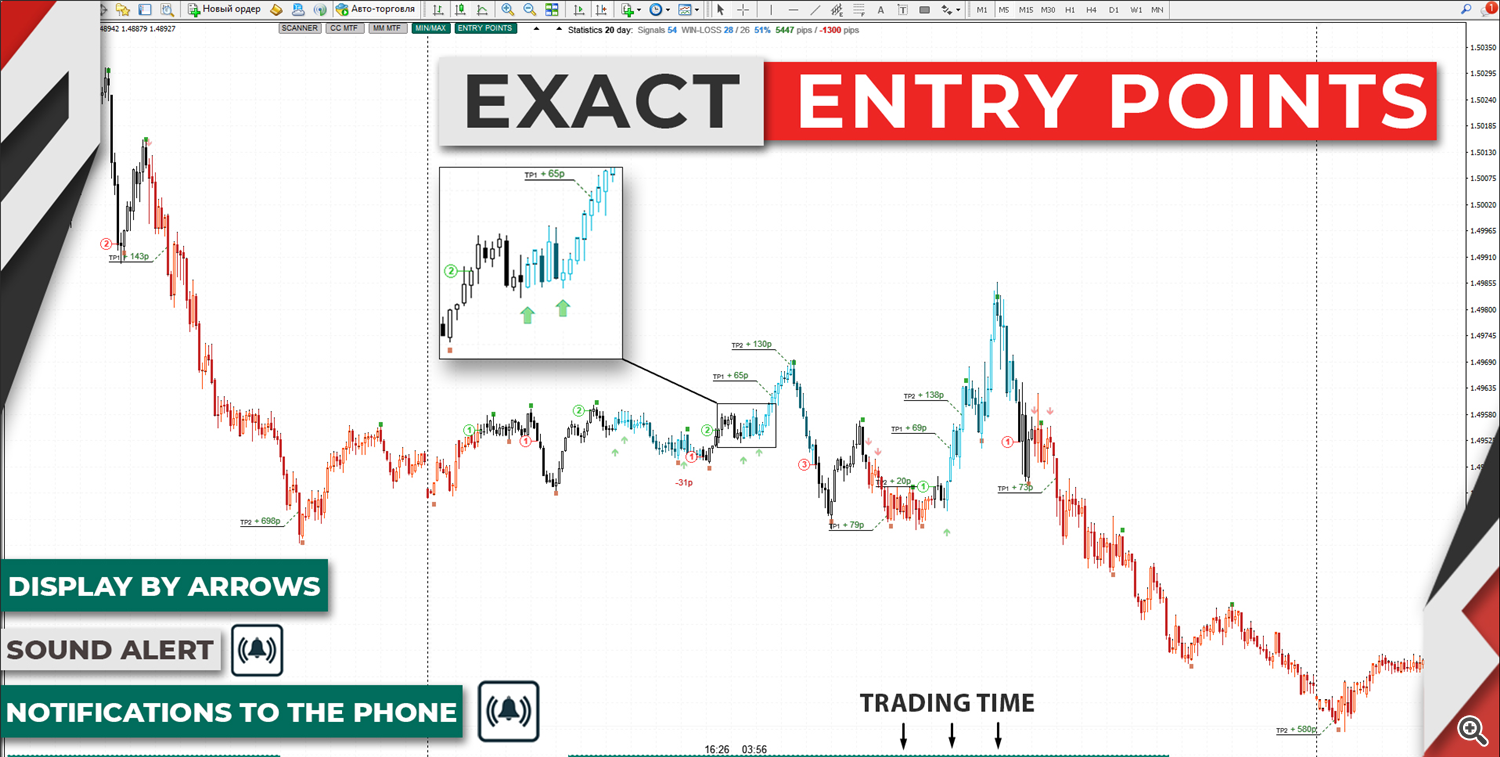
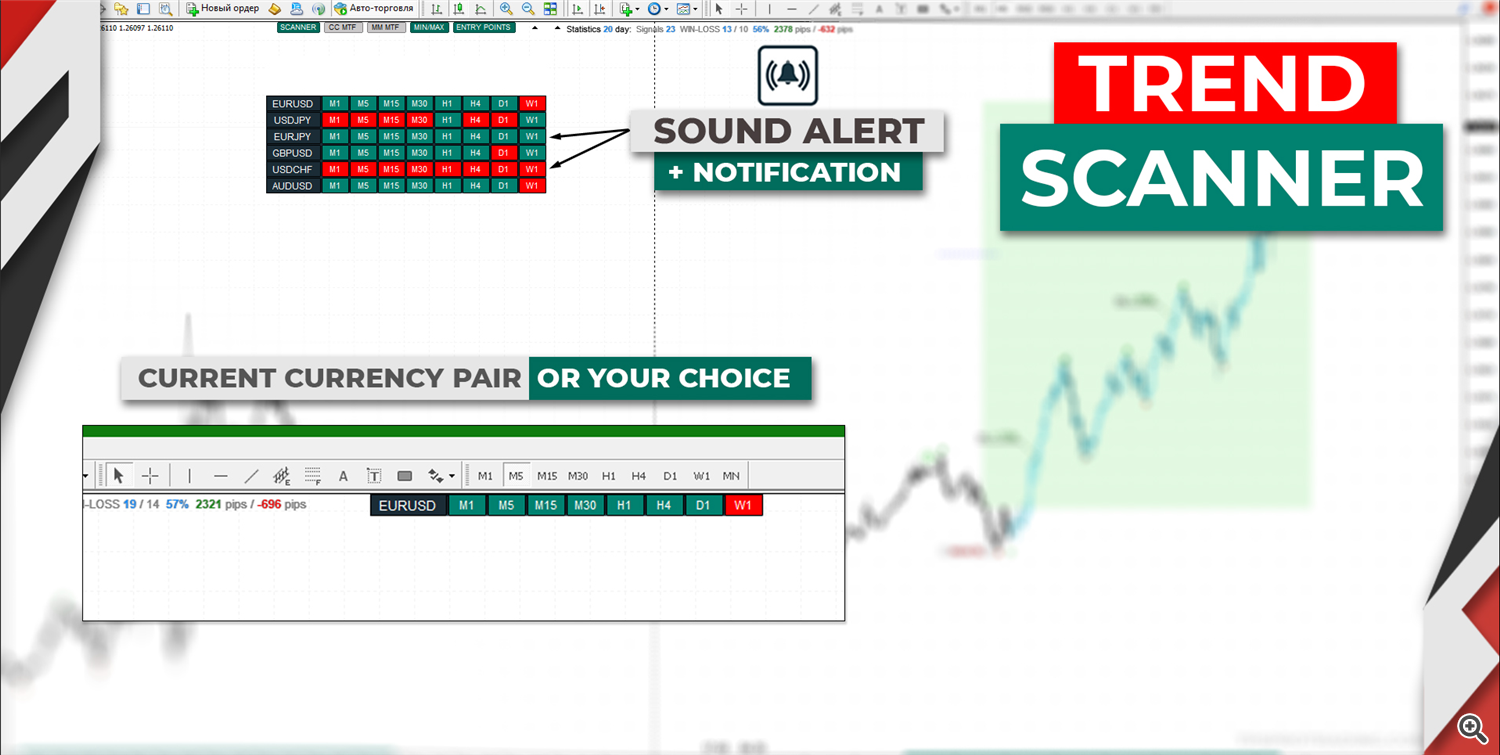
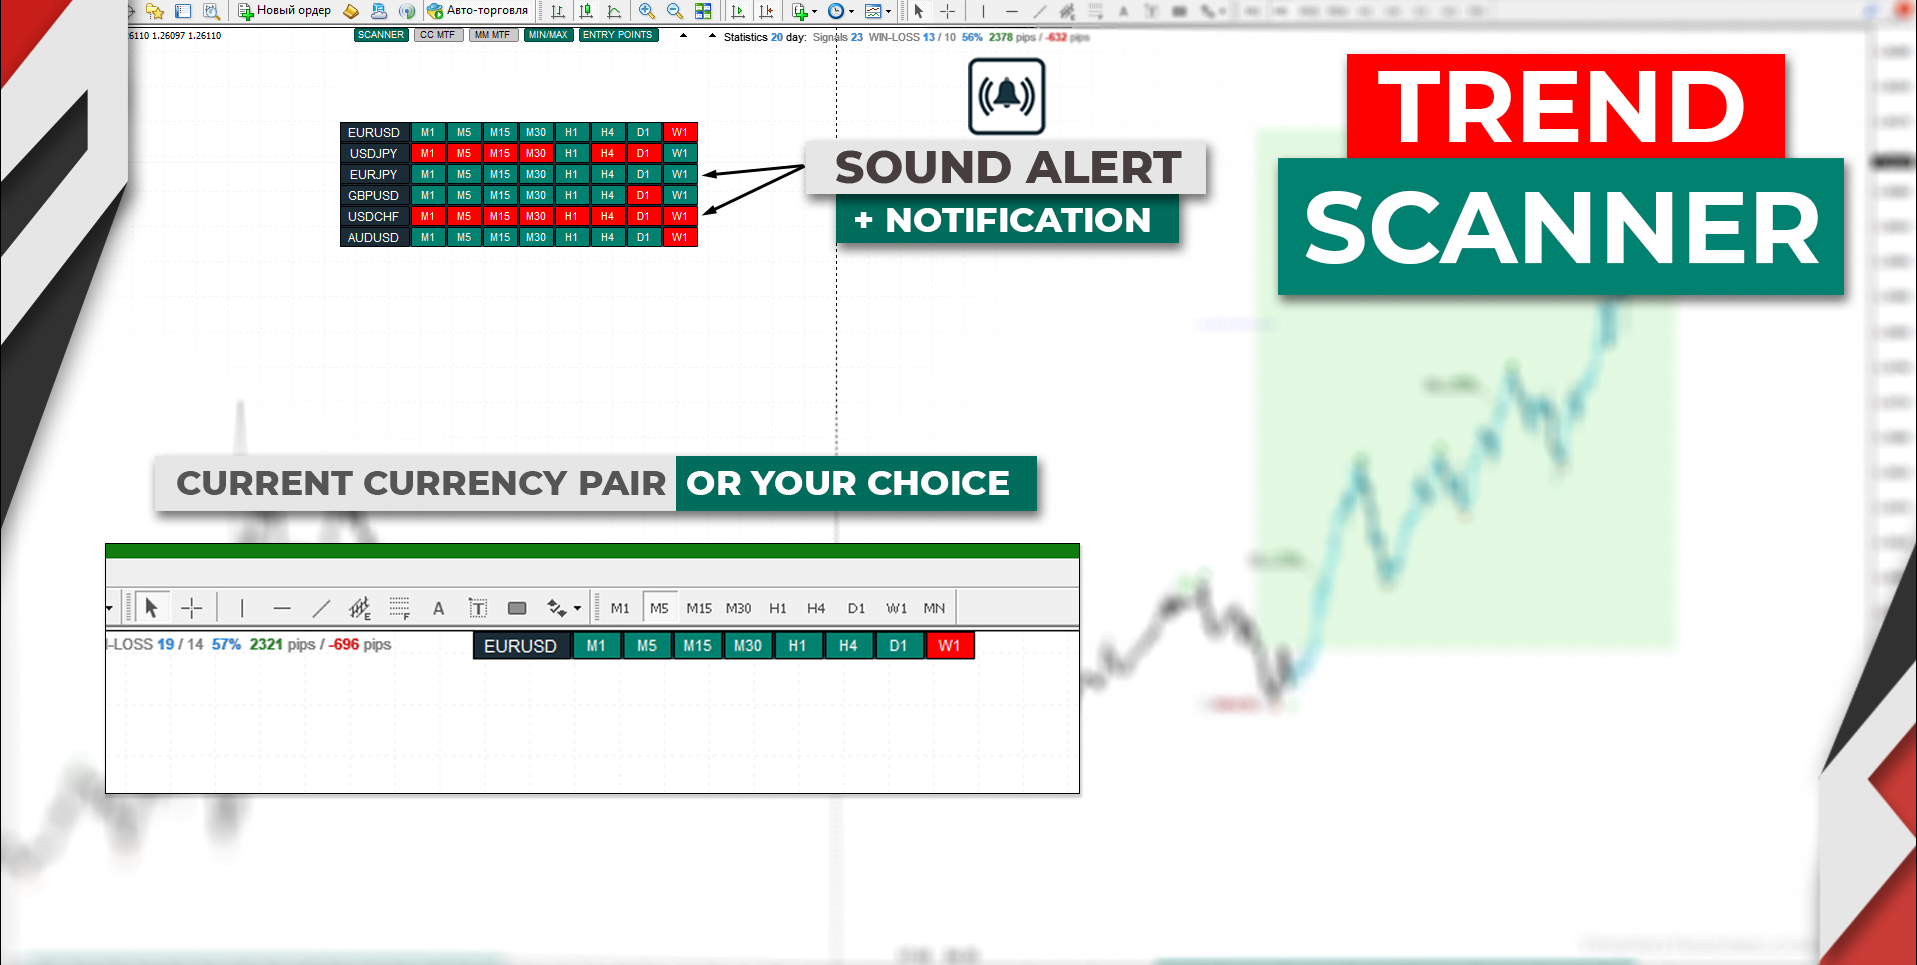
The indicator provides both graphical and sound alerts, ensuring you never miss important entry signals. Moreover, notifications are sent directly to your phone, providing instant alerts about key market moments. This greatly enhances the responsiveness and allows traders to stay informed about important changes, even when they’re away from the computer, ensuring more efficient trading.
Available notifications:
- Entry Points (ENTRY POINTS)
- Trend Reversal
- Reaching Take Profit Levels (TP1, TP2, TP3)
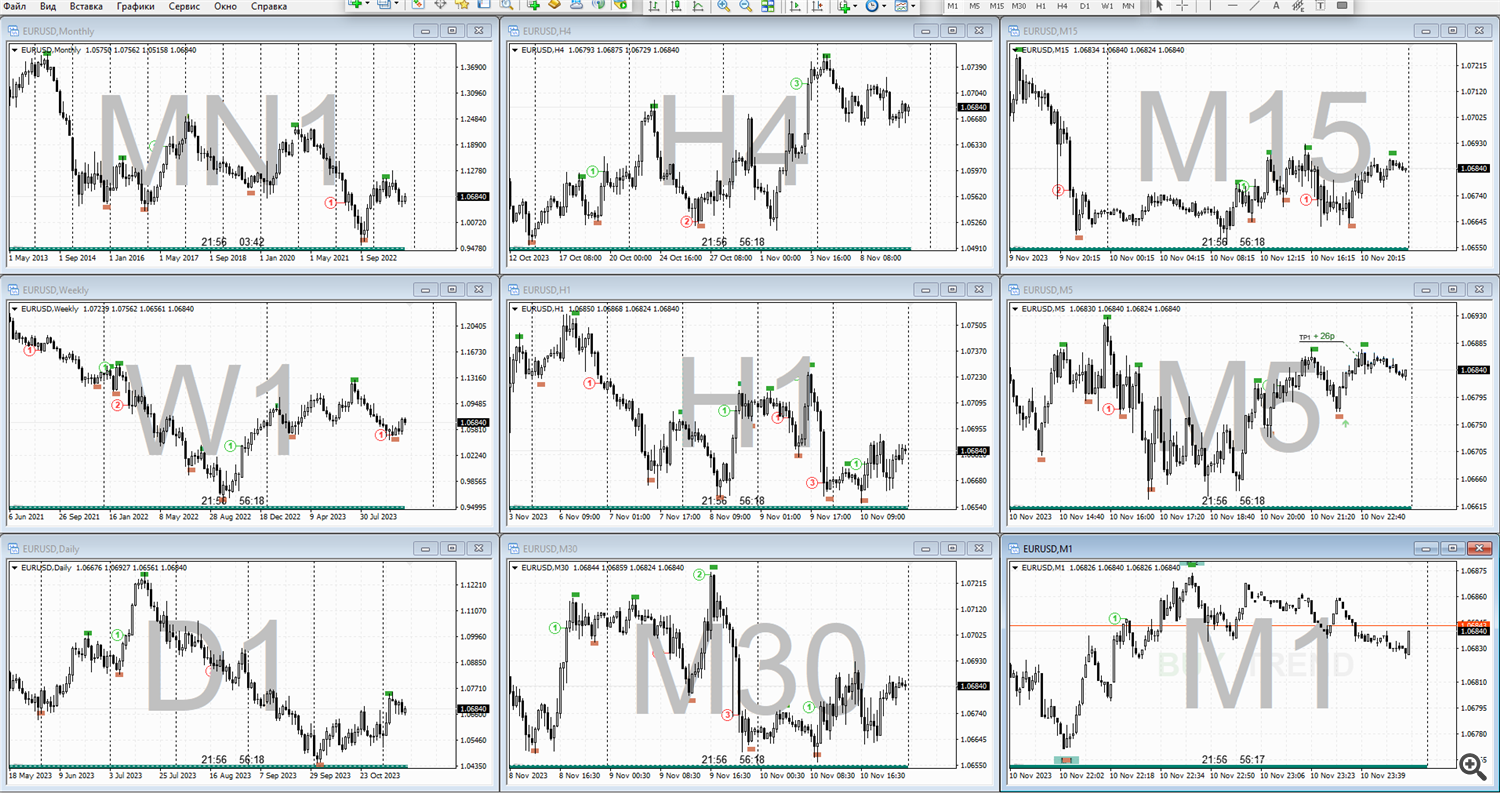
- Scanner (when all timeframes converge in one trend direction)
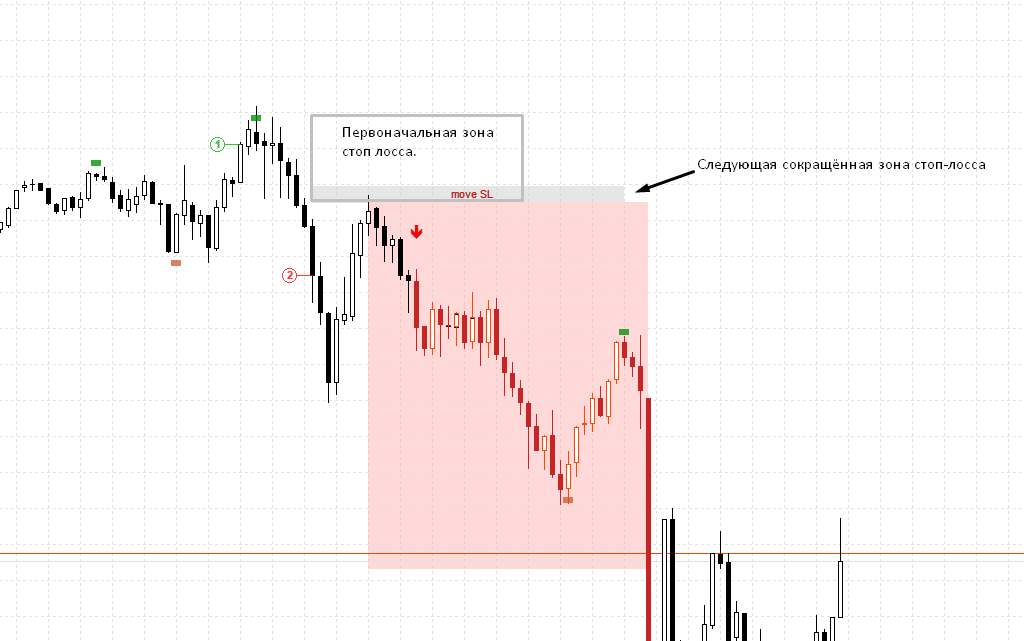
Additional intelligent logic for working with the stop-loss level over time allows for automatic adjustment of its size, helping to reduce initial risks when entering a trade. This feature is particularly important as it helps traders protect capital while providing more room for maneuver in volatile market conditions. Reducing the stop-loss without compromising the strategy’s effectiveness significantly increases the likelihood of successful trades and helps traders operate more confidently in the market.
![]()
![]()
Source link