Grid Vision TP and NP – Free MT4 Basket TP/SL & Grid Visualizer
Grid Vision TP and NP – Free MT4 Basket TP/SL & Grid Visualizer
Hi everyone,
I’ve just released a free MT4 indicator called Grid Vision TP and NP in the Market, and I’d like to briefly introduce what it does and how it can help if you use grid / martingale EAs or manual averaging.
Why I built this tool
When running grid or averaging systems, I often asked myself:
-
“Where will this basket close if I target +X USD?”
-
“How far is my pain limit in money, not just in points?”
-
“Roughly how many grid steps are left until that limit?”
Many EAs don’t draw any TP/SL or grid levels on the chart, so it’s hard to get a quick visual idea of the risk and targets.
Grid Vision TP and NP was created exactly to solve this problem.
What the indicator does
Once attached to a chart, the indicator:
-
Aggregates open positions by Symbol and MagicNumber
-
Calculates the basket average price and draws it as a blue line
-
Draws a TP line based on a target money amount (account currency, typically USD)
-
Optionally draws an SL line based on a maximum loss amount
-
Draws grid lines at a custom distance in points (for averaging / martingale style grids)
-
Shows a compact info panel with:
It works with any EA or manual trading, as long as there are open positions on the symbol.
Typical use cases
-
You run grid / averaging EAs that do not draw any TP/SL lines
-
You want to see “Where will this basket close if I target +X USD?”
-
You want a quick visual idea of “How many grid steps until my pain limit?”
-
You trade manually with multiple entries and prefer to see price and money levels together
The indicator is completely non-trading – it does not open or close any orders. It’s purely a visualization and planning tool.
Main input parameters
Symbol
MagicNumber
TargetProfit_USD
ShowSLLine / MaxLoss_USD (optional)
-
If ShowSLLine = true , the indicator calculates the price where the basket would reach –MaxLoss_USD
-
Useful as a visual “hard pain limit” line
GridDistancePoints / GridStepsToShow
There are also simple options to toggle the average line, TP/SL labels, grid lines and the info panel on or off.
How to use
-
Attach the indicator to the chart where your EA is running (or where you have manual positions).
-
Leave Symbol empty to auto-detect the chart symbol.
-
Set MagicNumber to your EA’s magic, or 0 to include all positions.
-
Set your TargetProfit_USD and (optionally) MaxLoss_USD.
-
Adjust GridDistancePoints and GridStepsToShow if you want to see grid steps.
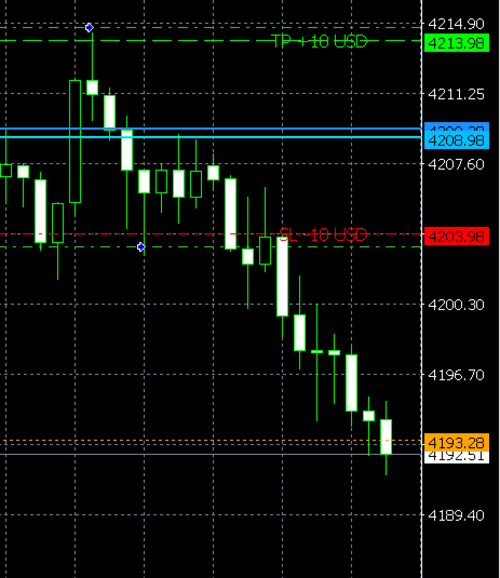
Instantly, you’ll get:
-
A blue line for the basket average price
-
A green line for the money-based TP
-
(Optional) a red line for the money-based SL
-
Orange dotted lines for grid steps
-
A small panel with the current basket summary
Download
Grid Vision TP and NP is available for free in the MQL5 Market:
🔗 https://www.mql5.com/en/market/product/158042
If you try it and have any feedback or ideas for improvements, feel free to leave a comment or review.
I hope this small tool makes managing your baskets a bit more comfortable and transparent 👍