Trading the Gold Market This Week: Navigating Uncertainty and Trump Tariffs (April 7-11, 2025)
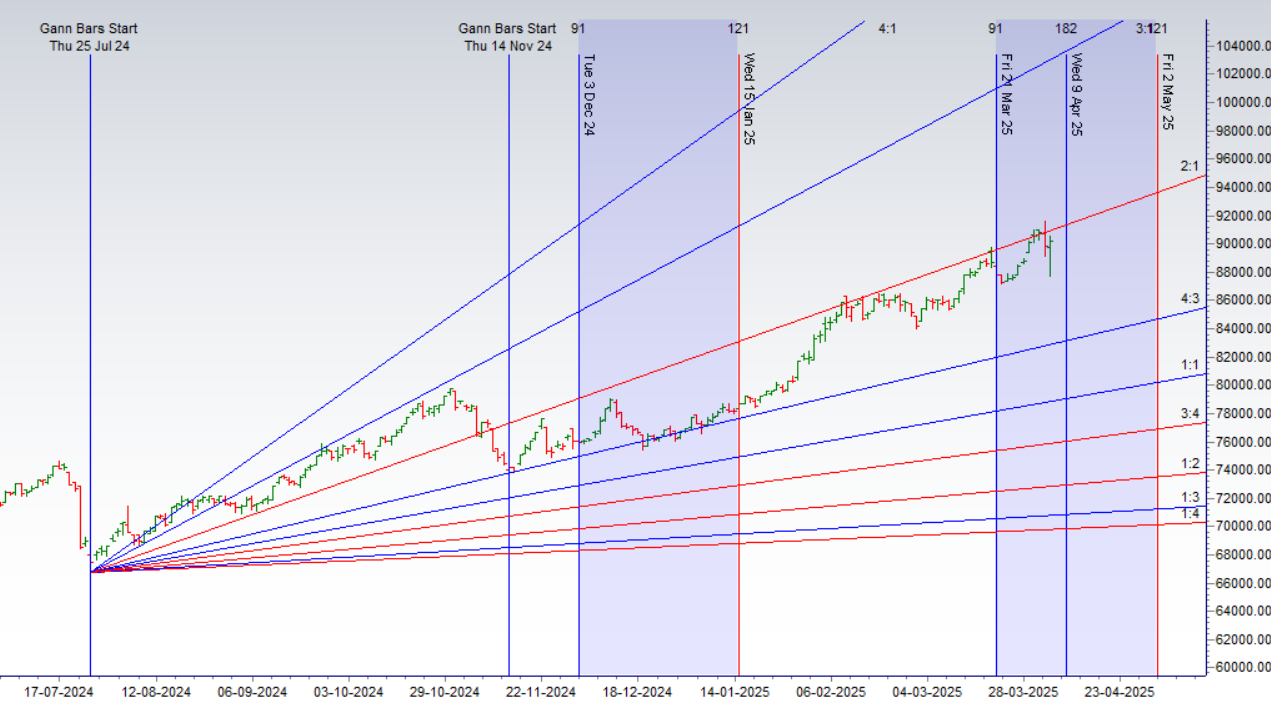

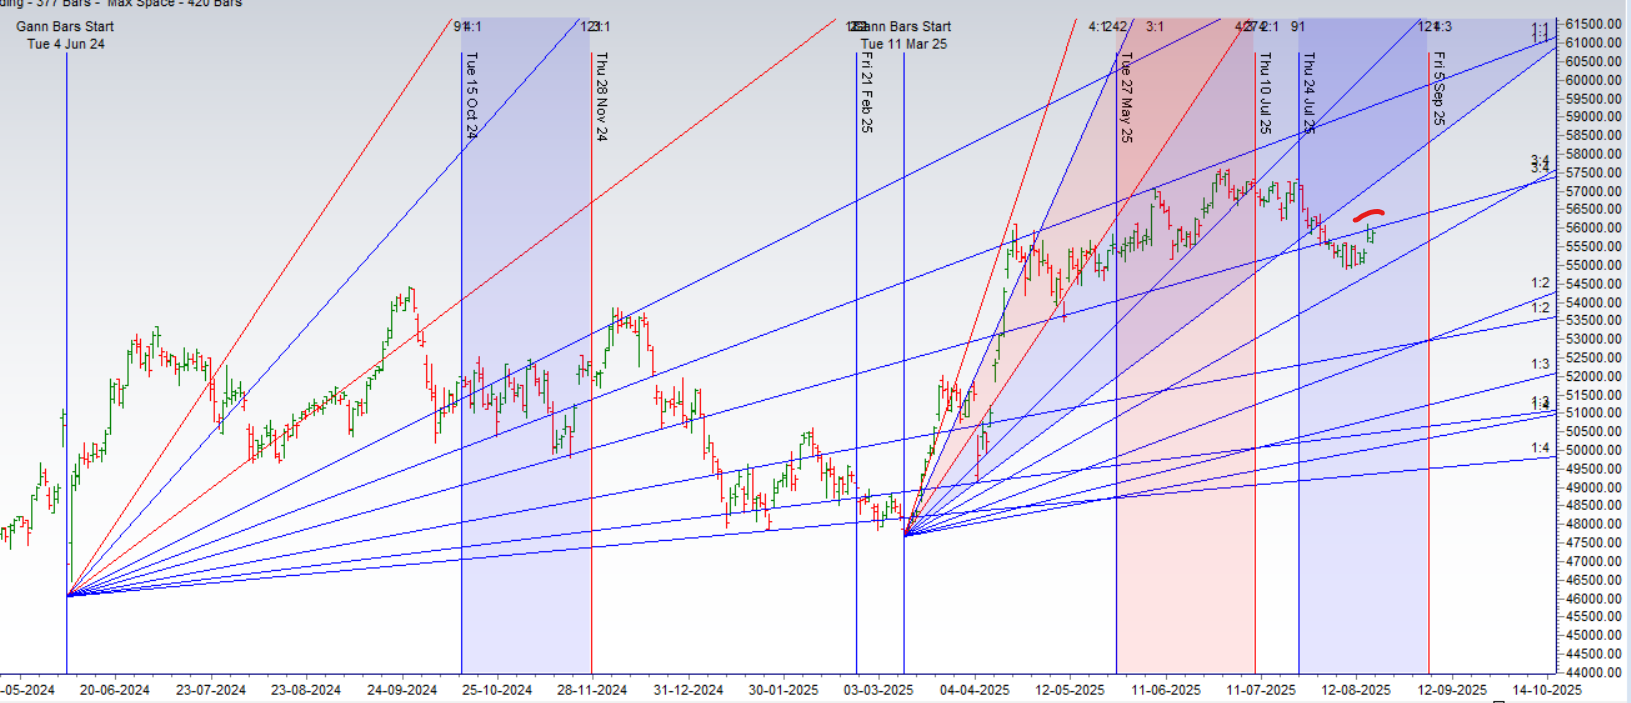
MCX GOLD Gann Angle Chart
Gold has corrected from its 2×1 Gann Angle Rersistance now can see fall towards 89289-89000.
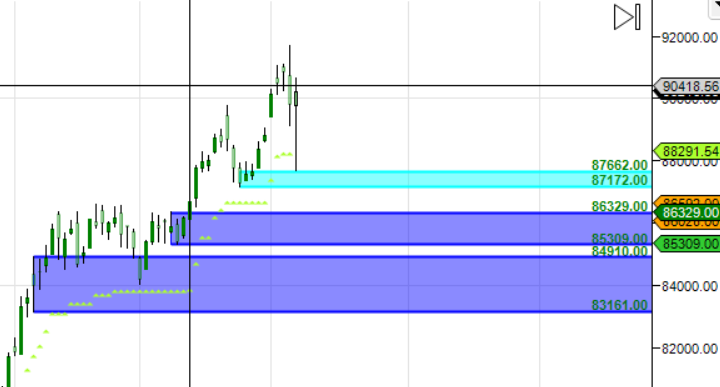
MCX GOLD Supply Demand Zone
MCX GOLD Supply Demand Chart : Demand in range of 88000-87900, Supply in range of 90450-90500.
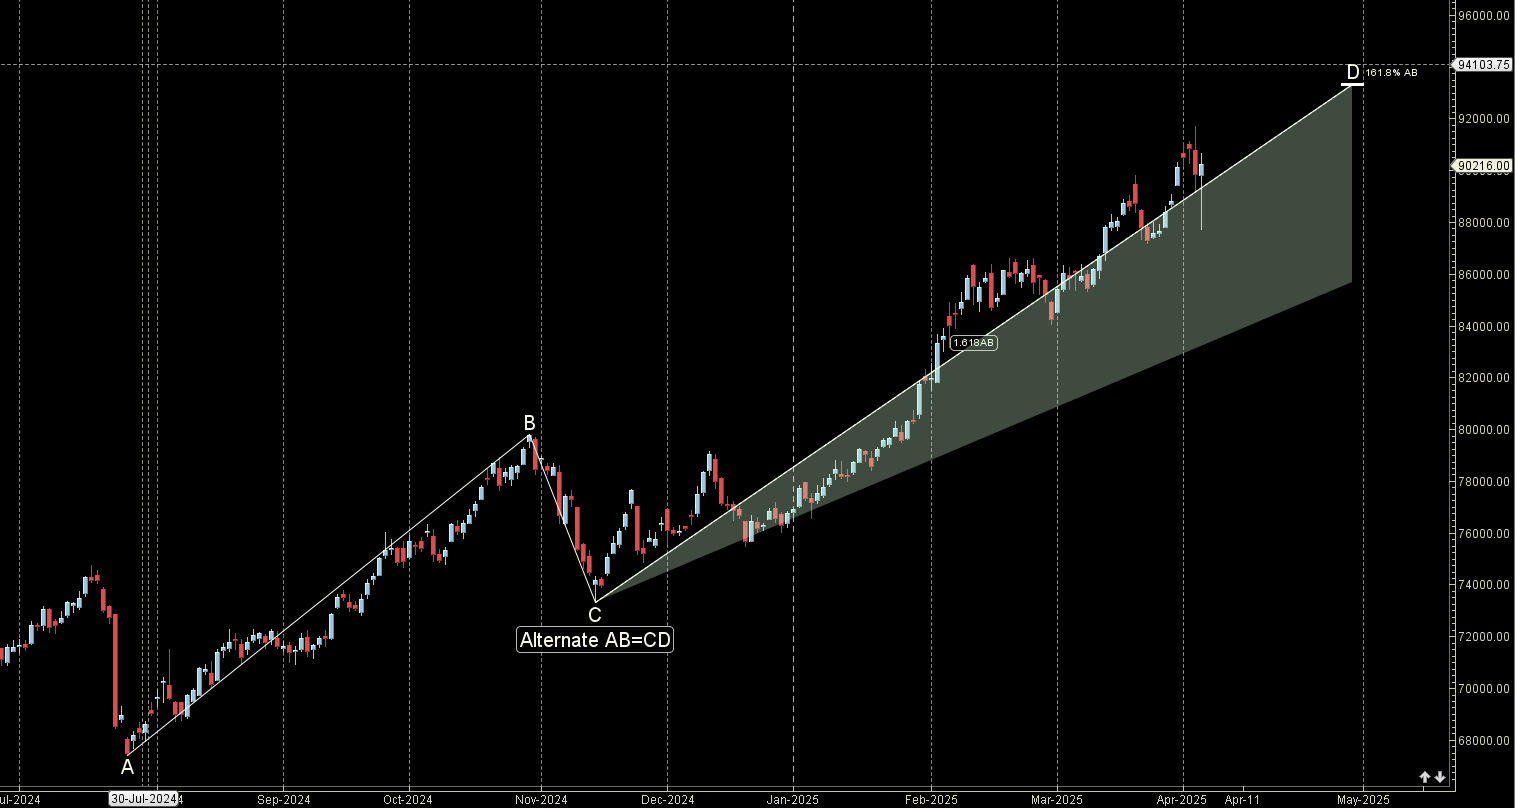
MCX GOLD Harmonic Analysis
Gold completed the ABCD pattern and can see fall towards 88000/87500.
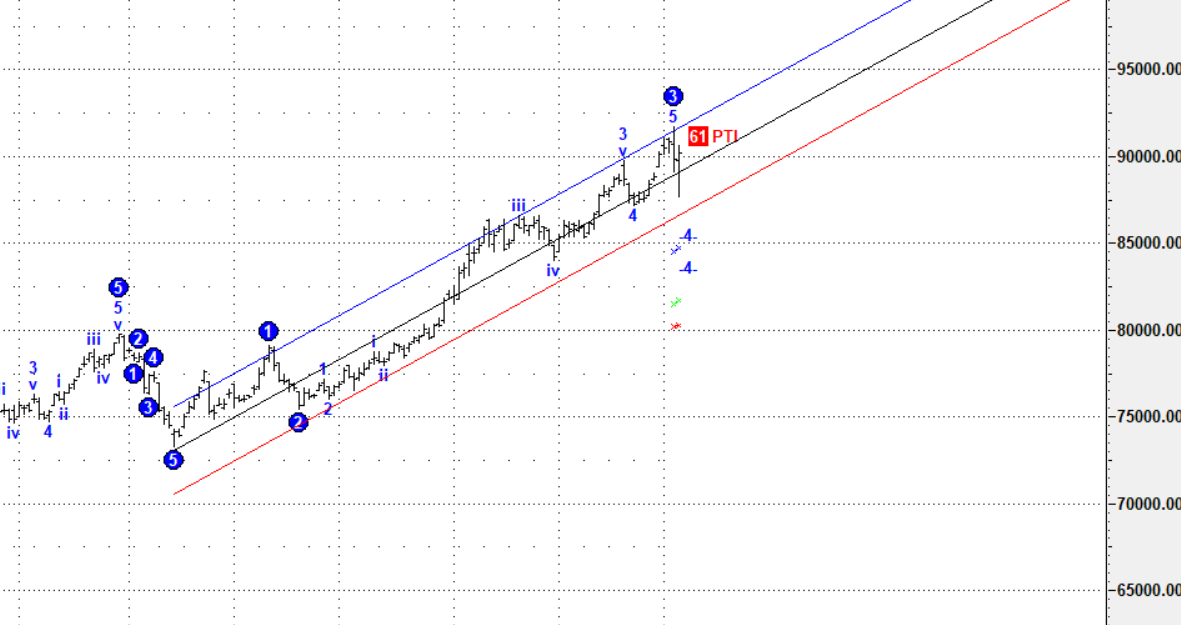
MCX GOLD EW Analysis
3 wave completed now can see fall towards 87500
GOLD Astro/Gann Trend Change Date
07 April Important Gann/Astro Date for Trend Change
Weekly Trend Change Level:89888
Weekly Resistance:90488,91091,91696
Weekly Support: 89289,88098,87505,86915
Levels Mentioned are for Current Month Future
Wishing you good health and trading success as always.As always, prioritize your health and trade with caution.
As always, it’s essential to closely monitor market movements and make informed decisions based on a well-thought-out trading plan and risk management strategy. Market conditions can change rapidly, and it’s crucial to be adaptable and cautious in your approach.
Trade smartly and safely.
Related
Source link