Vantagepoint A.I. Hot Stocks Outlook for June 14, 2024
Register for a Free Live Training
The Hot Stocks Outlook uses VantagePoint’s market forecasts that are up to 87.4% accurate, demonstrating how traders can improve their timing and direction. In this week’s video, VantagePoint Software reviews forecasts for SPDR SPY($SPY), Hims and Hers Health ($HIMS), NVIDIA ($NVDA), Apple ($AAPL), Micron Technology($MU), Chipotle Mexican Grille ($CMG), Caterpillar ($CAT)
SPDR SPY ETF ($SPY)
Hello again, traders, and welcome back to the Hot Stocks Outlook for June 14th, 2024. Hope you all are having an excellent week out there in the financial markets. As always, we’ve got plenty of opportunities to cover in this week’s outlook, so if you haven’t already, make sure you go ahead and click on the link in the description below. You can sign yourself up for a live demo to learn all the specifics about how these predictive technologies and tools can help you make much better trading decisions in the marketplace.
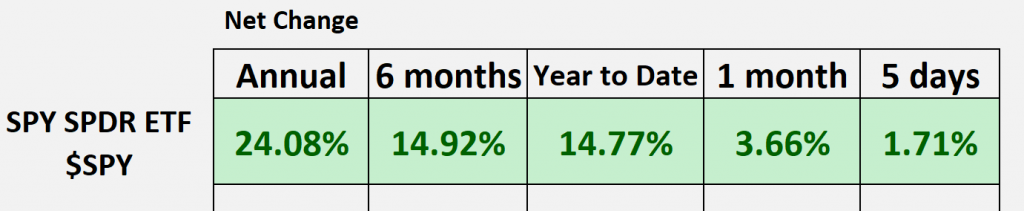
Now, as we typically do, we like to get a sense of where that broader stock market is via the SPY ETF. Right now, we can see year-to-date we’re up just under 15%, so that certainly means that there’s been nice opportunities in the first half of this year throughout the equity market. Recently, we’ve seen a lot of that momentum come into the market, so just the past five trading days are up 1.7%. This certainly means that there’s great opportunities spread throughout the marketplace.
One of the stocks we’ve actually highlighted for the past three weeks is Hims and Hers Health ($HIMS). We can identify all this strength coming through the Vantage Point forecast. Let’s explain how all of this works, whether you’re looking for a big shift and a swing trade in the market or looking to do some shorter-term day trades.
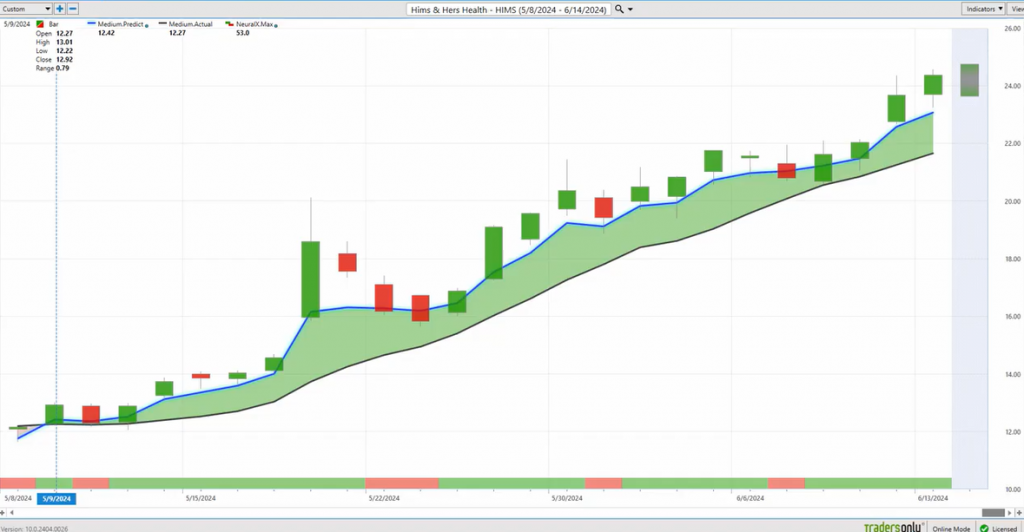
What we have here with Hims and Hers Health is daily price action. Each one of the candles that you see represents a full and complete trading day. It’s right up against that price data. The first thing you’ll notice is a black line and a blue line value. The black line that you’re seeing is a simple moving average, a very common technical analysis tool. In this case, it’s a 10-period simple moving average, so it’s going to look at the last 10 close prices, add those all together, and divide by 10. One of the weaknesses here is that all that data just comes from the past.
Additionally, something that really most tools can’t do aside from Vantage Point is it’s only looking at the one market in question. It’s just looking at the last close prices and very simply adding those together, dividing, and summarizing where average prices have already been. But traders want to be ahead of that next move in the marketplace. What we’re able to do is compare that black lagging moving average to this proprietary predicted moving average. For this number, essentially a price prediction gets calculated and plotted every evening for the trader. This is where that technology of artificial neural networks comes into play. They’re performing what we would call intermarket analysis. The reality is that other markets drive and influence and offer some short-term price clues as to the future prices of individual assets. That can be things like the big ETF groups, individual stocks, or those broader indices like the NASDAQ and the Q’s. It’s able to look at all of these really competing market relationships, whether they be positive correlations, inverse correlations, and really weigh those out into a solid, consistent output.
This goes all the way down the line to things like the value of the dollar index, global interest rates, or potentially commodity prices. A few months ago, we looked at a lot of gold and oil stocks that were doing quite well. Those are certainly affected by those commodity markets themselves. It takes this global approach, looking at all these intersecting relationships and forecasts future prices with a very high level of accuracy. What we’re seeing when we look at this comparison between this blue and the black line value is really these predictive technologies skewing in this case to the bullish side. Traders can take advantage of that, recognizing that through features like Vantage Point’s IntelliScan features. Whatever predictive indicators you want to use to identify opportunities that match your trading style, this is where we can make sure we see these things right as they occur.
We’ve certainly been able to tell that Hims and Hers Health is in a nice strong uptrend. Over the past few weeks, you want to be able to manage that effectively. Add to your position at the right time, stay in the market as long as the overall trend continues higher. We see as long as that blue line remains above the black line, this stock has continued to march higher. In this case, you’re now up a little over 95%, pushing up to about 100% gain in just the past 25 trading days. Here, just a 500-share position is up about $6,000 when you get a stock moving from $12 up to $24 in pretty short order.
Let’s go ahead and take a look at some of these other Vantage Point predictive tools. Identifying those trend shifts is important, but if you look at the bottom of the chart, you’ll notice this bar that goes from green to red back to green. This is another Vantage Point indicator, but it’s tuned to solve a different problem for the trader: short-term strength or weakness over a 48-hour period. Just a couple of days, really identifying that momentum coming into the marketplace in combination with that overall trend. Each week, we look at the Vantage Point predicted high and predicted low.
So now we’re down to intraday price levels that traders can use to add to their positions, take profit, and also use as stop losses, understanding where the market is likely to trade. Over the past few weeks, as we’ve brought this market in, we say, ‘Okay, where are those levels coming through where Vantage Point traders can scoop up some additional shares and look to exploit that momentum?’ You see here, just day after day, the market is shooting up. Within a couple of days of a position, you’re getting a very, very strong move in the desired direction. This has resulted in numerous trades where traders can take some profit, get out of the market, reset the position, and manage the opportunity. Whether you’re short-term day trading, looking to get back in, or just understanding that this is a very strong market and the trend is up, you certainly may want to hold on to some of that position as we march higher day after day. As long as that blue line remains above the black line, the overall trend is up here.
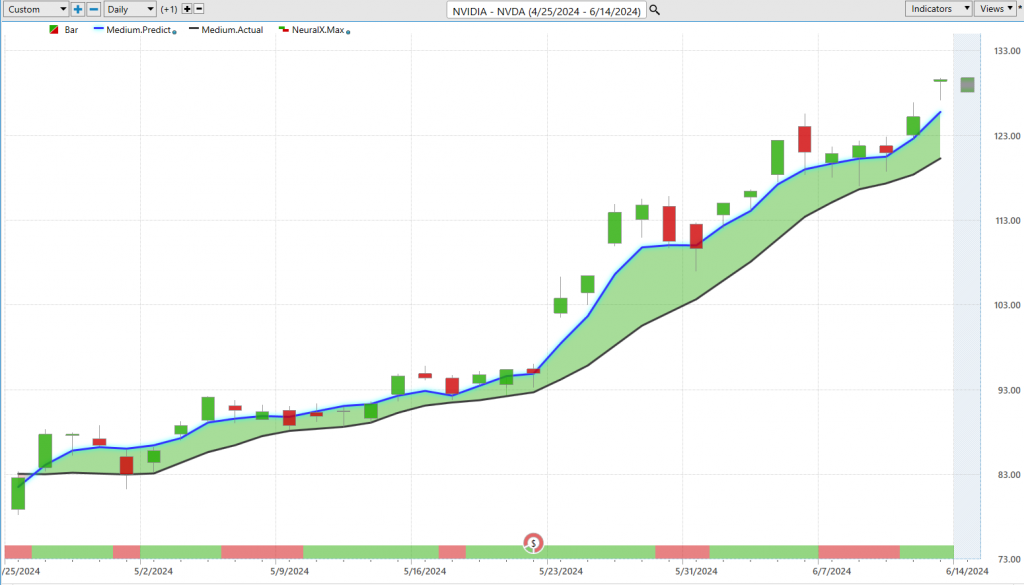
We’ve seen a very similar picture in NVIDIA ($NVDA). A lot of attention is around these tech stocks, with NVIDIA really leading the way. This is helpful to say, ‘Okay, even with all this momentum coming in over the past few weeks, if you want to trade in these shares, recognizing that the markets are bullish, the S&P is moving higher, and individual stocks are doing well, this is where these short-term tools are extremely effective.’ You see here that we’ve had the stock split, but really since the beginning of this move, where do you want to be buying NVIDIA shares? Down towards these predicted lows. Within 24 to 48 hours, you’re moving higher and reaching those subsequent predicted high levels. Now we’re seeing things really start to gap up and move ahead, but again, a really nice opportunity where Vantage Point traders have their attention tuned to where these predicted forecasts are the most bullish. In NVIDIA, another 50% move over the past 38 trading days.
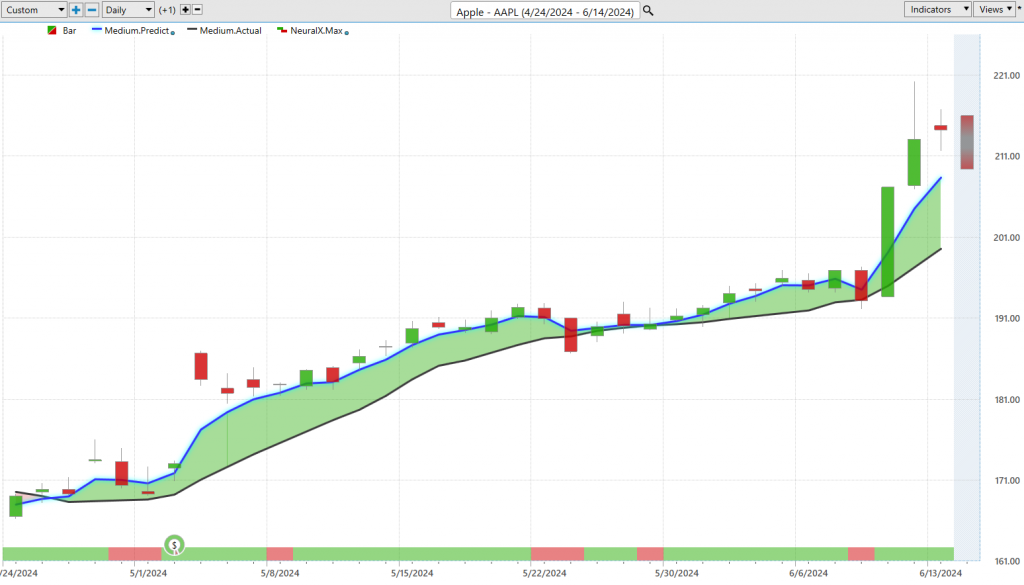
Shares of Apple ($AAPL) are another popular stock. We got this crossover all the way back at the end of April, really at the beginning of May. A very long-term opportunity as far as the crossover coming through, but again, more recently, the blue line over the black line, neural index very bullish here, and pretty much every day the trader would be coming in and saying, ‘Okay, let’s look at where we want to add to our position down at these predicted lows.’ You see in this case, the market moving down towards this previous predicted low, then all of that really strong momentum coming in as Apple does extremely well this past week along with the broader markets. We’re just seeing a lot of stocks do extremely well. This move from Apple now is about a 26.7% rally over a little bit longer period of time at 34 trading days.
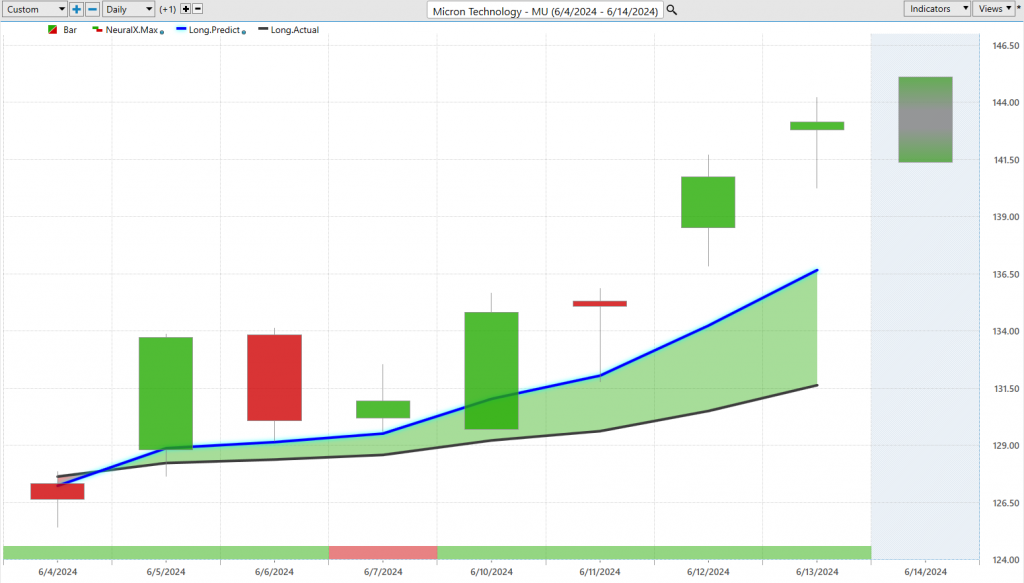
Micron Technology ($MU) is a little bit more recent of an opportunity. Micron is running sideways, but we see coming into this week, blue line over black line, neural index bullish. Again, we can take a look at really throughout the marketplace how these predicted high and low levels are performing. When you come into the week and say, ‘Okay, I want to get a position here on Micron,’ where do we want to be buying in? Coming into this trading date, let’s look to accumulate a position down here at these predicted lows. The neural index gets bearish here, letting you know to expect some potential weakness over the next couple of trading days. You run sideways, another opportunity down at that predicted low before we get all of this momentum throughout the tech space, propelling things like Micron, Apple, and certainly NVIDIA. Shares are up 8.3% just from this predicted low, which would have been Tuesday. Coming into the week, identifying all this strength, neural index bullish, we see all that momentum come through the tech space.
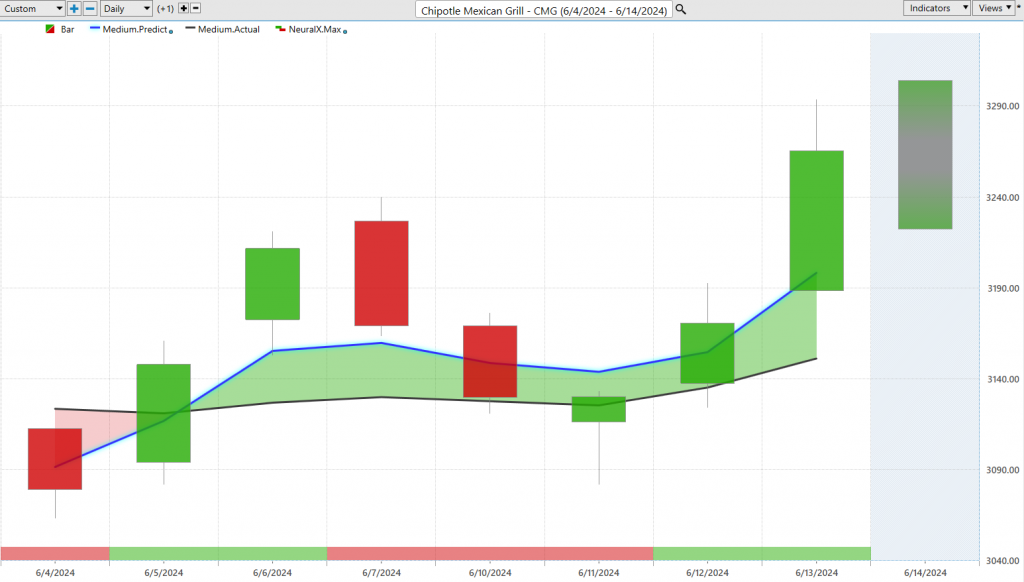
Chipotle Mexican Grille ($CMG),
Here, shares of Chipotle Mexican Grill ($CMG) show a little bit more of a sideways beginning of a move. We see we get this crossover between the blue and the black line, and the neural index goes bearish here. This is a good example of how this all works where that neural index goes bearish, warning you to look for subsequent lower lows. Use the short-term tools if you want to keep accumulating a position, but look to do this at lower prices. You see the market wants to move lower again, forecasting that we’re going to go a little bit lower this next trading day. You get a gap down, but the overall trend is up here. The blue line is still above that black line, and we see shares begin to advance a little bit more. A 3% move just over the past week, but again, a good example. As long as that blue line remains above the black line, the neural index is going to go from bullish to bearish, but it’s going to let you know and warn you of that short-term shifting, that short-term momentum in the marketplace so you can adjust your positions.
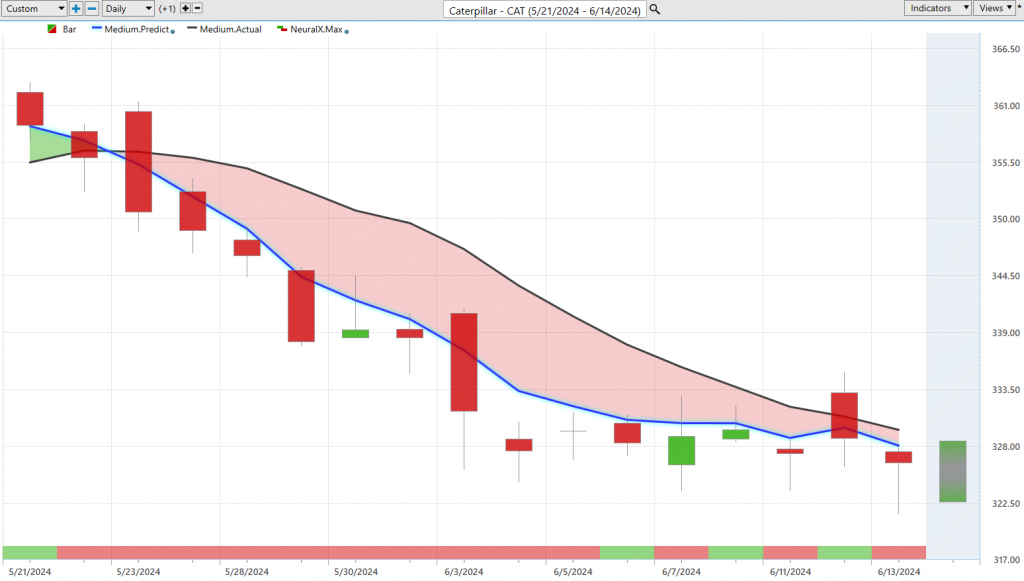
Lastly, Caterpillar ($CAT). Just wanted to highlight some of the weakness in the market. At some point, there’s going to be a blue line over the black line crossover here in Caterpillar, but certainly over this month, it is not an area where you want your attention in the marketplace. We see that crossover to the downside, neural index bearish, and all this bearish momentum taking prices materially lower. Again, you see when you get this contradiction here, the blue line below the black line, a lot of distance there, neural index bullish, and look at this week that you’ve had. Completely sideways as you’re getting that short-term strength with the neural index, but still in a downtrend. Clearly not an area that’s likely going to benefit this week as we see the broader market do well. At some point, if you want to trade Caterpillar, we’ll see those predictive indicators get bullish, and there’ll probably be some better opportunities. But an 8% slide just over the past 15 trading days is certainly not an area you want to be when we’ve got so many opportunities doing extremely well, and a lot of those Vantage Point forecast positions are to the bullish side.
We’ll go ahead and leave it there. Once again, this has been our Hot Stocks Outlook for June 14th, 2024. Thank you all for watching. Best of luck, and bye for now.
Source link