Shiba Inu’s Battle for Breakout: Key Resistance Levels That Could Trigger a 114% Rally – BitRss – Crypto World News

Shiba Inu (SHIB ($0.00)) is at a critical technical crossroads as analysts spotlight the resistance barriers the token must overcome to ignite a significant upward move. After a week-long decline that saw SHIB lose 18.57% in value, traders are closely watching for signs of a breakout or a deeper fall.
Despite bearish pressure, several indicators suggest SHIB could mount a recovery if it clears pivotal resistance zones. Here’s what analysts are saying and how SHIB’s recent price behaviour, accumulation trends, and technical formations point to its next major move.
SHIB Suffers Weekly Decline Amid Market Uncertainty
Between May 13 and May 19, SHIB dropped from just under $0.000017 to its current level near $0.00001407. This 18.57% weekly decline, including a 4.17% fall in the past 24 hours, confirms weakening momentum on shorter timeframes. Chart patterns show SHIB forming lower highs and lower lows—classic signs of a downtrend.
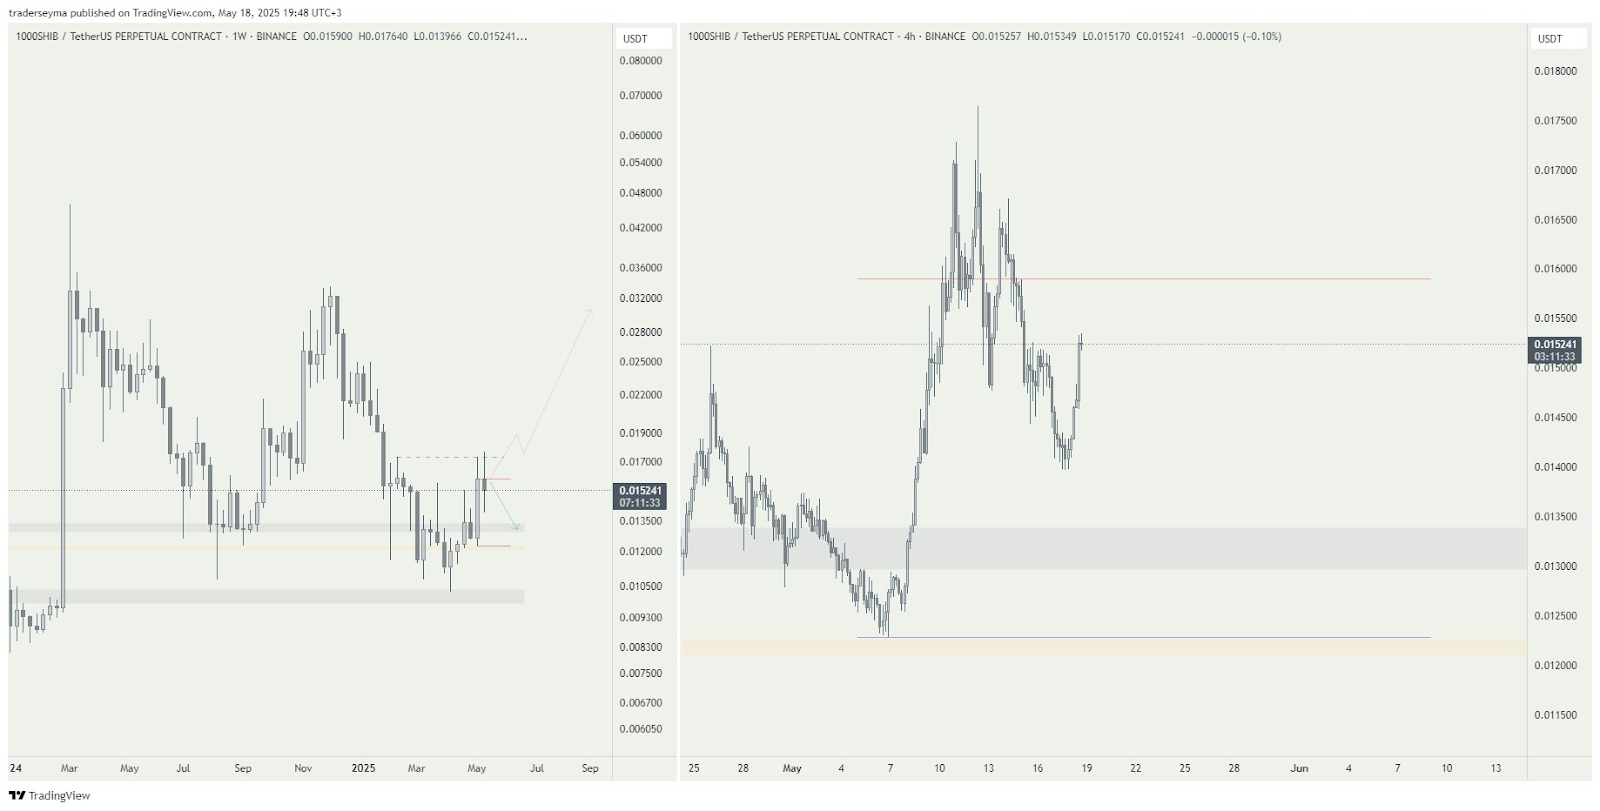
However, even in the face of downward pressure, analysts like Şeyma have identified signs of consolidation and potential reversal. Her multi-timeframe analysis focuses on the 1000SHIB/USDT ($1.00) pair on Binance and breaks down both weekly and 4-hour charts to map possible breakout scenarios.
Weekly Chart: Two Resistance Zones Stand in SHIB’s Way
Şeyma’s weekly analysis highlights a prolonged downtrend stretching from December 2024 to early 2025. But SHIB now appears to be stabilizing. According to her, this period of consolidation could signal a reversal, provided the token clears key resistance thresholds.
The first resistance level sits slightly above $0.000015. A weekly close above this red resistance line would be an early signal of bullish intent. Still, accurate confirmation comes only if SHIB also breaks the next critical resistance near $0.000017. A decisive move beyond these two levels would establish a bullish structure and open the path to $0.000030.
If SHIB climbs from $0.000014 to $0.000030, investors could witness a gain of approximately 114.29%.
Short-Term Resistance: What the 4-Hour Chart Reveals
Şeyma also examined SHIB’s recent price activity using the 4-hour chart. According to her, SHIB previously surged from below $0.00001250 to over $0.00001750 before undergoing a correction. This pullback brought the price back toward $0.00001600.
For the bullish thesis to remain valid, SHIB must now rally above this short-term resistance with strong volume and momentum. If that happens, it could be a precursor to the broader breakout forecasted on the weekly chart.
Until then, SHIB remains under key resistance, with a real risk of revisiting lower support zones.
Downside Risk: Where SHIB Could Retrace
If SHIB fails to gain enough momentum to breach resistance, Şeyma identifies two demand zones where the token may find support. The first lies just below $0.000013, while the second is located around $0.000010. These zones may act as bounce points in the event of a breakdown, offering traders potential re-entry zones.
Whale Accumulation Signals Long-Term Confidence
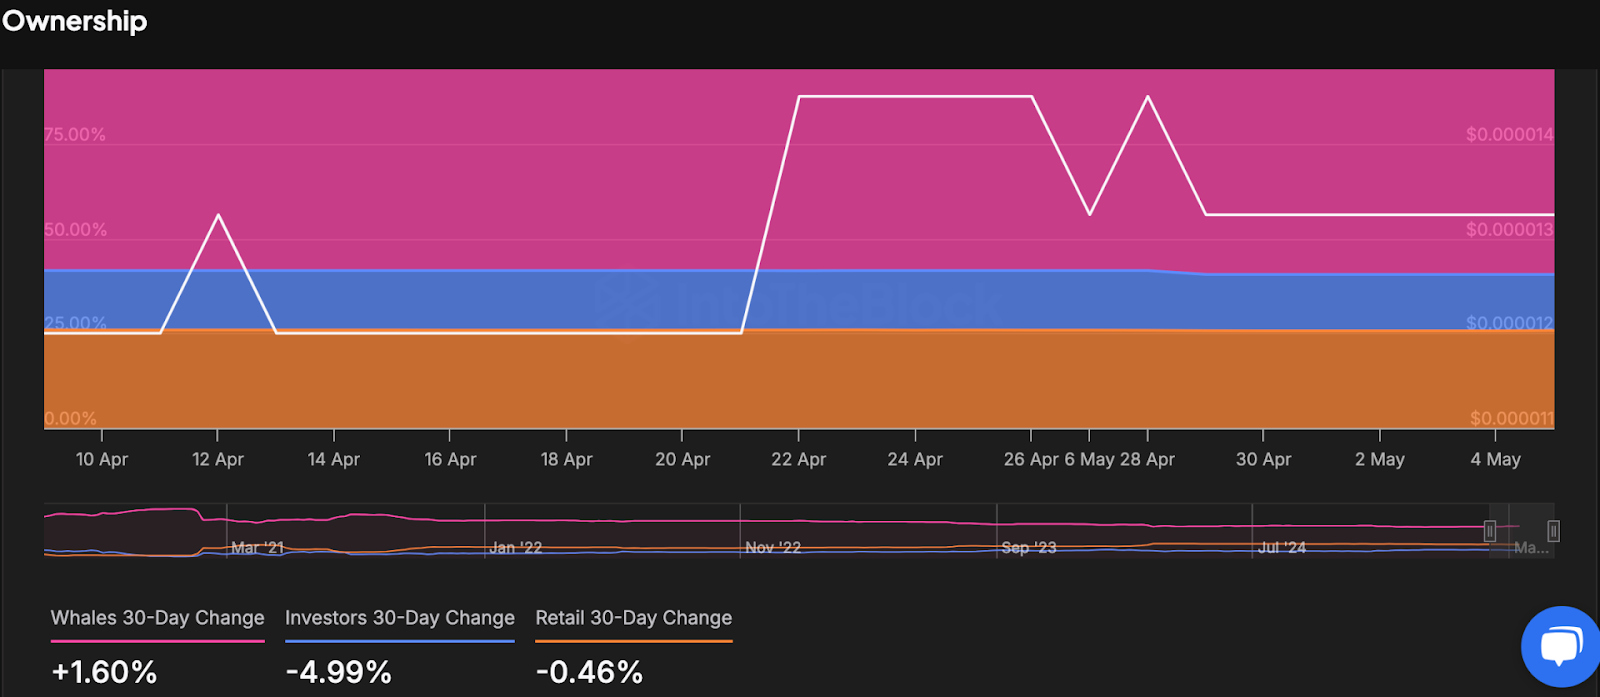
Beyond technical indicators, on-chain data from IntoTheBlock provides insights into shifting ownership patterns. Over the past month, whale wallets have increased their holdings by 1.60%, suggesting quiet accumulation by long-term holders. In contrast, mid-sized investors have reduced their exposure by 4.99%, while retail holders have remained relatively stable with only a 0.46% drop.
Shiba Inu Ownership DataThis shift implies that control is gradually shifting from smaller investors to whales, often a sign of strategic accumulation ahead of a major price move.
Trendline Resistance Still Intact, Says MMBTtrader
While the recent data offers reasons for optimism, not all analysts are convinced of an immediate breakout. TradingView analyst MMBTtrader emphasized that a long-standing descending trendline continues to act as a major resistance.
This trendline, active since early 2024, has rejected several breakout attempts, including a failed move near $0.000033. Following that rejection, SHIB retraced to support near $0.000010083.
Related article: If You Hold 1 Billion SHIB, Here’s How Much You Could Earn If Shiba Inu Returns to Its ATH ($0.05)
MMBTtrader argues that the bearish structure will persist unless SHIB convincingly breaks above this trendline, which recently aligned near $0.000026. He predicts the resistance may lower to $0.00002044 over time. A breakout beyond that could eventually push SHIB toward $0.000033.
Conclusion: A Pivotal Moment for SHIB
Shiba Inu finds itself at a technical inflection point. Mounting whale accumulation and consolidation on multiple timeframes set the stage for a potential breakout. But SHIB must first conquer the resistance zones at $0.000015 and $0.000017 to build momentum toward the much-anticipated $0.000030 target.
Failure to do so could cause the token to retreat to lower demand levels. For now, all eyes remain on SHIB’s next weekly close and the volume behind its next big move. Traders should prepare ahead of time for high volatility and, as always, make informed decisions backed by research and risk management.
The post Shiba Inu’s Battle for Breakout: Key Resistance Levels That Could Trigger a 114% Rally appeared first on FXcrypto News.
Source link