🎯 PulseMark Pro – Non-Repainting MT4 + Visual Confirmation 🎯
🎯 PulseMark Pro – Non-Repainting MT4 Trend Indicator with Visual Confirmation
PulseMark Pro is a non-repainting MetaTrader 4 indicator designed to identify structural trend shifts using logic-based price analysis and dynamic Bollinger Band deviations. It offers a clean visual layout, combining signal dots and trend lines to help confirm directional changes — without relying on basic candle color or fixed rules.

🔁 Spot the Transition Point
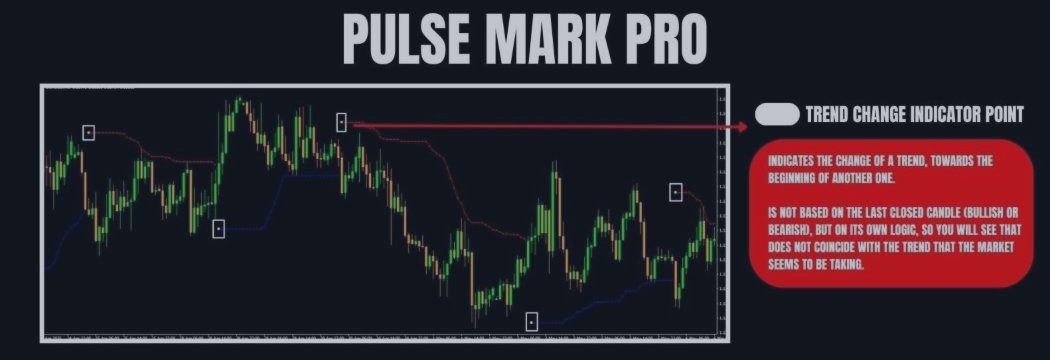
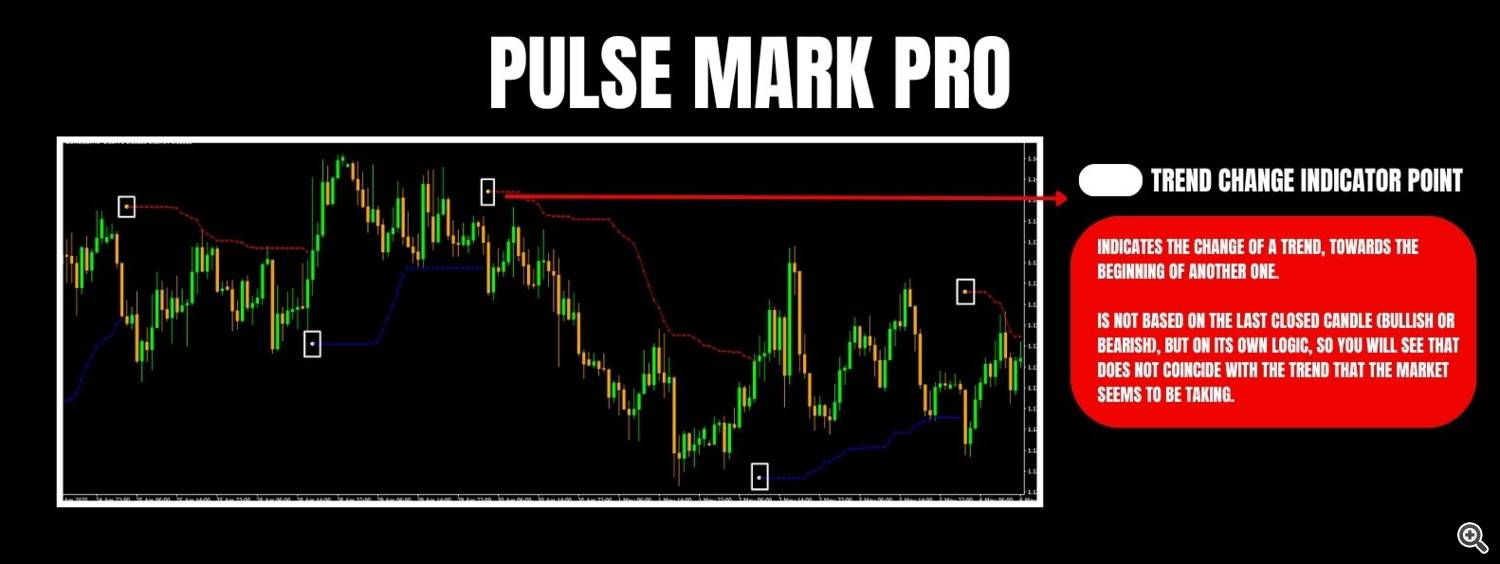
At the heart of PulseMark Pro is the trend change indicator point: a small dot placed on the chart to signal a high-probability shift in trend.
Unlike many indicators, this signal is not tied to candle color or immediate direction. It uses internal logic based on price action, volatility, and deviation — allowing it to sometimes anticipate or slightly lag depending on market noise.
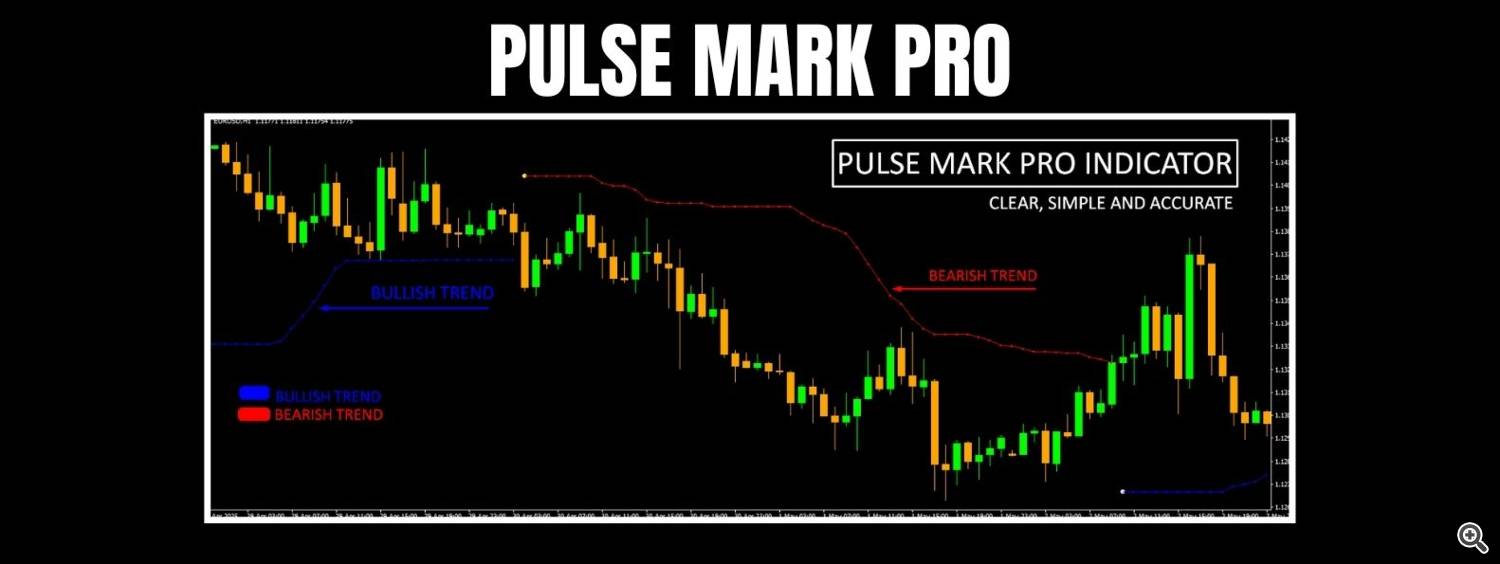
📉 Visual Trend Lines for Confirmation

Once the trend shift is detected, dotted guide lines appear on the chart to confirm the active context:
🔵 Blue dotted line = bullish trend
🔴 Red dotted line = bearish trend
These lines update dynamically and help traders stay aligned with the market’s current structure, offering a clear reference for entry logic or bias.
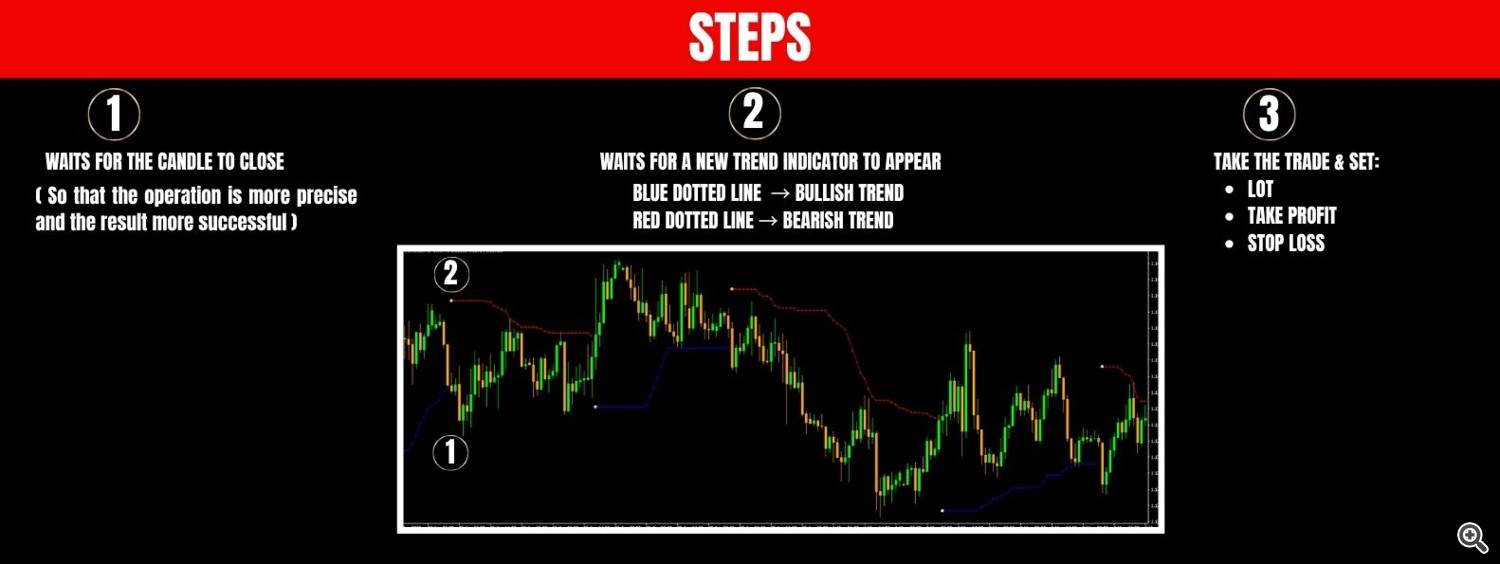
🧭 Simple Trading Workflow
PulseMark Pro was built to support structured trading without being rigid. Suggested steps:
1️⃣ Wait for the candle to close
The signal dot becomes valid only after the bar is completed. This avoids false signals from unfinished candles.
2️⃣ Check the dotted trend line
Use it as confirmation that the market structure is shifting or continuing.
3️⃣ Define the trade
Once confirmed, a trade may be placed manually, with the trader choosing:
• Lot size
• Take Profit
• Stop Loss

The indicator does not auto-trade, but provides clear visual inputs that integrate easily into any strategy.
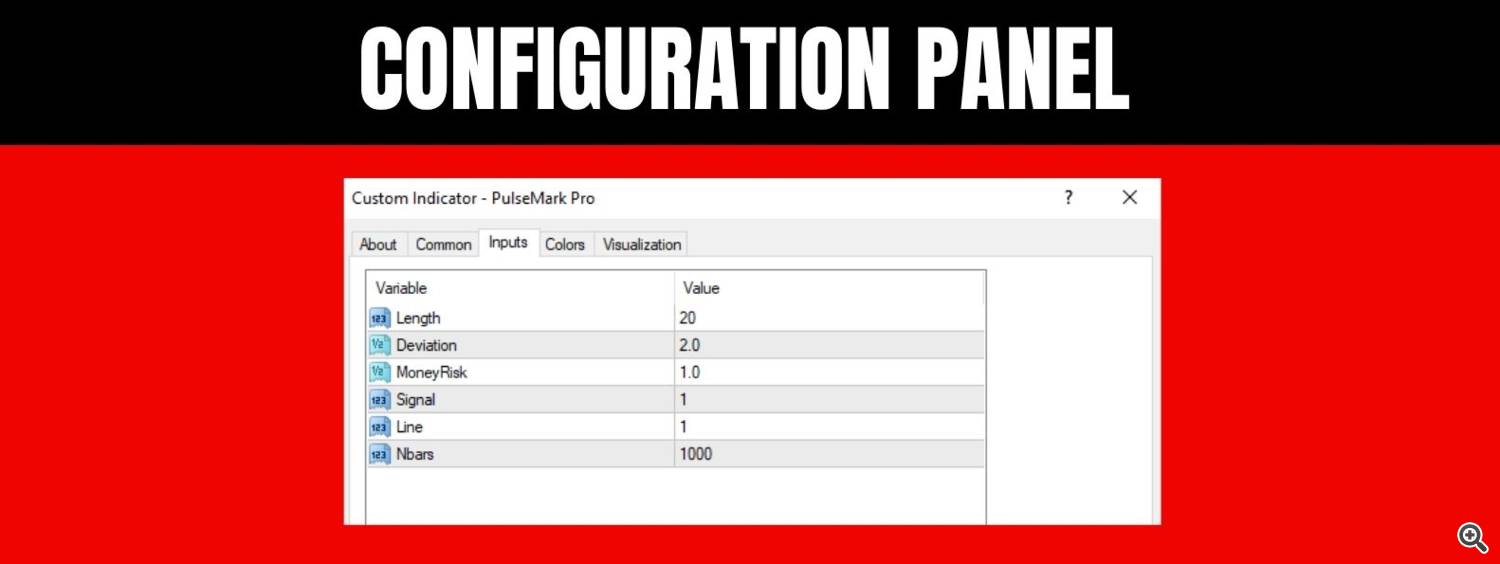
⚙️ Input Configuration Panel
PulseMark Pro includes a small set of parameters that can be adjusted to fit the market, timeframe, or trading style:
• Length: Lookback period for trend calculations
• Deviation: Sensitivity setting for signal filtering
• MoneyRisk: For internal scaling (not used for auto-trading)
• Signal / Line: On/off toggles for dots and trend lines
• Nbars: Total number of bars used in plotting the indicator

This minimal but flexible setup allows full control over how the signals respond.
🔬 Logic Behind the Signals
PulseMark Pro is powered by a multi-layered volatility model anchored on dynamic Bollinger Band calculations. Rather than reacting impulsively to price movements, the system incorporates a delayed validation layer, monitoring whether market price sustains a statistically significant deviation from the upper or lower boundary of its volatility envelope.
When price exceeds the upper band, the system does not immediately interpret it as bullish pressure. Instead, a conditional evaluation is triggered, analyzing continuation strength, band slope, and structural positioning relative to recent price behavior. The same applies to lower-band breaches, which undergo a mirrored analysis.
Only when certain momentum and deviation criteria are met — and sustained across multiple checkpoints — is a directional state confirmed. From there, PulseMark Pro visualizes this validated shift with a context-aware signal dot and a corresponding trend line.
This layered logic was specifically crafted to suppress transient noise, reduce the impact of short-term anomalies (such as candle wicks or spikes), and present a refined representation of market structure. As a result, signals are neither overreactive nor lagging — they emerge from deliberate, qualified confirmation.
📬 Have questions? I’m here to help — feel free to reach out!
Source link