Nifty Reaches Critical Showdown at 24630 as Powerful Reversal Signals Emerge – Bramesh’s Technical Analysis
Market Analysis: FIIs Double Down on Bearish Bets, Creating a High-Stakes Showdown with Retail Bulls
Executive Summary:
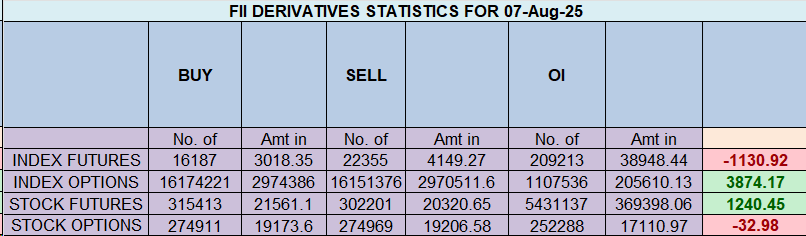
The derivatives data from August 7th reveals a deeply concerning escalation of bearish conviction from Foreign Institutional Investors (FIIs), setting the stage for a highly volatile market showdown. FIIs aggressively added to their short positions, pushing their long-to-short ratio to an alarming 09:91. This move was directly countered by retail clients, who absorbed this selling pressure by closing out their shorts and adding new longs. The significant increase in Open Interest confirms that new, high-stakes positions are being built on both sides. This classic and extreme divergence between “smart money” pessimism and retail optimism has created a precarious environment where the risk of a sharp, downward move has increased dramatically.
1. FII Activity: An Unambiguous Bearish Escalation
The actions of FIIs were not just a continuation of their bearish stance; they were a significant doubling-down.
-
Aggressive Short Building: FIIs added a substantial 6,835 new short contracts while adding a negligible 667 long contracts. This is a clear signal of active, aggressive betting on a market decline. The net activity of shorting over 6,000 contracts, worth more than 1,100 crore, underscores the high level of conviction behind this move.
-
Extreme Positioning: The resulting long-to-short ratio of 09:91 (or 0.09) is at a level of extreme pessimism. This indicates that for every one contract FIIs hold for a potential upside, they are holding over ten contracts betting on a fall. This is a maximalist bearish stance, suggesting they anticipate a significant downward move and are positioning for it with force.
2. Client Behavior: The Unflinching Optimist
The retail client segment took the exact opposite side of this trade, displaying remarkable optimism in the face of institutional selling.
-
Abandoning Bearish Bets: Clients covered 3,666 short contracts, indicating a belief that the market’s downside is limited and that holding short positions is no longer prudent.
-
Adding New Longs: Simultaneously, they added 1,270 new long contracts, absorbing some of the FII selling pressure and reaffirming their bullish outlook.
-
Steadfastly Bullish Positioning: Their overall long-to-short ratio remains at a highly optimistic 70:30. This shows that the retail segment, as a whole, is positioned for a rally and is actively fighting the institutional-led downtrend.
3. The Crucial Confirmation: Rising Open Interest (OI)
The increase in Open Interest by 6,068 contracts is a critical piece of evidence that cannot be overlooked.
-
New Positions, Not Closing: A rise in OI confirms that new money is entering the market and the net result is the creation of fresh positions. This is not just a case of old bulls selling to old bears.
-
A Bearish Signal: In this context, the rise in OI was driven by FIIs creating fresh shorts and clients creating fresh longs. When OI increases in a falling or pressured market, and the increase is driven by institutional short-selling, it is a classic and powerful bearish continuation signal. It suggests that the market is absorbing bearish bets, making it “heavier” and more vulnerable to a sharp decline.
Market Outlook and Strategic Implications
-
Primary Scenario: High Risk of a Downward Move. The overwhelming weight of institutional money is now on the short side. This creates a dangerous environment for bulls. Any attempts at a rally are likely to be sold into aggressively by FIIs.
-
The Path of Maximum Pain: With retail so heavily positioned on the long side, a significant market decline would inflict the most financial damage on the largest number of participants—a scenario the market often follows.
-
Confirmation to Watch: A decisive break of the day’s low or a major support level would act as a technical trigger, likely validating the FIIs’ bearish stance and potentially leading to a cascade of stop-loss selling from the trapped retail longs.
Conclusion:
The data from August 7th paints a clear and ominous picture. The institutional players have not just maintained their bearish view; they have aggressively escalated it. This extreme divergence between smart money and retail sentiment, confirmed by rising open interest, has significantly raised the probability of a near-term market decline. The risk-reward is heavily skewed to the downside, and any bullish positions are now fighting a formidable institutional tide. Prudence and caution are paramount.
Last Analysis can be read here
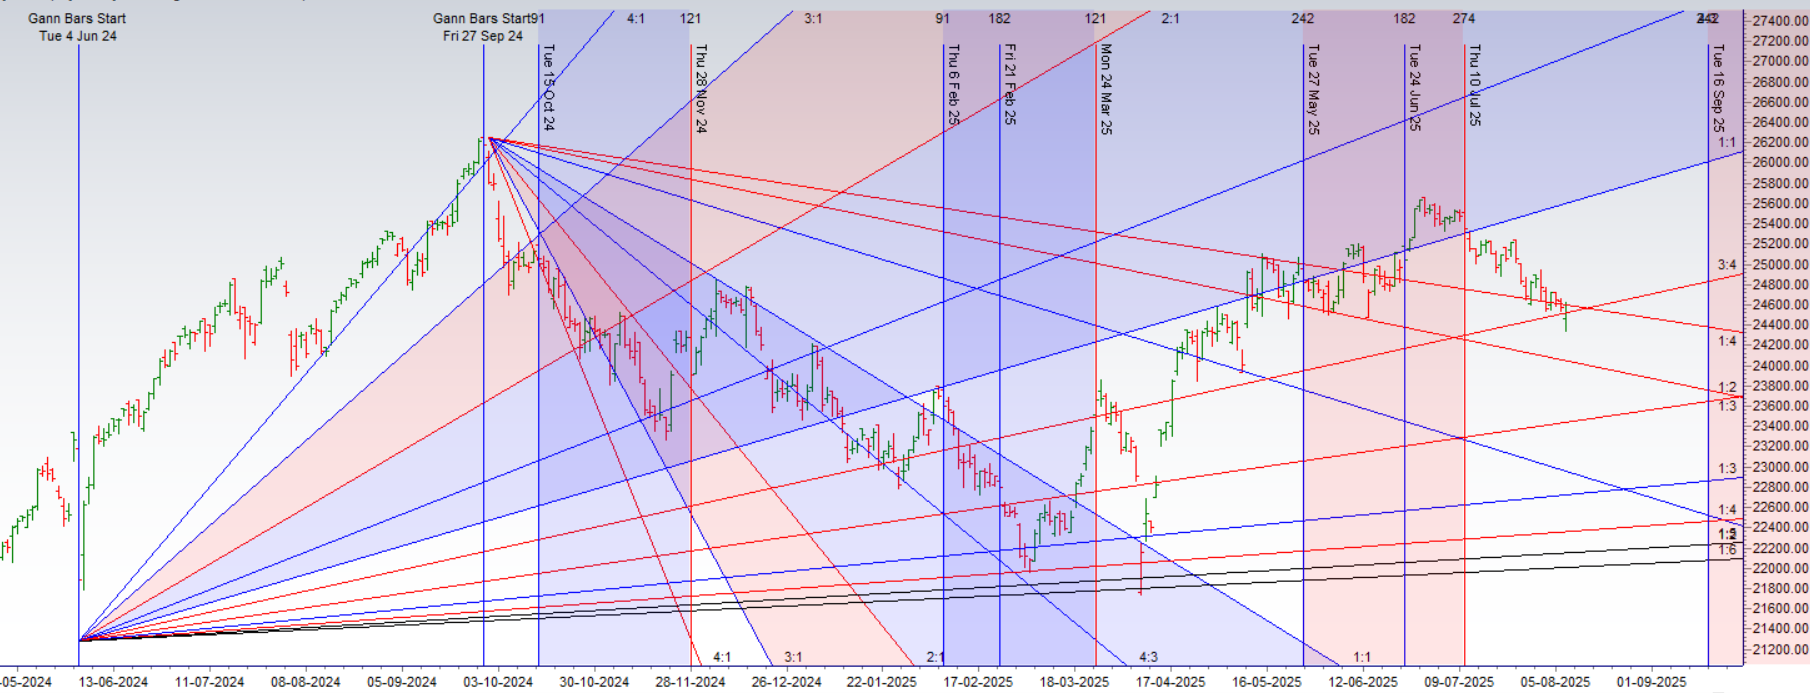
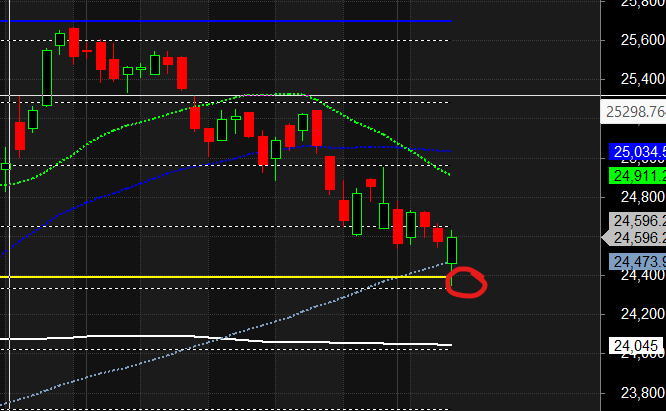
Following a powerful recovery driven by the impact of the Mars sign change, the Nifty has battled its way back to the crucial “squaring of space” level of 24630. The market is now at a pivotal inflection point. A promising Doji candlestick is forming on the weekly chart after five weeks of decline, signaling potential trend exhaustion. However, this bullish hope requires a decisive close above 24630 today to be validated. With a Full Moon promising volatility for Monday and a Mars Declination event providing a clear intraday trading map for today, the stage is set for a high-stakes confrontation that will likely determine the market’s next major move.
1. The Technical Recovery and the 24630 Wall
The market has shown significant resilience, with the recent recovery confirming the powerful impact of the Mars house change. This rally has led the Nifty directly to its most significant near-term challenge: the 24630 level.
-
A “Squaring of Space” Level: This is not just another resistance point. In technical analysis, such a level represents a point of equilibrium between price and time. It is a major hurdle where the market’s momentum will be severely tested.
-
The Bull-Bear Battleground: A failure to break through and close above 24630 would be a significant victory for the bears, suggesting that the recent recovery was merely a pullback within a larger downtrend. Conversely, conquering this level would signal a genuine shift in market control.
2. The Weekly Doji: A Sign of Bearish Exhaustion
Adding to the drama at this critical juncture is a powerful candlestick pattern forming on the weekly chart.
-
Significance of the Doji: After a prolonged five-week decline, the formation of a Doji is a classic and promising sign of a potential trend reversal. A Doji signifies indecision and equilibrium—the point at which the sellers’ momentum has waned, and the buyers have found the strength to hold the line.
-
The Crucial Condition: While promising, this Doji is currently just a signal of a potential bottom. Its bullish power will only be unlocked if the Nifty achieves a decisive close above 24630 today. Without this confirmation, it simply represents a temporary pause before the downtrend potentially resumes.
3. The Astrological Triggers: Mapping Today’s and Monday’s Volatility
Two key astrological events are adding fuel to the fire, providing a roadmap for the expected volatility.
-
Today (Mars at Zero Declination): This event is known for creating major pivot points in market energy. It provides a clear and actionable intraday trading strategy:
-
The 15-Minute Rule: The high and low of the first 15 minutes of today’s session will act as the key directional guides. A sustained move above the 15-minute high would suggest the bulls are taking control for the day, while a break below the low would signal that the bears are reasserting their dominance. This setup is expected to create a highly volatile session.
-
-
Monday (The Full Moon): A Full Moon over the weekend is often associated with a culmination of energy, peak emotion, and trend reversals. Its impact on Monday’s session reinforces the theme that the market is at a major turning point, and the outcome of today’s battle will likely be amplified early next week.
Conclusion:
The Nifty is perfectly poised on a knife’s edge. A strong recovery has met an even stronger resistance at 24630. The weekly chart is flashing a powerful bottoming signal, but it requires bullish follow-through today. The session is guaranteed to be volatile, but the Mars Declination event offers a clear strategy for navigating the intraday swings. The close today is paramount: above 24630, and the path is open for a new bullish leg; below it, and the bears remain in control. The battle for this level will set the stage for a dramatic start to the next week under the influence of the Full Moon.
Nifty Trade Plan for Positional Trade ,Bulls will get active above 24578 for a move towards 24656/24734/24812. Bears will get active below 24500 for a move towards 24422/24344
Traders may watch out for potential intraday reversals at 09:28,10:26,11:54,01:03,02:26 How to Find and Trade Intraday Reversal Times
Nifty Aug Futures Open Interest Volume stood at 16.7 lakh cr , witnessing addition of 0.70 Lakh contracts. Additionally, the increase in Cost of Carry implies that there was addition of SHORT positions today.
Nifty Advance Decline Ratio at 30:20 and Nifty Rollover Cost is @24887 closed below it.
Nifty Gann Monthly Buy Level : 24887
Nifty Gann Monthly Sell Level : 24582
Nifty has closed below its 100 SMA @ 24994 Trend is Buy on dips till above 24389
Nifty options chain shows that the maximum pain point is at 24600 and the put-call ratio (PCR) is at 0.81.Typically, when the PCR open interest ranges between 0.90 and 1.05, the market tends to remain range-bound.
Nifty 50 Options Chain Analysis
The Nifty 50 options chain indicates that the highest open interest (OI) on the call side is at the 24600 strike, followed by 24700 strikes. On the put side, the highest OI is at the 24500 strike, followed by 24400 strikes. This suggests that the market participants are expecting Nifty 50 to remain range between 24400-24700 levels.
In the cash segment, Foreign Institutional Investors (FII) sold 4997 cr , while Domestic Institutional Investors (DII) bought 10864 cr.
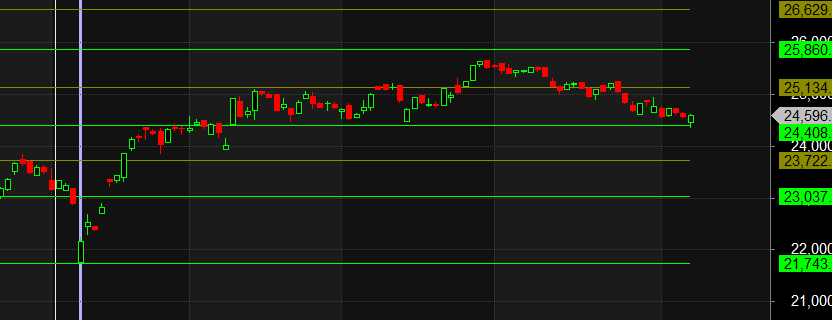
Traders who follow the musical octave trading path may find valuable insights in predicting Nifty’s movements. According to this path, Nifty may follow a path of 23037-23722-24408-25134-25860 This means that traders can take a position and potentially ride the move as Nifty moves through these levels.Of course, it’s important to keep in mind that trading is inherently risky and market movements can be unpredictable.
When you really believe that trading is simply a probability game, concepts like right or wrong or win or lose no longer have the same significance.
For Positional Traders, The Nifty Futures’ Trend Change Level is At 24711. Going Long Or Short Above Or Below This Level Can Help Them Stay On The Same Side As Institutions, With A Higher Risk-reward Ratio. Intraday Traders Can Keep An Eye On 24558, Which Acts As An Intraday Trend Change Level.
Nifty Intraday Trading Levels
Buy Above 24610 Tgt 24648, 24680 and 24729 ( Nifty Spot Levels)
Sell Below 24580 Tgt 24529, 24496 and 24439 (Nifty Spot Levels)
Wishing you good health and trading success as always.As always, prioritize your health and trade with caution.
As always, it’s essential to closely monitor market movements and make informed decisions based on a well-thought-out trading plan and risk management strategy. Market conditions can change rapidly, and it’s crucial to be adaptable and cautious in your approach.
► Join Youtube channel : Click here
► Check out Gann Course Details: W.D. Gann Trading Strategies
► Check out Financial Astrology Course Details: Trading Using Financial Astrology
► Check out Gann Astro Indicators Details: Gann Astro Indicators
Related
Source link