🎯 5 Common Mistakes in Using MT5 Indicators (and How to Fix Them)

✨ Summary
MT5 indicators are powerful, but many traders use them the wrong way.
This leads to confusion, bad signals, and wasted time.
Here are the top mistakes ⚡ and the easy fixes.
📌 Key Takeaways
-
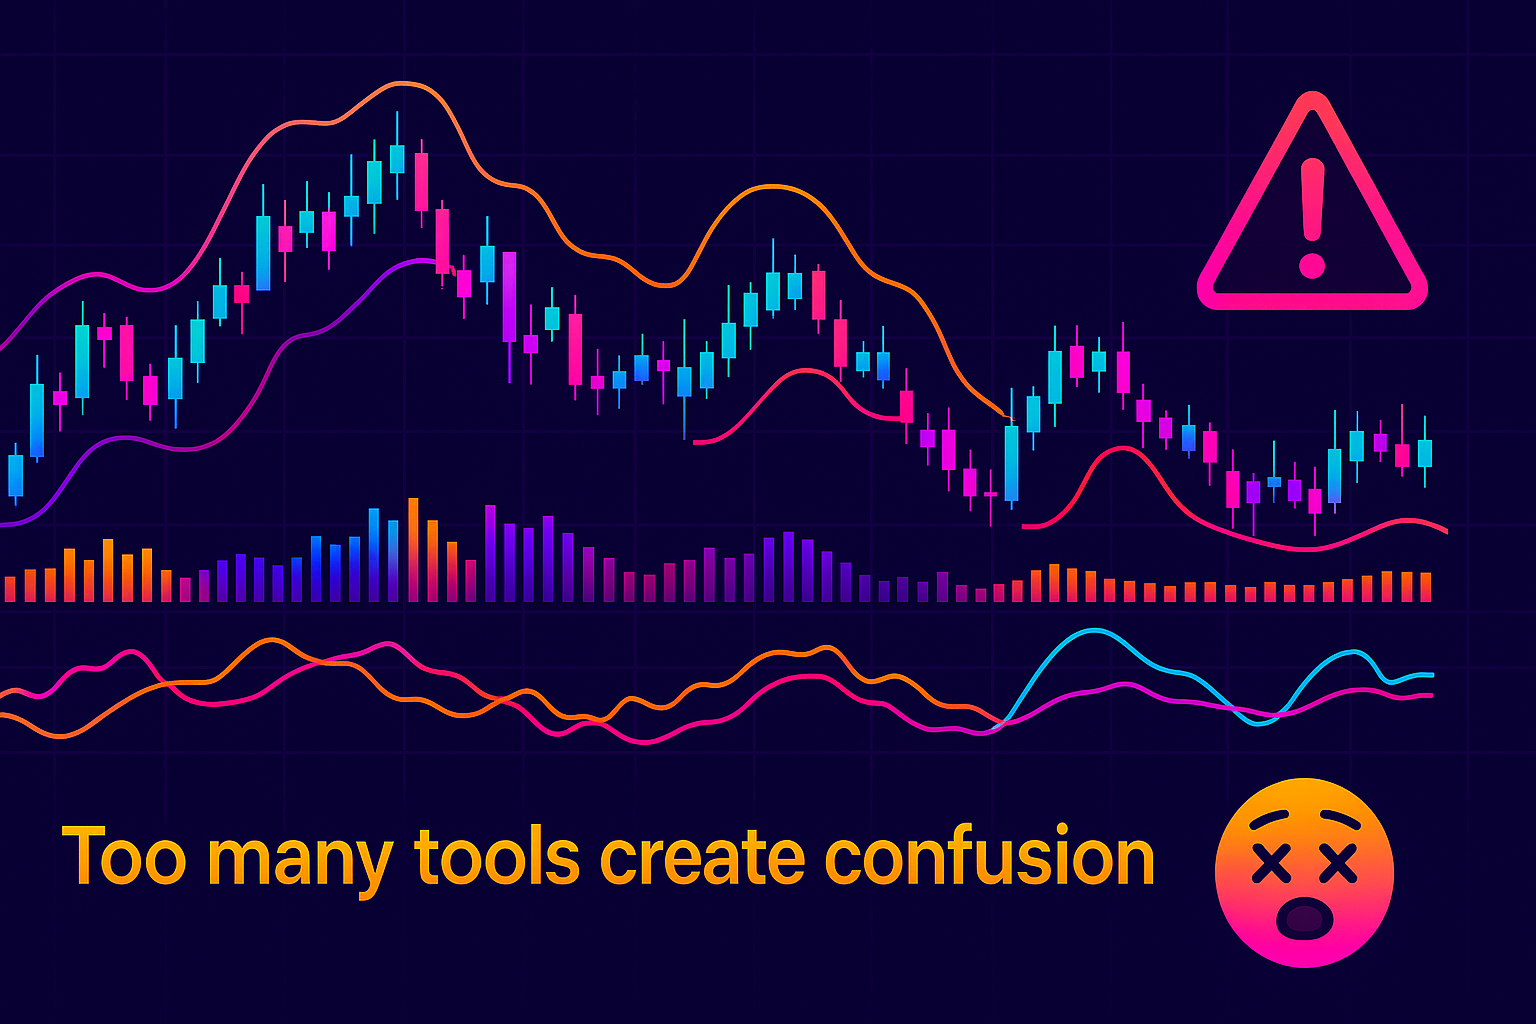
🚫 Don’t overload your chart with too many indicators.
-
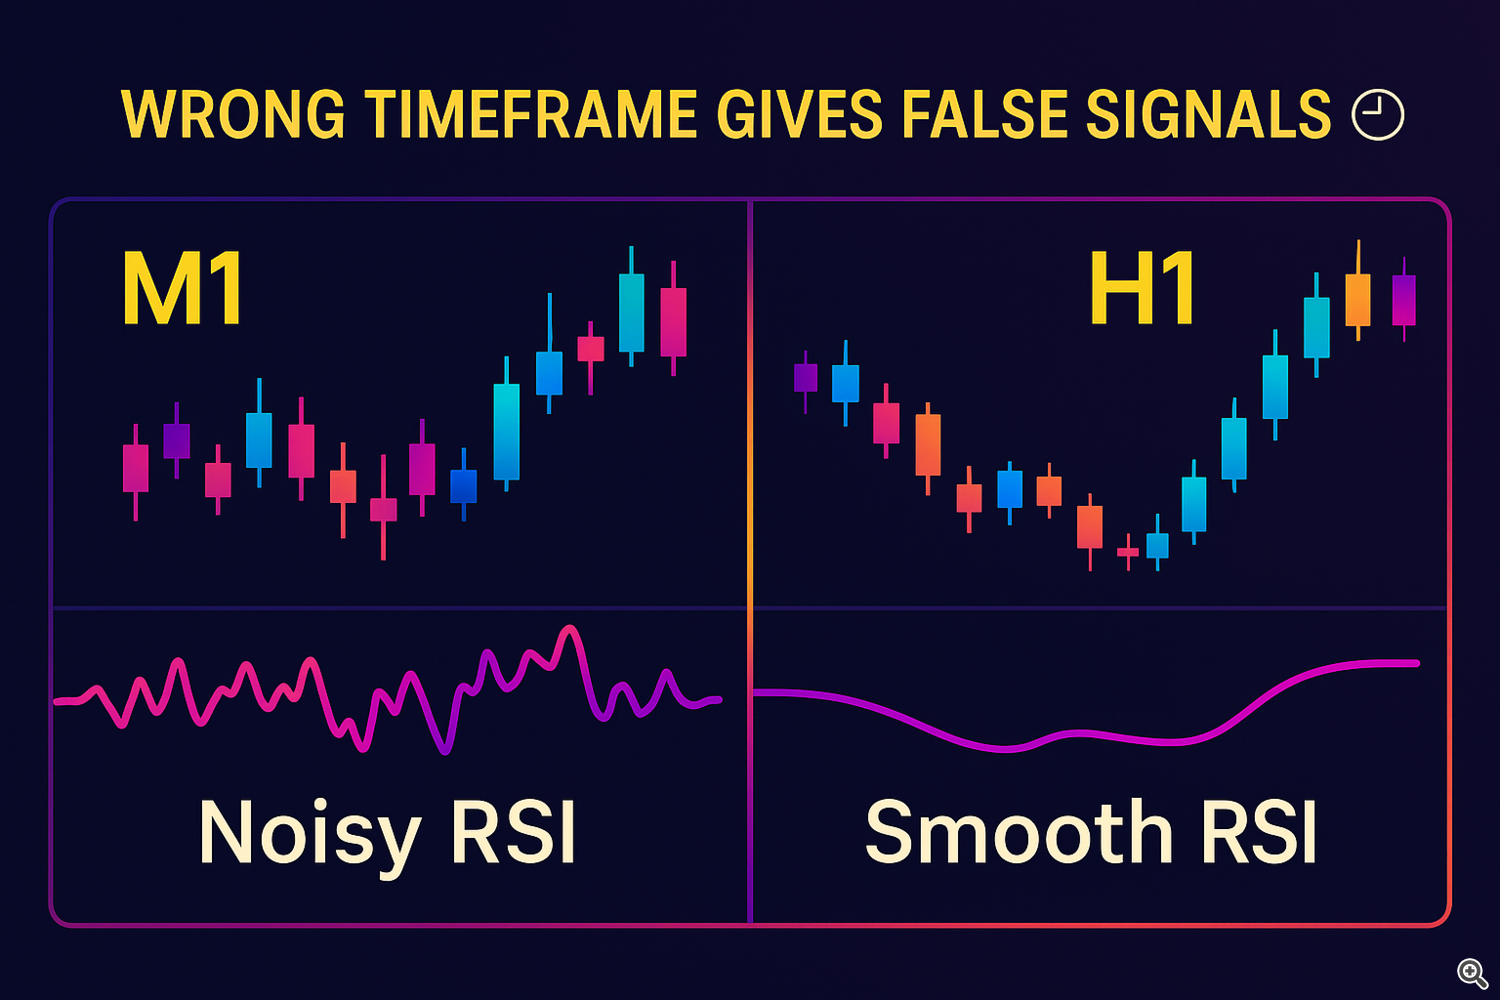
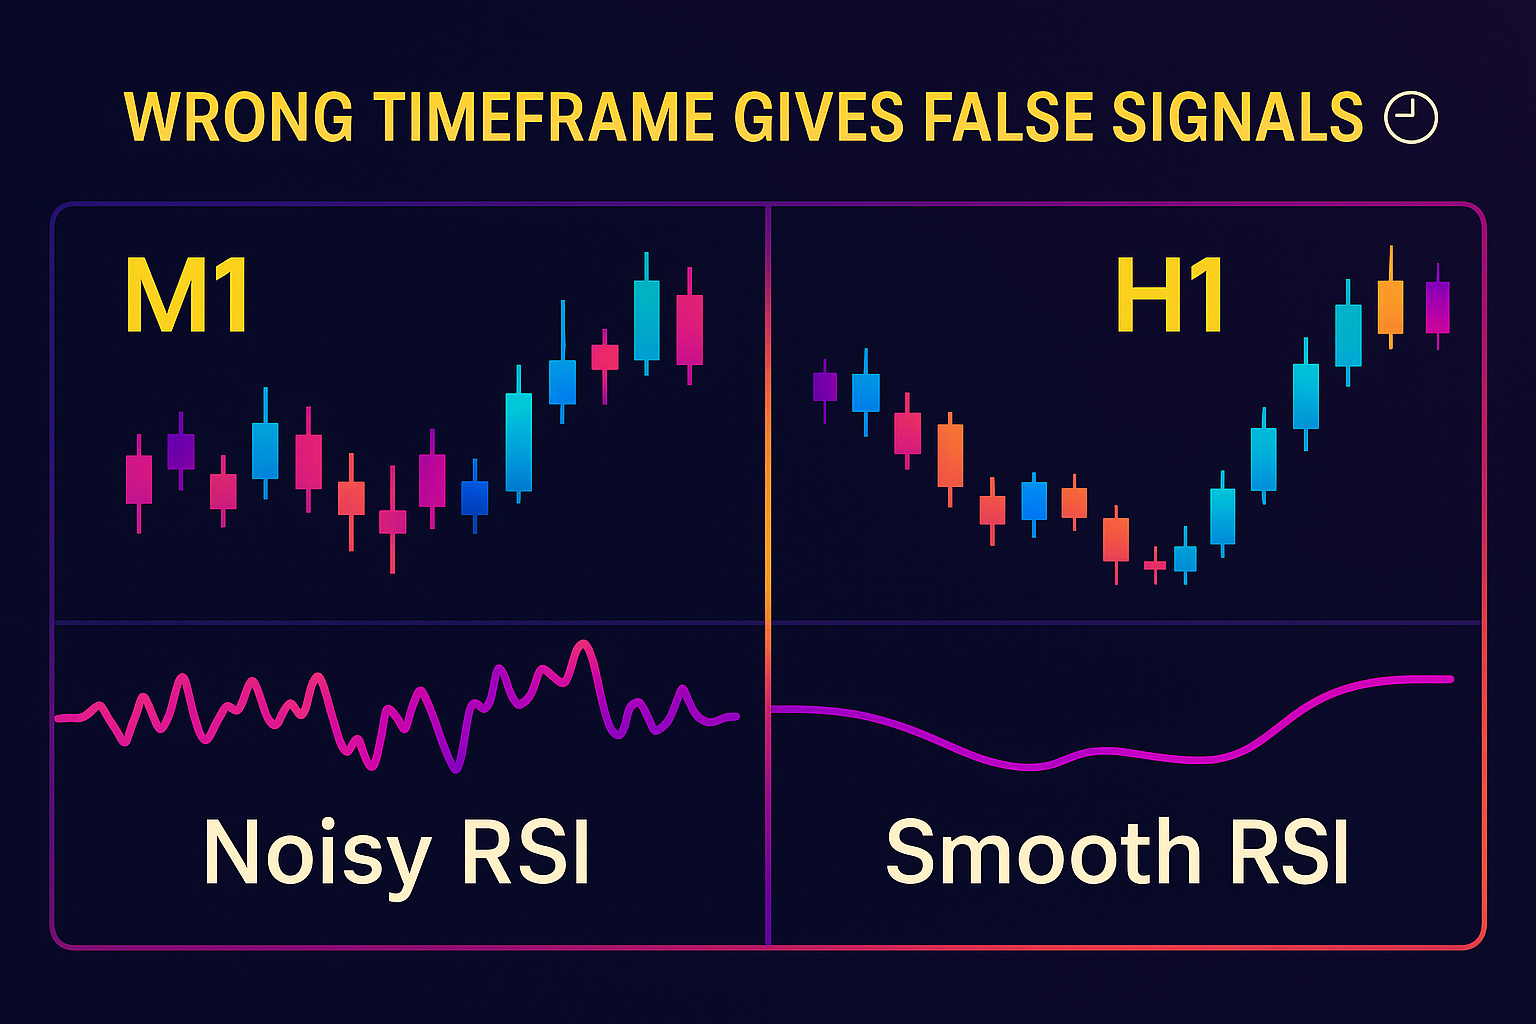
⏰ Always match the indicator timeframe to your trading style.
-
🤔 Avoid using indicators without knowing what they measure.
-
🔧 Adjust default settings — don’t assume they fit every market.
-
✅ Confirm signals instead of acting on the first alert.
🧠 A – The Idea in Simple Words
Indicators are like tools in a toolbox 🧰.
Using too many at once is like trying to hammer a nail with a screwdriver and a wrench at the same time 🔨🔧.
You don’t need them all — just the right ones.
Each indicator has a purpose, but if you misuse it, you’ll get bad results.
MT5 gives you flexibility, but you need discipline. 💡
🖥️ B – MT5 Steps to Manage Indicators
1️⃣ Open a chart in MT5.
2️⃣ Go to Insert → Indicators.
3️⃣ Choose one indicator (e.g., Moving Average).
4️⃣ Right-click the chart → Indicators List to see all active ones.
5️⃣ ❌ Remove what you don’t need.
6️⃣ ⚙️ Adjust settings by double-clicking the indicator.
📊 C – Quick Example
Imagine you are scalping EURUSD:
❌ You load RSI (14), MACD, Stochastic, and Bollinger Bands all at once.
➡️ All four give mixed signals.
➡️ You hesitate, enter late, and lose pips.
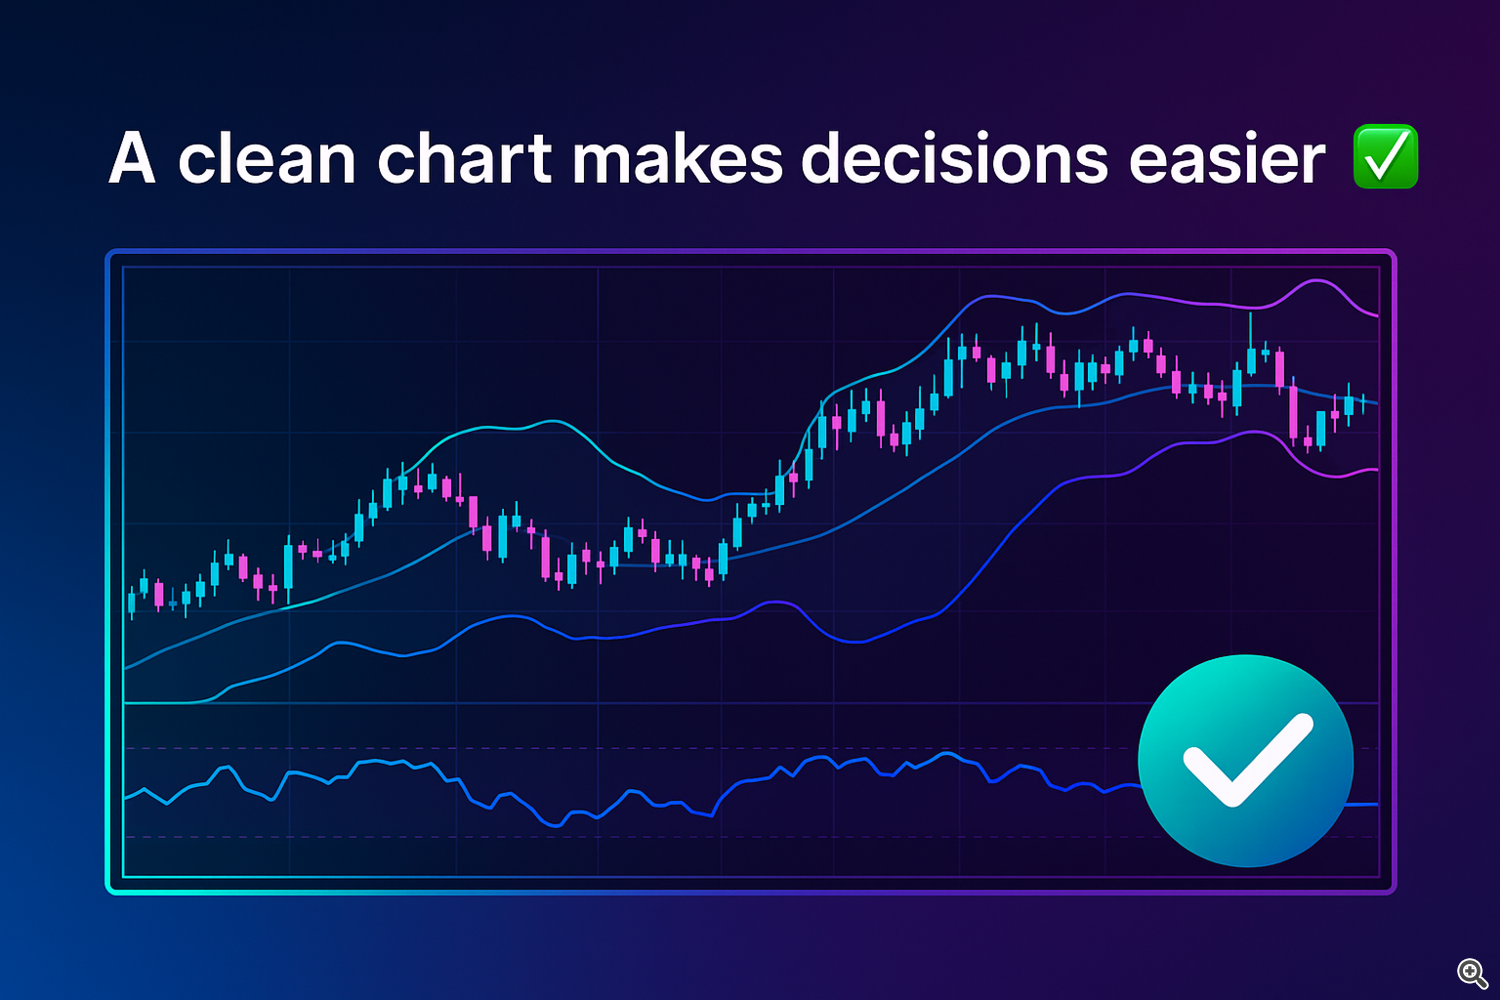
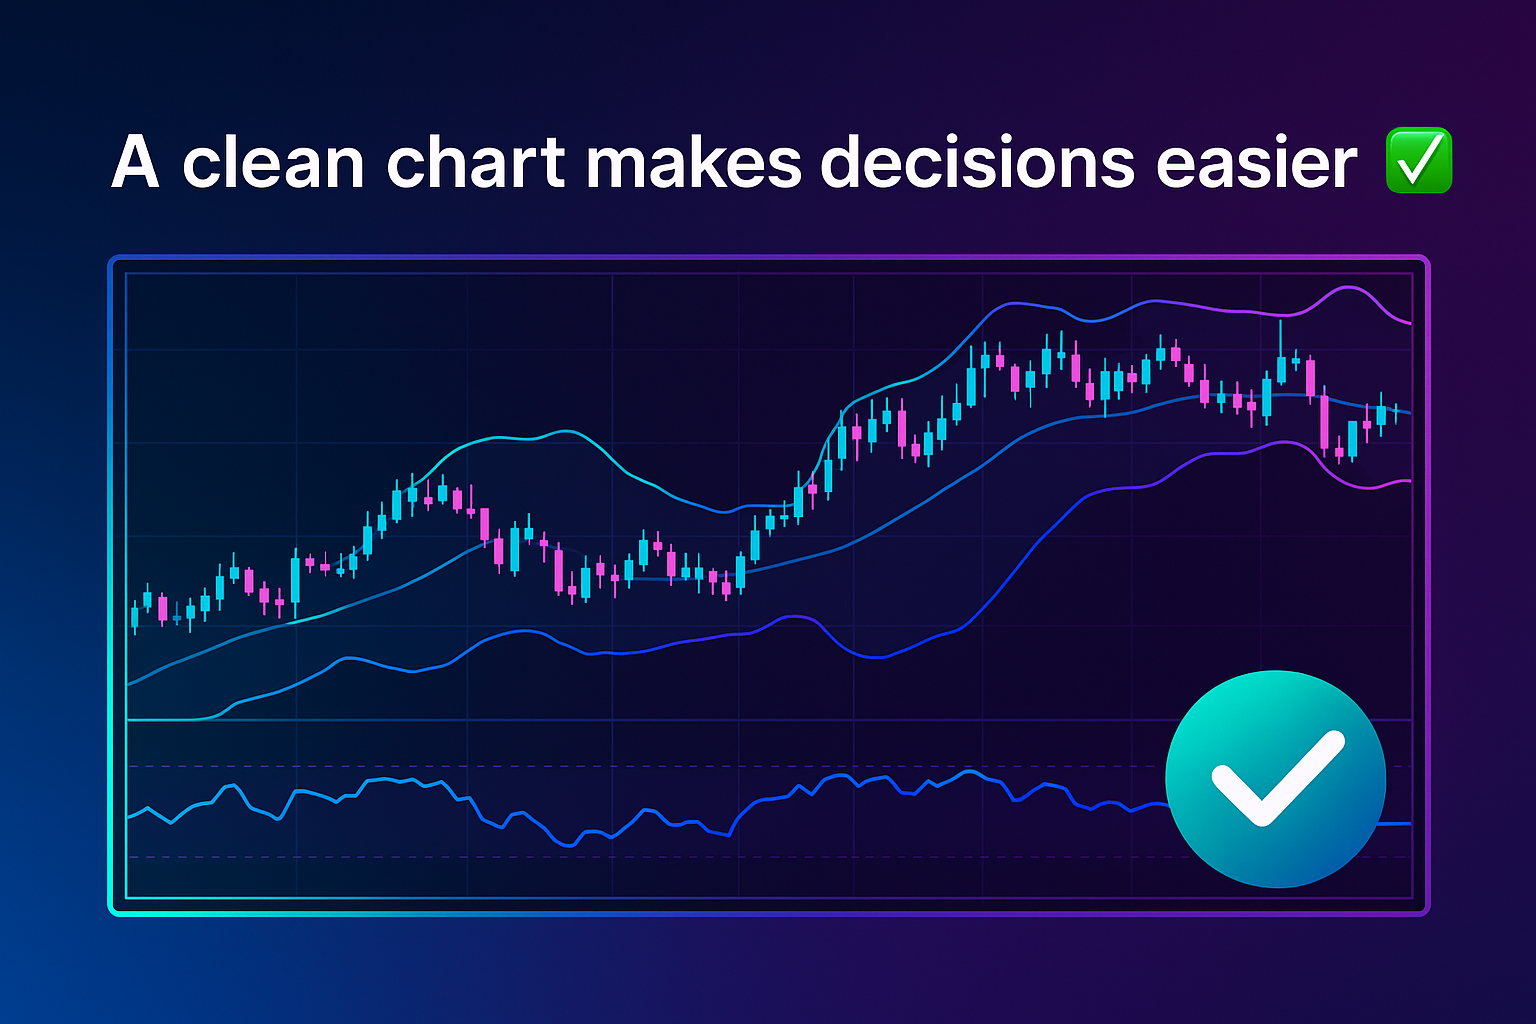
✅ Instead:
Use RSI (14) + Bollinger Bands.
➡️ One shows momentum, the other shows volatility.
➡️ The chart is clear, and your decision is faster ⚡.
🚩 D – Common Mistakes & Fixes
-
📉 Too many indicators → Use 1–2 max.
-
⏳ Wrong timeframe → Match your style (M1 for scalping, H4+ for swing).
-
🔧 Ignoring settings → Test and tweak inputs.
-
👀 Blind signals → Confirm with price action.
-
🧹 Never removing old tools → Keep your chart clean.
📢 Follow My Updates
👉 Follow the trades & updates on MQL5 → https://www.mql5.com/en/channels/issam_kassas
📖 Mini-Glossary
-
📊 Indicator: Chart tool that uses price/math to show signals.
-
📈 RSI: Relative Strength Index, shows overbought/oversold.
-
📉 MACD: Trend & momentum indicator.
-
🎯 Bollinger Bands: Volatility indicator.
-
⏰ Timeframe: Chart’s period (M1, H1, D1, etc.).
-
💵 Price Action: Trading decisions from price itself, not indicators.
✅ Checklist
-
Use only 1–2 indicators.
-
Match indicator timeframe to your style.
-
Adjust default settings.
-
Confirm signals before entry.
-
Keep chart clean.
Source link