Fibonacci Cycles Explained: Unlock the Secrets of Market Timing
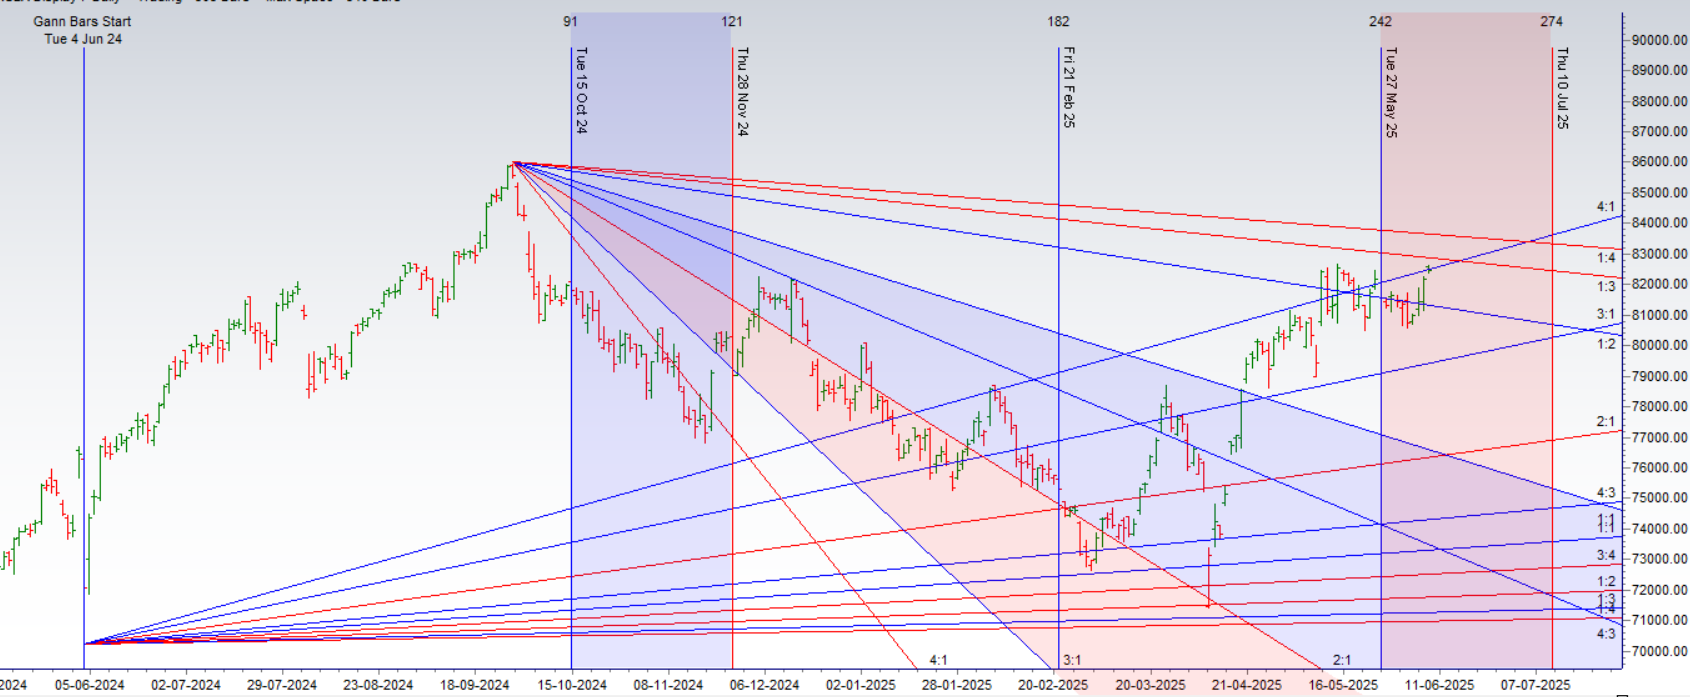
Fibonacci Cycles are based on the idea that price movements in the market follow recurring intervals that can be measured using Fibonacci numbers. These cycles are plotted as vertical lines on a price chart, highlighting when the market might reverse, consolidate, or continue its trend.
The key Fibonacci numbers used in Fibonacci Cycles include 13, 21, 34, 55, 89, 144, and 377—all part of the Fibonacci sequence. These numbers represent particular time intervals in a market cycle, helping traders identify potential support and resistance levels.
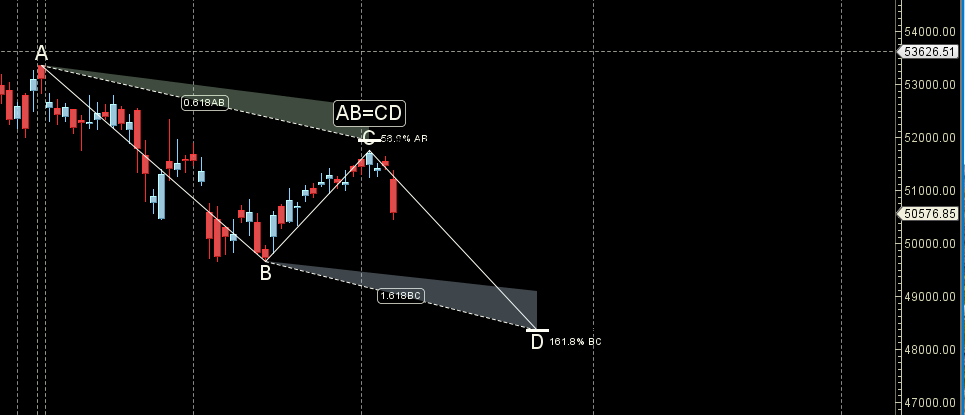
For example, a trader might apply Fibonacci time zones to a significant market high or low, then project forward to see if price movements align with key Fibonacci numbers. If the market reaches a Fibonacci retracement level, such as 38.2% or 61.8%, it may signal a potential bullish or bearish reversal.
This method is similar to wave theory, where traders analyze market cycles to predict the next Fibonacci retracement or price level.
At the heart of Fibonacci Cycles is the Golden Ratio (1.618), which is closely related to the Fibonacci sequence. The ratio of consecutive Fibonacci numbers converges to 1.618, a mathematical constant found throughout nature and in financial markets.
The Golden Ratio plays a role in Fibonacci retracements, which traders use to identify potential support and resistance levels. Key retracement levels—38.2%, 50%, and 61.8%—help traders determine entry and exit points within a market cycle.
For instance, if a stock moves upward and then pulls back to the 61.8% Fibonacci retracement level, traders may anticipate a bullish bounce, while a drop below this level could indicate further decline.