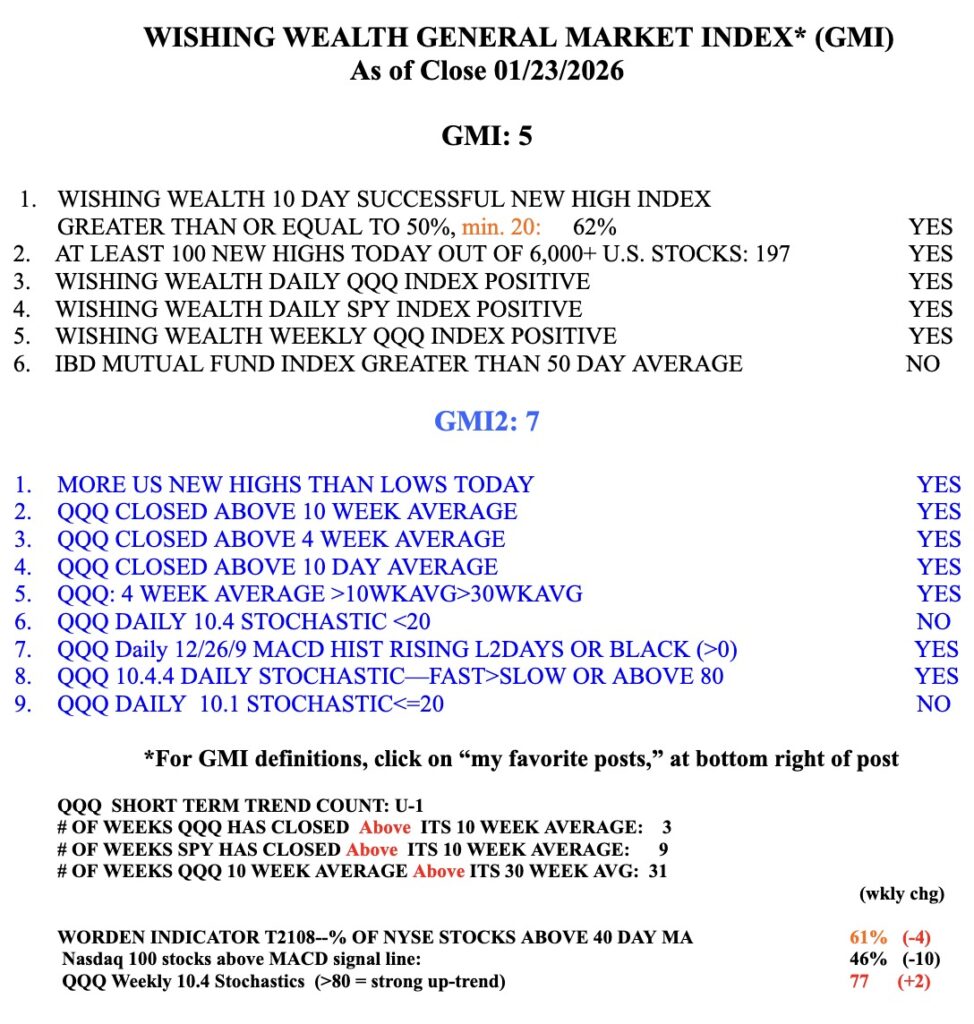
Blog Post: Day 1 of new $QQQ short term up-trend; GMI=5 (of 6), see GMI Table; Daily XAVG 5 is the indicator of rockets, see $SMCI in 2024 and $SLV in 2025 as examples.
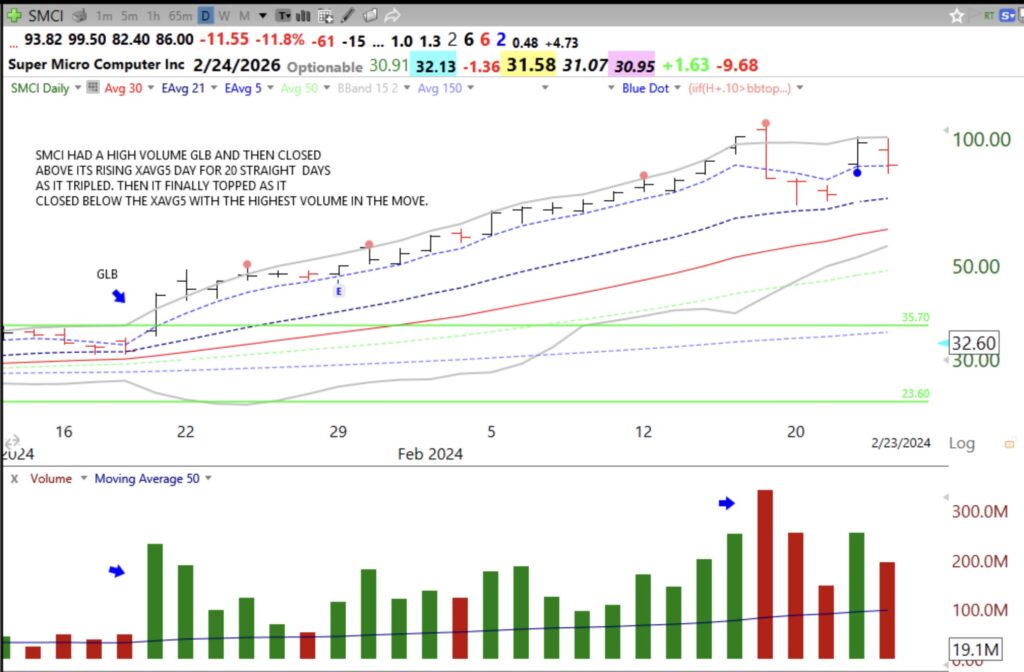
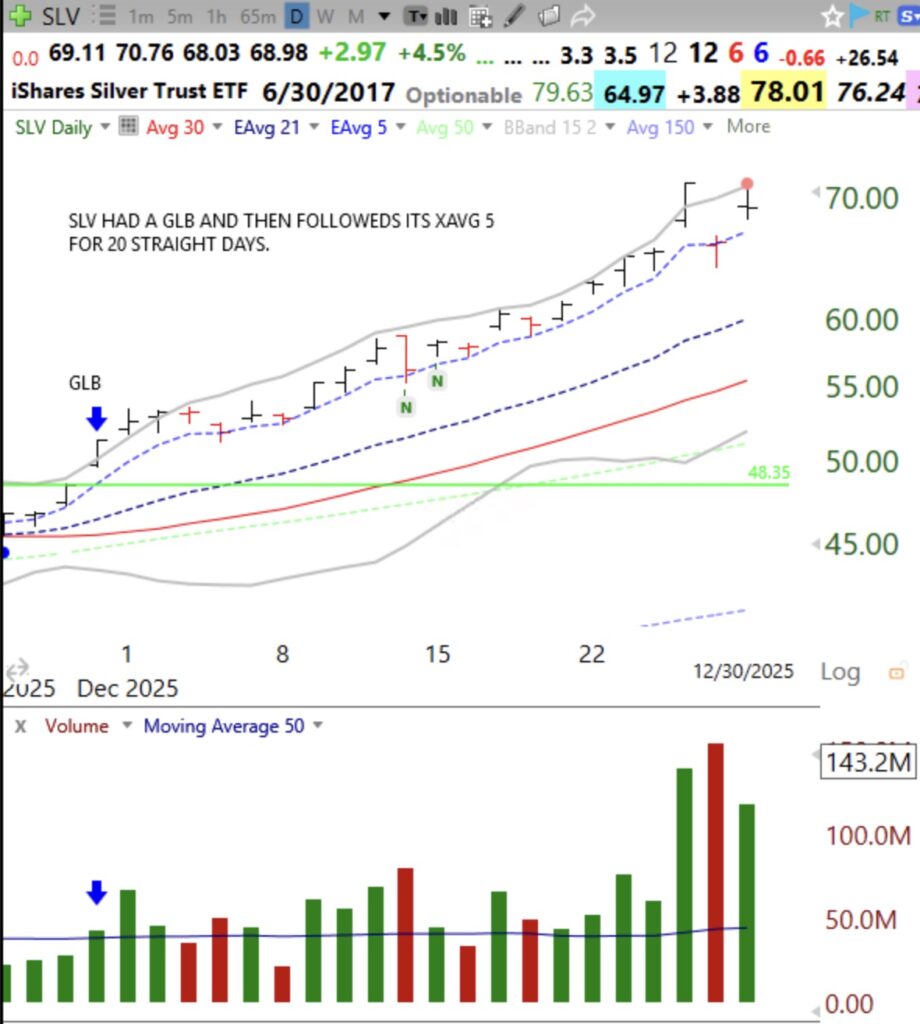
I have found that the 5 day exponential moving average, XAVG 5, is an excellent indicator of a climbing rocket. I I scan for stocks with a a recent GLB (green line break-out at an ATH) that are riding their XAVG 5 (purple dotted line) higher. Study these examples of SMCI and SLV and then examine how your other strong stocks have behaved with respect to this indicator. Question to ponder: Why do some stocks track a moving average so closely for long periods? Are there so many persons trading off of the same average?
The GMI is still GREEN.
Related
Source link