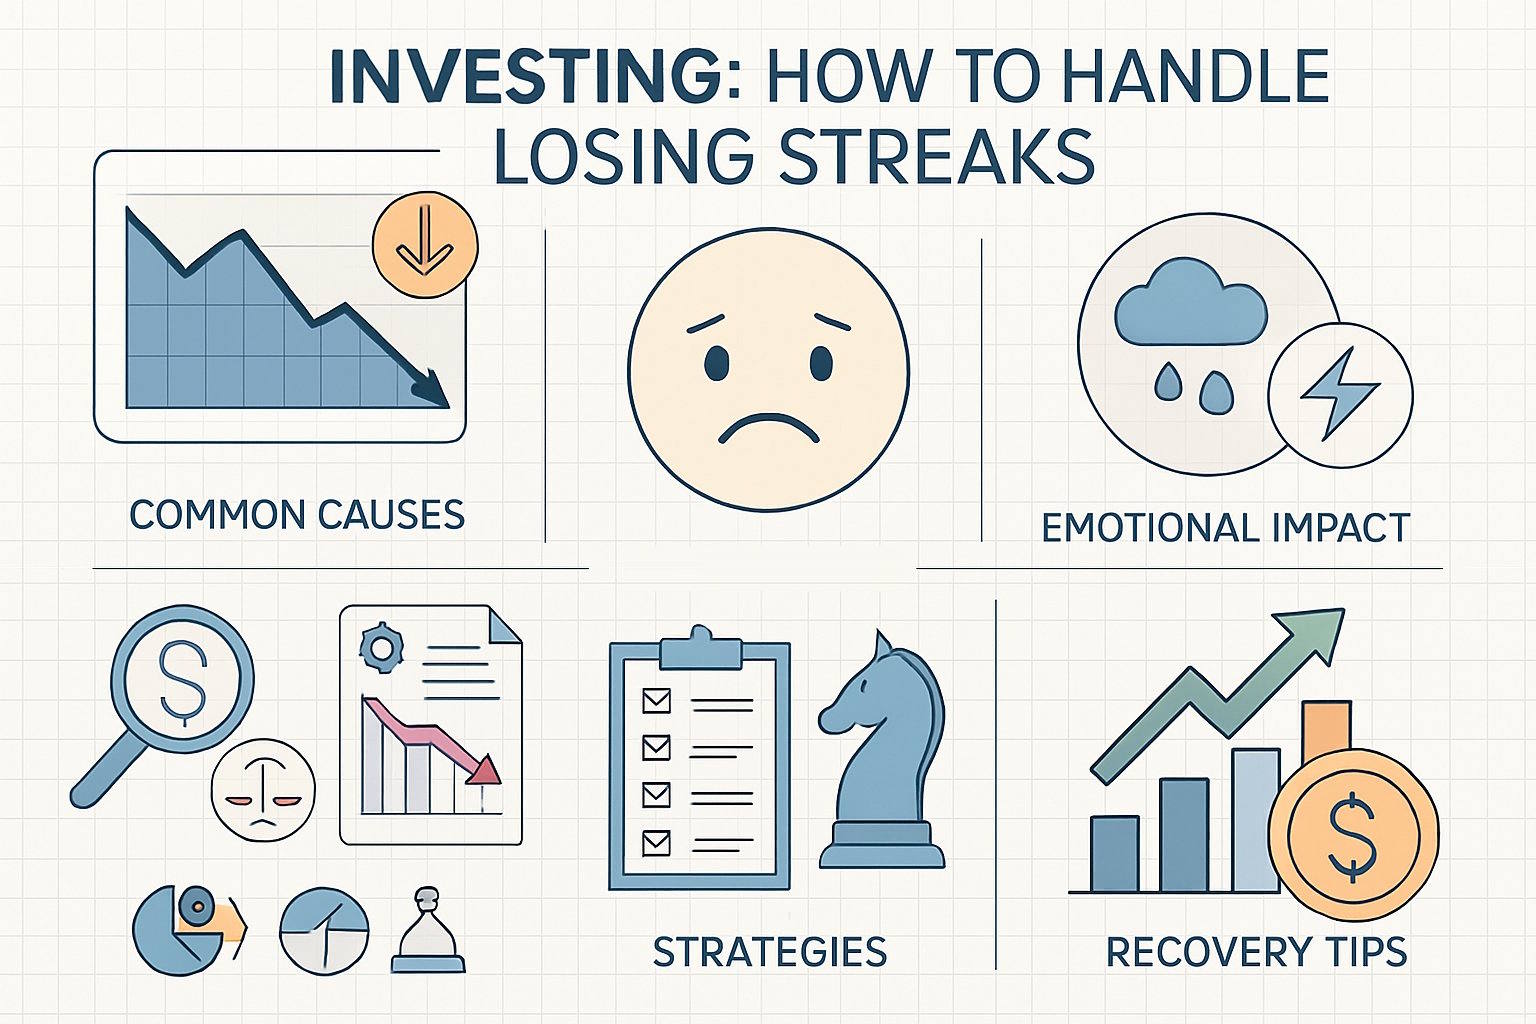
Trading Playbook: How To Handle Losing Streaks With Discipline
Losing streaks really push your discipline—maybe even more than your actual strategy. When trade after trade goes against you, it’s tempting to doubt your plan or try to chase losses just to “make it back.”
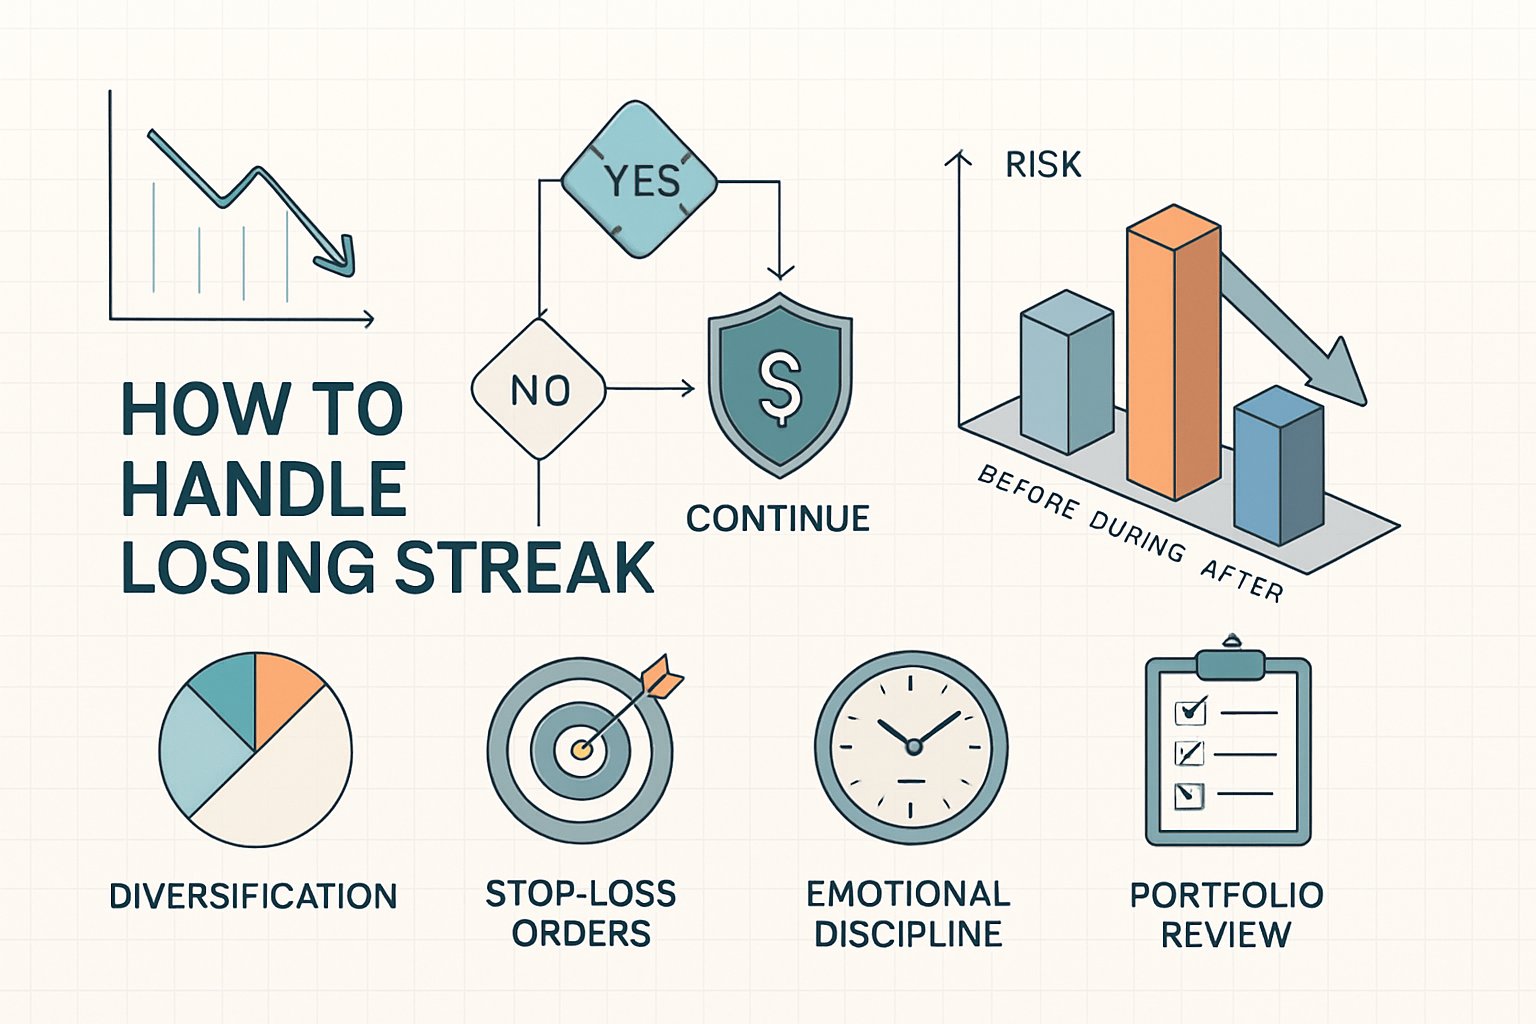
You’ll handle losing streaks best by managing risk, reviewing your process, and staying consistent rather than getting emotional.
Every investor hits drawdowns—it doesn’t matter if you’re trading stocks, forex, or crypto. What sets consistent performers apart is how they react when performance dips.
Tools like TradingView let you analyze setups objectively, identify recurring mistakes, and assess whether your strategy still aligns with the current market.
A losing streak doesn’t mean you’ve lost your edge. Usually, it means the market shifted, or your execution slipped. If you step back, tighten risk, and focus on data—not emotion—you can turn a setback into a learning phase that actually makes you stronger over the long haul.
Key Takeaways
- Losing streaks happen to everyone, but you need to manage risk and maintain steady discipline to get through them.
- Analyze your trades with a clear head to spot errors and adapt your plan.
- Use structured tools and real data to rebuild confidence and improve consistency.
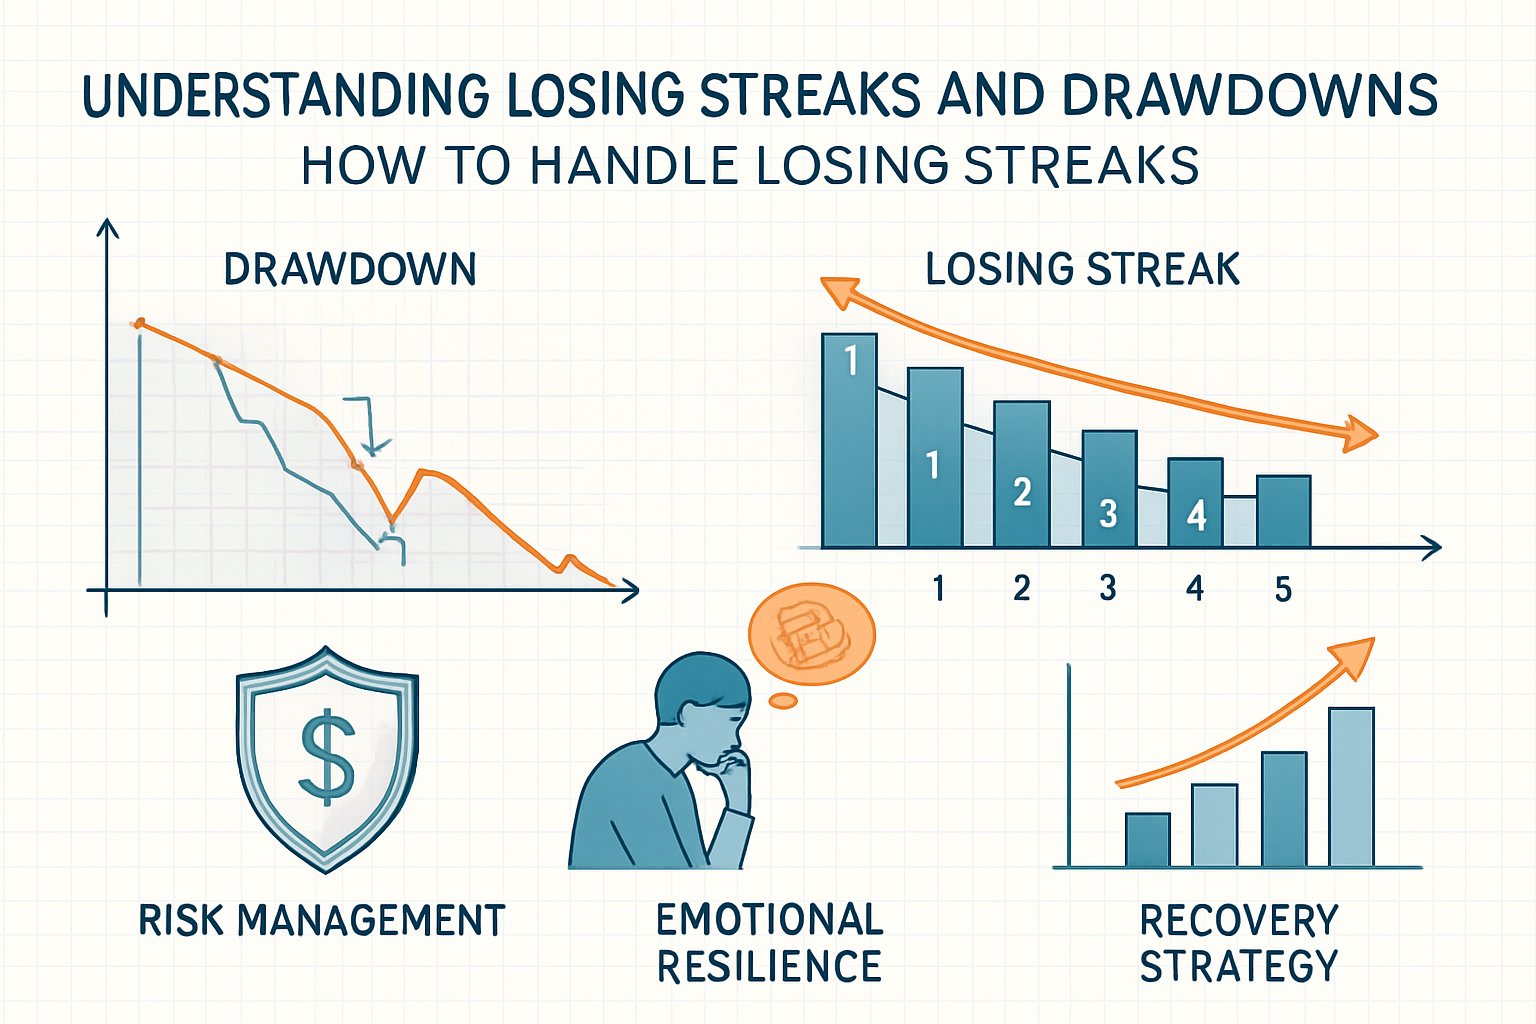
Understanding Losing Streaks and Drawdowns
Losing streaks challenge both your trading discipline and capital management skills. When you recognize their statistical nature, understand drawdowns, and notice how market conditions shift, you’re more likely to make data-driven decisions rather than act on emotion.
Statistical Reality of Losing Streaks
Losing streaks aren’t personal failures—they’re just probability at work. Even if your system wins 60% of the time, you’ll still hit several losses in a row sometimes.
The number of trades and your win rate determine how often you’ll face these streaks.
You can estimate streak length with a simple formula:
Expected maximum losing streak ≈ log(1–confidence level) ÷ log(win rate).
If your win rate is 55%, running into five straight losses is completely normal.
When you view losses as statistical variance, you maintain steadier confidence. Platforms like TradingView help you track metrics and visualize equity curves, so you can see if results are just random noise or if there’s a deeper problem with your system.
| Type | Tests the worst-case scenario | Key Use |
|---|---|---|
| Absolute Drawdown | Drop from initial deposit to lowest point | Evaluates risk to starting capital |
| Maximum Drawdown | Largest peak-to-trough loss | Tests worst-case scenario |
| Relative Drawdown | Percentage loss from equity peak | Compares risk across accounts |
Types of Drawdowns
Drawdowns track the drop from a portfolio’s peak to its next low. They show how much capital you lose before things turn around. Here’s a quick breakdown:
Watching these numbers helps you size positions and set stop levels. Active traders might tolerate a 10–15% drawdown, while long-term investors usually aim for less than 10%.
Stock Rover tracks drawdowns by sector or asset class, so you can see if losses come from the whole market or just certain holdings.
Market Regime Change
Sometimes, a losing streak means the market regime changed, not that you messed up execution. Volatility, liquidity, and trend direction can shift, making your once-profitable strategy suddenly ineffective.
You can spot regime changes by looking at volatility indexes, moving averages, or asset correlations. When patterns don’t hold up, cut your position size or pause trading until things settle.
Automated charting tools like TrendSpider scan for trend reversals or volatility spikes, so you get early warnings when conditions change. If you adapt fast to new regimes, you’ll avoid deeper drawdowns and better protect your capital.
Emotional Impact and Common Pitfalls
Losing streaks don’t just hurt financially—they hit your discipline and decision-making under pressure. You end up fighting emotional reactions that can distort your judgment and increase your risk if you’re not careful.
Emotional Trading Responses
Emotional trading kicks in when you let fear, frustration, or excitement drive your trades instead of data. Maybe you sell too soon after a dip or double down right after a win. Usually, it’s just loss aversion—losses sting more than gains feel good.
You might start watching prices nonstop, ditch your plan, or chase quick moves. All of that just adds to your costs and kills consistency.
To fight back, stick to structured checklists and use set entry and exit rules. Platforms like TrendSpider help automate alerts or backtest strategies, so you don’t have to rely on gut feelings in the moment.
Revenge Trading and Its Risks
Revenge trading happens when you try to “win back” losses by making bigger or riskier trades. Usually, anger or frustration after a losing streak triggers it. The problem? You end up tossing risk control out the window, and losses can pile up fast.
Say you lose five trades in a row and then double your next position. If that one fails, your drawdown gets worse, and digging out becomes even tougher.
To avoid this, set a daily or weekly loss limit—and actually stop trading when you hit it. Keep a trading journal to note triggers and your emotional state.
Recognizing Psychological Traps
Several psychological biases feed emotional trading. Recency bias leads you to overrate recent outcomes, and confirmation bias leads you to see only what supports your current view. Overconfidence can tempt you into risky trades after a few wins.
These traps warp your sense of probability and risk. Spot them early by tracking your win rate and average return per trade.
Use research tools like Stock Rover to base decisions on real fundamentals, not just your mood or headlines. When you rely on verified data, your trading decisions are more consistent and measurable.
Risk Management During Losing Streaks
You keep your trading capital safe by controlling position size, sticking to structured drawdown responses, and setting clear loss limits. Each step reduces the likelihood of emotional decision-making and prevents a temporary setback from becoming a significant loss.
Adjusting Position Sizing
When your account takes a hit, cut your trade size to protect what’s left. Smaller positions mean less exposure, so you can stay in the game without digging a deeper hole. Many traders reduce size by 25–50% after a losing streak until conditions stabilize.
Try risking no more than 1% of your total equity per trade. That way, even during wild markets, each loss stays manageable. Don’t fall for the urge to increase trade size to “win back” losses—it usually just makes drawdowns worse.
Track your position sizing in TrendSpider—it’ll help you visualize risk-reward and automate adjustments. Check your trade logs every week to make sure your average loss per trade stays inside your comfort zone.
Implementing Drawdown Protocols
A drawdown protocol outlines what to do when your account declines by a specified percentage. For example, if your account falls 10% from its peak, you might pause trading for 48 hours. That break helps you avoid emotional trades and gives you time to review.
Try a tiered approach:
- 5% decline: cut your position size in half.
- 10% decline: stop trading for a bit.
- 15% decline: reassess your strategy and the market.
Write these rules into your trading plan and stick to them. TradingView can alert you when you cross a drawdown threshold. Treat those alerts as non-negotiable—don’t just ignore them. Consistency here is what keeps your capital safe.
Setting Loss Limits
Set both daily and cumulative loss caps to avoid overexposure. A solid rule: stop trading for the day if you lose 2–3% of your account equity. That way, one bad day won’t wipe out weeks of progress.
Track your stats and notice when your strategy’s losses go past their usual range. If things look off, pause and review your setups before jumping back in.
Use hard stops alongside tools like Trade Ideas to monitor live performance and avoid impulsive trades. When you hit your limits, step away—discipline in tough times is what really sets consistent traders apart.
Reviewing and Adapting Your Trading Plan
You’ll improve your results by reviewing execution, assessing how markets have shifted, and adjusting your strategy to reflect new data. Each of these helps you spot errors, measure performance, and ensure your trading plan aligns with what’s actually happening.
Assessing Trade Execution
Start by comparing your actual trades with your trading plan. Did you enter and exit where you meant to? Did you respect your risk limits and position sizing? Missed stops or impulsive trades usually mean emotions got in the way—not that the system failed.
Keep a trade log with details such as entry price, exit price, risk per trade, and the reason for entry. A table helps you spot what keeps going wrong:
| Metric | Target | Actual | Notes |
|---|---|---|---|
| Risk per trade | 1% | 1.5% | Too high |
| Entry timing | Within setup window | Late | Missed signal |
Look over your execution every week. If you keep drifting from your plan, tighten your process before blaming your strategy. TrendSpider can automate chart analysis so you can focus on following your rules rather than chasing price moves.
Identifying Market Changes
A solid trading plan can still underperform if the market regime changes. Volatility, liquidity, and correlations shift over time. For example, a trend-following strategy that worked in a hot market might stall out in a choppy one.
Compare your recent results with historical averages. If your win rate or profit factor declines and it’s not due to execution errors, the market has probably changed. Use tools such as Average True Range (ATR) or volatility indexes to identify shifts between calm and volatile phases.
Check macro data or sector rotation trends to confirm. Platforms like MetaStock or Benzinga Pro offer real-time news that can indicate whether external events are driving the change. Adjust your position sizes or trade less frequently until conditions stabilize.
Refining Your Strategy
If you’re sure both execution and market conditions have changed, tweak your strategy parameters. Focus on concrete changes—entry filters, stop distances, or position size—rather than rewriting everything.
Backtest your tweaks using historical data to determine whether they improve performance. Don’t overfit; a tiny gain in one dataset can disappear in real trading. Stay mechanical and test-driven.
Write down every change in your plan, along with why you made it and what you expect to happen. Check results after 20–30 trades to see if it’s working. For deeper analysis, use Trade Ideas to test new setups or scan for patterns that match your updated criteria.
Practical Recovery and Resilience Strategies
You’ll recover faster by managing stress, focusing on real data, and connecting with experienced peers. Each step helps you rebuild confidence, sharpen your trading process, and maintain discipline when following a drawdown protocol.
Taking Constructive Breaks
A losing streak really messes with your judgment and makes you more likely to take dumb risks. Taking structured breaks gives you a chance to reset and avoid emotional trading.
Step away for a set period—maybe a day or two. You need to regain your objectivity.
Don’t jump right back in; wait until you can evaluate trades based on data, not just frustration or the urge to win it back.
While you’re on a break, check your environment and daily habits. Sleep, nutrition, and exercise all affect your reaction time and focus, probably more than you think.
Here’s a quick checklist:
- Sleep: Aim for at least 7–8 hours
- Screen time: Stick to non-trading research
- Physical reset: Get up and walk or stretch every few hours
If you use TrendSpider, set alerts to automatically monitor setups while you recharge. That way, you’re not glued to your screen all day.
Come back only when you’re truly ready to follow your trading plan—no emotional shortcuts.
Journaling and Data Review
A trading journal turns your gut feelings into actual data you can use. Record every trade: entry, exit, your reasoning, and even your mood.
Over time, you’ll start to see if losses come from the market itself or from your own mistakes.
Do your review weekly. Keep it simple—a table like this works:
| Metric | Target | Actual | Notes |
|---|---|---|---|
| Win rate | 55% | 48% | Overtrading on volatile days |
| Risk/reward | 1:2 | 1:1.5 | Stops too tight |
| Emotional triggers | — | — | Reacting to early losses |
Tools like Stock Rover let you analyze portfolio drawdowns and see your sector exposure.
Compare your results to benchmarks. If you’re disciplined but still losing, it may be time to tweak your strategy settings—not your whole mindset.
Seeking Peer Feedback
Objective feedback accelerates your recovery. Talk about your trades with peers or mentors who actually get your approach.
Use structured reviews. Focus on the quality of your decisions, not just profit or loss.
Ask for specifics: Did you size your positions right? Did you stick to your drawdown rules?
Join trading communities or forums where people actually show their results. Stay away from echo chambers—opinions aren’t evidence.
If you’re using TradingView, share annotated charts privately for technical feedback on your entry and exit points.
Peer review helps you spot blind spots and keeps you accountable. Try just one actionable improvement per session instead of changing everything at once.
FAQs
Consecutive losses really test your discipline, planning, and risk management. You can limit long-term damage by controlling emotions, adjusting position sizes, reviewing your allocations, and sticking to risk controls.
How can you manage emotions during a series of investment losses?
Track what sets you off emotionally and avoid trading on impulse. If you’re frustrated, just step away from the screens.
Use a written trading plan to separate your decisions from your stress. Journaling trades helps you spot patterns.
If you’re an active trader, use TradingView to review past setups and see if losses came from your own mistakes or just normal market swings.
What strategies should you employ to mitigate the impact of a losing streak in your portfolio?
Cut your exposure—reduce position sizes or move into lower-volatility assets. Hold off on new trades until you’ve reviewed recent performance.
Focus on protecting your capital instead of trying to win everything back at once.
If your drawdowns go past your preset limit, rebalance into cash or defensive sectors.
Are there any risk management techniques to apply during frequent trading losses?
Stick to strict position sizing—risk just 1–2% of your capital per trade. Use trailing stops to lock in some gains. Scale back leverage until you’re consistent again.
How does diversification play a role in handling a run of poor investment performance?
Diversify across asset classes, sectors, and regions. That way, you’re less likely to get burned by one bad move.
Don’t overconcentrate in correlated positions. During downturns, uncorrelated assets such as bonds and commodities can smooth returns.
Rebalance every quarter to keep your target weights and control risk drift.
Source link