Buffer ETFs Explained: How Defined Outcome ETFs Protect Your Portfolio
Buffer ETFs are exchange-traded funds that provide downside protection against a certain percentage of losses.
The tradeoff is that there is an upside cap on the gains as well.
They are also known as Defined Outcome ETFs.
Note that we say “buffer” against downside losses.
We didn’t say “cap” the downside loss.
We will get into the nitty-gritty details later.
First, let’s understand the problem they are designed to solve:
- Avoiding the drawdown that can occur with buy-and-hold
- Enables the cautious investor to gain some market exposure, even if they believe equities are overvalued and vulnerable to a downturn (for example, the AI bubble bursting).
In this guide, I’ll show you exactly how buffer ETFs work, who should (and shouldn’t) use them, and how to choose the right one for your situation.
Contents
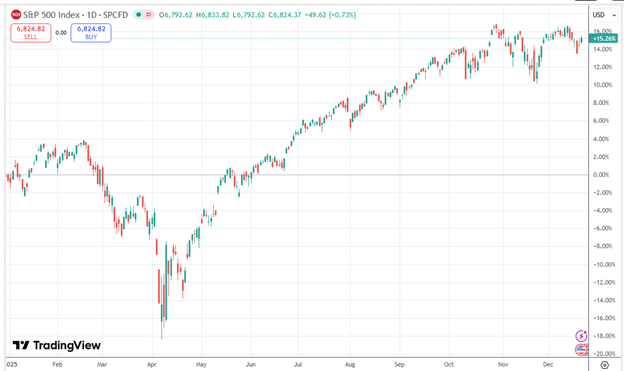
The problem with a buy-and-hold approach to the S&P 500 is that investors have to ride out a lot of volatility.
A person starting with $100,000 in the S&P 500 index fund on January 1st, 2025, would have seen that balance drop to $82,000 at some point – losing $18,000 in less than four months.
This chart of SPX over the course of the year 2025 may look fine now in hindsight…
But a retiree may not be fine with the April low, seeing an 18% drawdown on their savings and not knowing whether it will continue to go lower.
This 18% drawdown is the drawdown of the balance from January 1st.
The peak-to-trough drawdown from mid-February to April is 20%.
Even for short-term traders used to taking on risk, a 20% drawdown is typically at the edge of their risk parameters.
Because they know they now need a 25% gain to get back to breakeven.
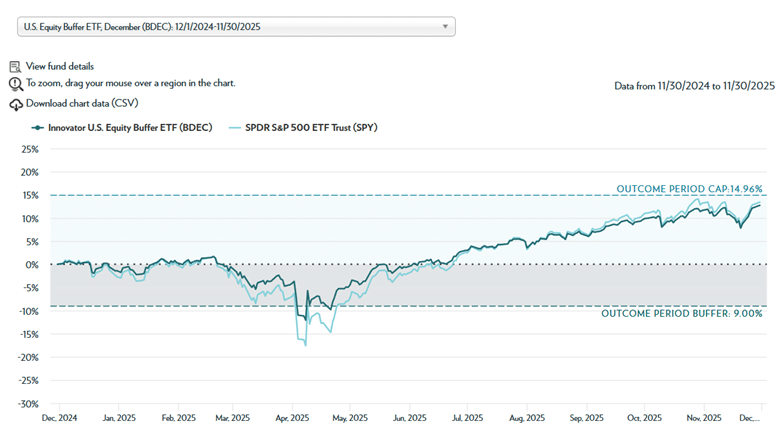
For example, the ticker BDEC is the Innovator U.S. Equity Buffer ETF, designed with a 9% downside buffer and an upside cap of about 17.4%.
The chart below shows the equity curve of BDEC (dark blue line) overlaid with the S&P 500 SPY (light blue line)
Source: InnovatorETFs.com
The chart spans December 1st, 2024, to November 30, 2025, because that is the “outcome period” for this BDEC fund.
This ETF has a one-year outcome period, with a reset on December 1st.
In this case, an investor holding the fund on December 1st, 2024, would have made a 12.73% return on November 30, 2025 – almost matching SPY’s 13.41% return.
The first thing that you will note is that it somewhat tracks the underlying asset SPY.
This is not surprising because the ETF’s “reference asset” is SPY.
Another thing you will note is that during the April 2025 low, the equity curve actually dipped below 9%.
This can happen and is permissible.
Because achieving the defined outcome requires investing at the start of the outcome period and holding through to the end.
Therefore, it is possible to have drawdowns of greater than 9% between the start and end of the outcome period.
It says so on the ETF’s factsheet:
“The outcomes that the Fund seeks to provide may only be realized if you are holding shares on the first day of the Outcome Period and continue to hold them on the last day of the Outcome Period, approximately one year. There is no guarantee that the Outcomes for an Outcome Period will be realized or that the Fund will achieve its investment objective.”
Oh, and by the way, there is no guarantee either.
There are very few guarantees in investing (except for taxes).
It is possible (but highly unlikely) for the fund to have a 91% loss instead of a 9% loss.
This is not a typo because the factsheet shows this visually under the “very negative scenario”.
The 9% buffer only means that the fund will buffer the first 9% of SPY’s losses.
If SPY loses more than 9%, the fund will lose point-for-point with SPY.
Here’s exactly how the 9% buffer works in practice:
If SPY is down 5% at the outcome period end:
- BDEC is at 0% (breakeven)
- The 5% loss was completely buffered
If SPY is down 20% at the outcome period end:
- BDEC is down 11%
- The first 9% was buffered, but you take the remaining 11% point-for-point
If SPY is down 100% (catastrophic scenario):
- BDEC is down 91%
- The buffer only absorbs the first 9%
On the upside:
If SPY is up 10%:
- BDEC is up 10%
- Haven’t hit the cap yet
If SPY is up 20%:
- BDEC is capped at 17.4%
- You miss the additional 2.6% gain
Now that you understand how the buffer percentage works, some investors may find that a 9% buffer is not enough.
The ticker PAUG is the U.S. Equity Power Buffer ETF, which has a 15% buffer over a one-year outcome period from August 1st to July 31 of the following year.
The cost of this extra buffer is that its upside cap is lower at 12%, instead of BDEC’s 17%.
But even PAUG wouldn’t fully cover the 30% drawdown during COVID-2020 (assuming the market did not recover by the end of the outcome period).
But at least it would have buffered about 15% of the loss, leaving the PAUG investor down only 15% instead of 30%.
For those investors who want a 100% buffer, meaning that they don’t want any loss at the end of the outcome period, then there is “ZMAY” – the Innovator Equity Defined Protection ETF.
Its upside cap is around 7%, which is slightly better than risk-free U.S. Treasuries.
The 100% buffer excludes fees and expenses.
The expense ratio of the ZMAY fund is 0.79%, slightly higher due to increased management of FLEX Options.
There are funds with outcome periods that start on any month you like.
The USEP is a 30% buffer ETF that starts in September, for example.
If you like a buffered ETF with 100% protection that starts on January 1st, then ZJAN is an example.
You may have guessed that the last three letters of the fund’s ticker symbol might represent the month series of the outcome period.
Somewhat true, unless that symbol is already taken by another stock.
There are funds with different outcome period lengths (3 months, 6 months, etc.).
There are also buffered ETFs (such as EAPR) for emerging markets.
It uses the emerging markets ETF (EEM) as the underlying asset.
NNOV uses QQQ as the reference asset, tracking the Nasdaq 100.
And KJUN uses IWM for U.S. small caps exposure.
ETF issuer First Trust offers BGLD, a 10% buffered ETF on gold.
The buffer ETFs use FLEX Options behind the scenes.
FLEX options are customizable exchange-traded options that allow institutional products to have more customizable and precise strike prices and expiration dates.
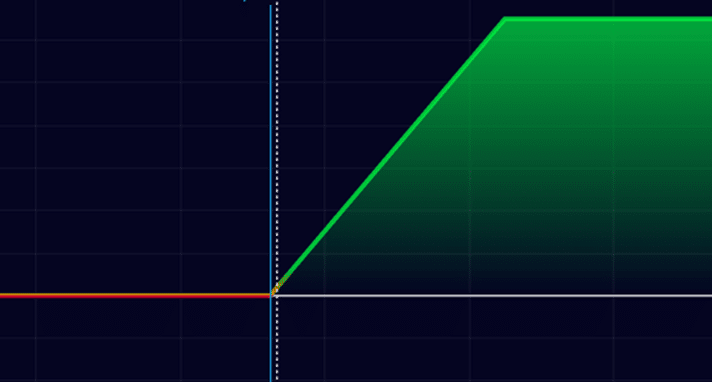
The 100% buffer fund is structured similarly to an option collar, with upside and downside caps, resulting in a payoff graph like this…
An option collar consists of long stock plus a put option to protect downside risk, and then sells a call option to help finance the cost of the put option.
The sale of call options caps upside potential.
These funds may use synthetic options composition (such as a short put plus a long call at the same strike) instead of actually buying stock.
Or they may use a very deep in-the-money call option as an approximation to long stock.
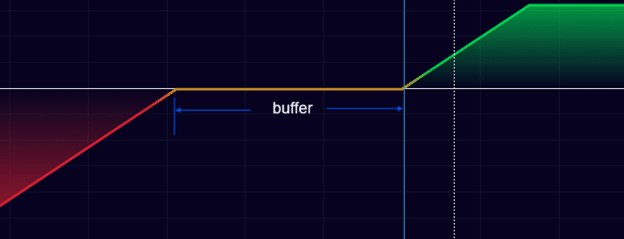
The 30%, 15%, 9% buffered ETFs use a put debit spread for protection instead of a long put option.
The put debit spread is less expensive than a long put, so these buffered ETFs can achieve higher returns with higher upside caps.
The put debit spread is not 100% protection; therefore, these non-100% buffered ETFs have a payoff graph that looks like this:
See how it can have losses beyond the buffer amount.
Buffer ETFs aren’t for everyone.
Here’s who benefits most:
1. Retirees and Conservative Investors
If you’re living off your portfolio and can’t stomach 20-30% drawdowns, buffer ETFs provide peace of mind. The psychological benefit of sleeping at night may be worth the capped upside.
2. Late-Cycle Market Participants
When you believe markets are overvalued but don’t want to sit in cash, buffer ETFs let you participate with guardrails. If the market continues up, you capture 10-17%. If it crashes, you’re protected from the first 9-30%.
3. Tax-Deferred Account Holders
In IRAs and 401(k)s, where you can’t sell options for income, buffer ETFs provide options-like protection without needing options approval.
4. Investors Who Panic-Sell During Drawdowns
If you historically sell at bottoms out of fear, buffer ETFs might keep you invested. The defined protection prevents emotional decision-making.
5. Asset Allocators Seeking Diversification
As one component of a diversified portfolio, buffer ETFs can reduce overall volatility while maintaining equity exposure.
1. Long-Term Buy-and-Hold Investors
If you have a 20-30 year time horizon and can tolerate volatility, traditional index funds will outperform. The compounding effect of avoiding the upside caps matters enormously over decades.
2. Aggressive Growth Seekers
If you’re trying to maximize returns and can handle volatility, the upside caps are a dealbreaker. You’re giving up 50%+ of gains in strong bull markets.
3. Active Traders
Buffer ETFs are designed for holding the full outcome period. If you’re trading in and out, you lose the defined outcome benefit and pay higher expense ratios for nothing.
4. Low-Cost Index Investors
Expense ratios of 0.79% vs 0.03% for VOO add up. If you don’t need the protection, why pay for it?
5. Investors Who Can Use Options Directly
If you’re comfortable selling covered calls and buying protective puts yourself, you can create similar (or better) payoff profiles with more control and potentially lower costs.
Understanding when buffer ETFs shine versus when they lag helps with allocation decisions.
Buffer ETFs Outperform In:
Moderate Bear Markets (-10% to -30%). This is their sweet spot. If the market drops 20%, you’re only down 11% (with a 9% buffer). Traditional investors are panicking; you’re relatively calm.
Choppy, Volatile Markets When markets whipsaw without clear direction, the downside protection prevents the steep drawdowns while you still capture modest gains on up moves.
Late-Cycle Markets When valuations are high and everyone’s nervous, buffer ETFs let you stay exposed without unlimited downside risk.
High Interest Rate Environments When Treasury yields are 4-5%, the 7-12% capped return from buffer ETFs looks more attractive relative to risk-free rates.
Buffer ETFs Underperform In:
Strong Bull Markets If SPY rallies 25%, you’re capped at 12-17%. You’ve missed 8-13% of gains. Over multiple years of bull markets, this compounds into significant underperformance.
Severe Market Crashes (-40%+) The buffer helps, but doesn’t eliminate pain. With a 9% buffer and a 40% crash, you’re still down 31%. At that point, you wish you had more protection.
Quick V-Shaped Recoveries If the market crashes and immediately recovers within the outcome period, you may end up near breakeven, while traditional investors fully recovered and made money.
Multi-Year Holding Periods Expense ratios (0.79% vs 0.03%) compound over time. The cost drag matters more in long holding periods.
Buffer ETFs solve real problems for specific investor types – particularly retirees and conservative investors who need equity exposure but can’t stomach unlimited downside risk.
They make sense when:
✓ You need equity exposure, but fear crashes
✓ You’re in a tax-deferred account without options access
✓ You historically panic-sell during drawdowns
✓ You’re late in the market cycle and want protection
✓ You don’t have the time or knowledge to use options protection strategies yourself
They don’t make sense when:
✓ You have a long time horizon (20+ years)
✓ You can tolerate volatility for higher returns
✓ You’re comfortable using options for hedging
✓ You want to minimize costs
There are hundreds of defined outcome ETFs to choose from.
Select based on:
- Reference asset (SPY, QQQ, IWM, etc.)
- Buffer amount (9%, 15%, 30%, 100%)
- Outcome period length (3, 6, 12 months)
- Starting month of outcome period
- ETF issuer and expense ratio
Remember: these products are tools, not magic.
Understand exactly what you’re buying and whether the tradeoffs make sense for your situation.
Q: What happens if I buy a buffer ETF mid-outcome period?
The buffer and cap no longer apply to you. You’re buying at a different price point than the outcome period start, so the defined outcome is based on the original starting price, not your entry price. For maximum benefit, only buy at the start of an outcome period. If you want exposure mid-period, wait for the next monthly reset.
Q: Are buffer ETFs better than just buying protective puts?
It depends. If you can trade options yourself, you have more flexibility and potentially lower costs. But buffer ETFs work in IRA accounts where options aren’t allowed, require no ongoing management, and automatically reset annually. For option-savvy investors, creating your own collar may be superior. For hands-off investors, buffer ETFs are simpler.
Q: What are the tax implications compared to regular index funds?
Buffer ETFs are taxed the same as regular ETFs for capital gains. However, the internal FLEX options create the potential for higher short-term capital gains distributions than buy-and-hold index funds. Hold in tax-deferred accounts (IRA, 401k) to avoid this issue. Consult a tax professional for your specific situation.
Q: Can I lose more than the buffer percentage?
Yes. The buffer only absorbs the first X%. If the reference asset (like SPY) drops more than the buffer amount, you take losses point-for-point beyond that. A 9% buffer with a 30% crash means you’re down 21%. There’s no hard cap on losses – that’s a critical distinction many investors miss.
Q: How do expense ratios affect returns?
Buffer ETFs charge 0.69-0.95% vs 0.03-0.04% for traditional index ETFs. That’s 0.65-0.90% annual drag. Over 10 years, these compounds have resulted in ~6-9% less wealth. The protection is worth it if you actually need it, but expensive if you don’t. Run the math for your time horizon.
Q: What if the market crashes 50% like in 2008?
A 9% buffer helps, but doesn’t eliminate pain. You’d be down 41% instead of 50% – meaningful but not life-changing. A 30% buffer brings you to 20% down. Only 100% buffer ETFs completely protect you, but they cap upside at 7-8%. There’s no free lunch – more protection = less upside.
Q: Should I use buffer ETFs for my entire portfolio?
No. Even proponents recommend buffer ETFs as one component of diversified portfolios, typically accounting for 20-40% of the equity allocation. The upside caps make them unsuitable as 100% of holdings for most investors. Consider them as a volatility-dampening sleeve within a broader portfolio strategy.
Q: How do buffer ETFs compare to annuities with downside protection?
Buffer ETFs are generally superior to structured annuities for several reasons: (1) Lower fees, (2) Daily liquidity, (3) Transparency, (4) No surrender charges. Annuities lock you in for years with penalties for early withdrawal. Buffer ETFs trade like stocks – you can exit anytime (though you lose the defined outcome if you exit mid-period).
Buffer ETFs use options strategies under the hood. If you want to understand how to create similar protection using collars, protective puts, or other hedging techniques:
Options Income Mastery: Learn how to use options for both income generation and portfolio protection ($397)
The Accelerator Program: Advanced training covering hedging strategies, portfolio management, and systematic approaches ($997)
Trade safe!
Disclaimer: The information above is for educational purposes only and should not be treated as investment advice. The strategy presented would not be suitable for investors who are not familiar with exchange traded options. Any readers interested in this strategy should do their own research and seek advice from a licensed financial adviser.
Source link