Stock Research: Moat Analysis With Porter’s Five Forces
By applying Porter’s Five Forces, you can actually measure how tough a company’s competitive edge is, and whether it can keep rivals, suppliers, and substitutes from eating into its returns.
This approach turns that fuzzy idea of “competitive advantage” into a clear checklist you can use before pulling the trigger on a stock.
You don’t have to guess. Porter’s model lets you test how easily new competitors might enter, how much power suppliers and customers really have, and how likely it is that substitutes could replace a company’s product.
A strong moat doesn’t guarantee you’ll get huge returns, but it does signal durability. Using the Five Forces helps you spot that kind of staying power early—sometimes before the market fully wakes up to it.
Key Takeaways
- Use Porter’s Five Forces to evaluate a company’s ability to sustain profits.
- Assess how competition, suppliers, and buyers shape long-term value.
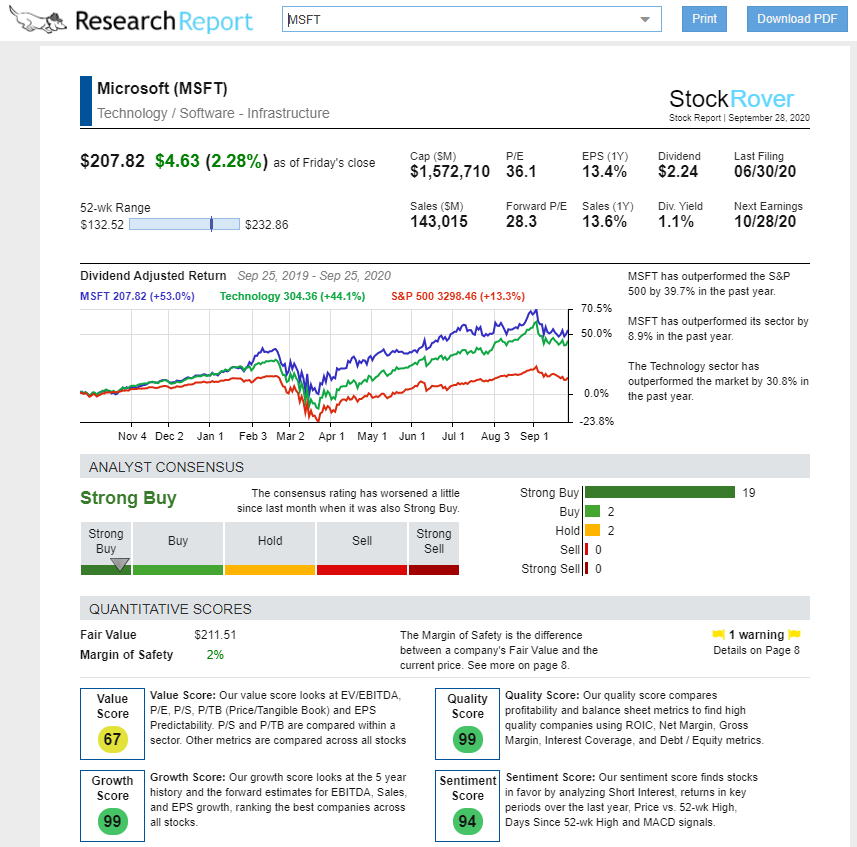
- Combine structured analysis with tools like Stock Rover for deeper insight.
Moat Analysis Fundamentals
You size up a company’s long-term strength by looking at how well it keeps profits away from competitors. That means understanding how durable its advantages are, how those advantages impact stock selection, and how the industry itself shapes profitability.
An economic moat means a company can sustain profits and hold market share over time, even as rivals snap at its heels. You can spot a moat through factors such as brand strength, switching costs, cost advantages, network effects, and regulatory barriers.
Companies with wide moats usually post higher returns on invested capital (ROIC) than their competitors. For example, if a firm posts a 15% ROIC in an industry where most only hit 8%, you’re probably looking at a real edge.
Here’s a quick checklist you can use:
| Factor | Example | Impact on Profitability |
|---|---|---|
| Brand | Coca-Cola | Price premium |
| Switching Cost | Adobe Creative Cloud | Customer retention |
| Network Effect | Visa | Scale advantage |
| Cost Advantage | Walmart | Margin stability |
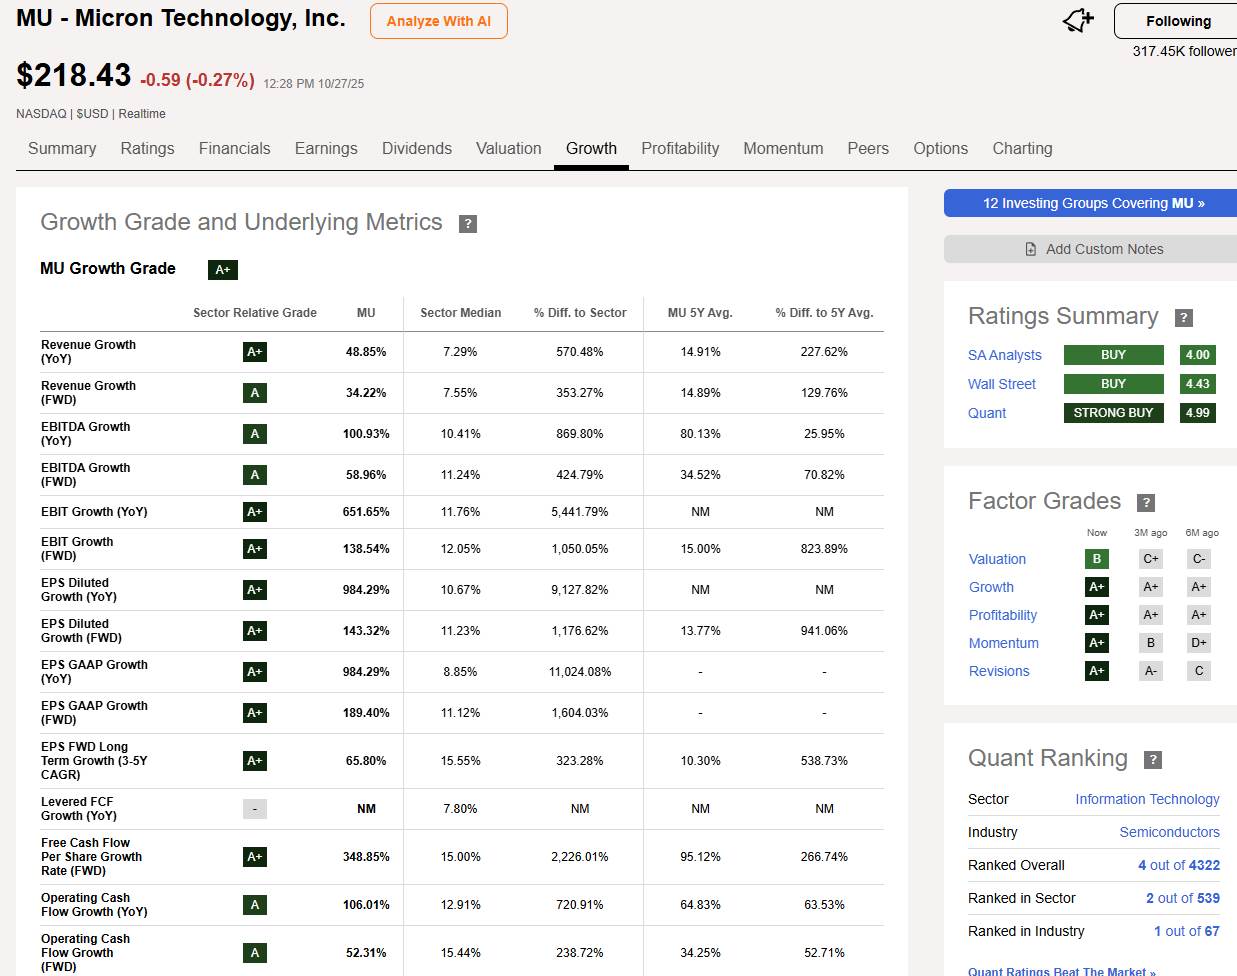
Tools like Stock Rover (below) let you compare ROIC, margins, and free cash flow trends to see if a moat is actually holding up before you invest.
Competitive Advantages in Stock Selection
When you’re picking stocks, focus on competitive advantages that last through market cycles. A strong moat smooths out earnings volatility and supports steady dividend growth.
Test whether a company’s edge is sustainable, not just a blip in the numbers.
Dig into intangible assets (like patents or brand equity), cost structures, and customer relationships. Companies that keep investing in innovation and hold pricing power usually do better than those that just slash costs for a quick win.
Use Seeking Alpha for peer comparisons and analyst commentary to see whether the market already recognizes the moat. If the stock trades at only a modest premium versus its moat quality, there could still be room for upside.
Role of Industry Profitability
You can’t judge a company’s moat without looking at industry profitability. Even the best-run firm struggles in a structurally weak sector.
Apply Porter’s Five Forces to see how power shifts between suppliers, buyers, substitutes, new entrants, and existing rivals.
Industries with high entry barriers and few substitutes tend to offer wider moats. For example, regulated utilities rarely face new entrants, so returns stay steady.
You can visualize these patterns with TradingView by comparing sector performance indices and profit margins over time. This helps you figure out if a company’s moat is enough to offset industry pressure—or if the whole sector just isn’t worth it.
Understanding Porter’s Five Forces
You use Porter’s Five Forces to see how competition, suppliers, buyers, substitutes, and new entrants shape industry profitability. This framework helps you spot where a company’s moat is solid or weak, and it guides your stock research toward companies with durable advantages.
Overview of Porter’s Framework
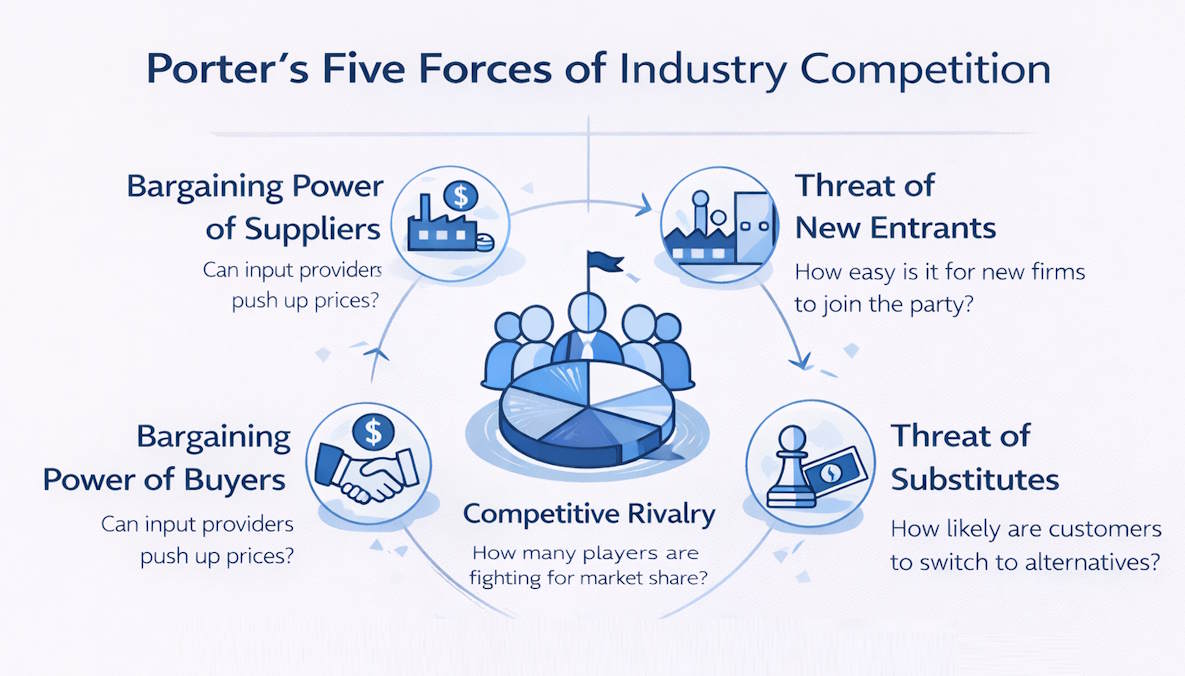
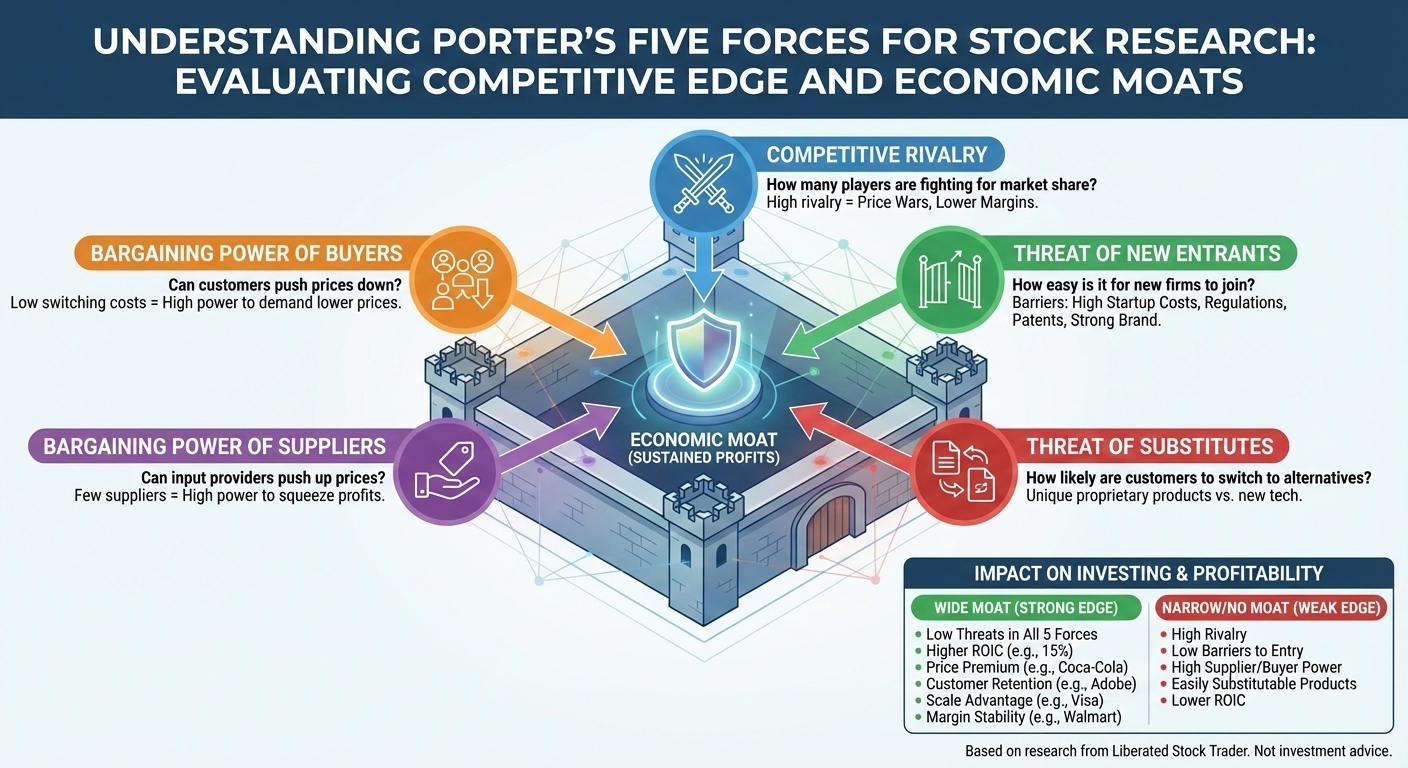
Michael Porter’s model lays out five structural factors for industry competition:
- Competitive Rivalry – How many players are fighting for market share?
- Threat of New Entrants – How easy is it for new firms to join the party?
- Bargaining Power of Suppliers – Can input providers push up prices?
- Bargaining Power of Buyers – Can customers push prices down?
- Threat of Substitutes – How likely are customers to switch to alternatives?
You can use these forces to compare sectors. For example, consumer staples usually have less rivalry and substitution risk than tech, where innovation moves fast. If multiple forces look weak, you’re probably seeing a wider moat.
When you’re screening stocks, tools like Stock Rover help you connect qualitative forces with hard numbers, such as gross margin trends and supplier concentration. That way, you ground your moat analysis in real outcomes.
Who Is Michael E. Porter?
Michael E. Porter, a Harvard Business School professor, introduced the Five Forces in 1979 to explain why some industries deliver better returns. He pointed out that competition isn’t just about direct rivals—it’s also about suppliers, buyers, and substitutes.
Porter’s work shifted the strategy from focusing only on internal strengths to one that emphasized external structure. He showed that profitability depends on how well a firm positions itself within its industry’s competitive landscape.
Later, he added concepts such as the value chain and competitive advantage, which show how companies can outperform competitors by controlling costs or differentiating their products. Investors use his ideas to analyze not just what a company does, but how it keeps its edge over time.
Value Chain and Competitive Positioning
The value chain maps out every activity that adds value—from sourcing to sales—and lets you see where a firm earns or loses margin. Porter linked this chain to the Five Forces by showing that control over key stages can reduce exposure to supplier or buyer pressure.
Take a semiconductor company that designs and makes its own chips. By integrating, it cuts out some supplier risk. That kind of setup often hints at a defensible moat.
You can test the strength of the value chain using financial ratios, cost breakdowns, and peer comparisons. Platforms like TradingView let you watch how vertically integrated firms react to supply shocks or price swings in real time.
When you’re sizing up a company’s competitive position, look at where it sits in the chain, how unique its capabilities are, and whether those strengths hold up as the market shifts.
Threat of New Entrants and Barriers to Entry
You feel competitive pressure when new firms can easily enter your industry. The strength of these barriers to entry shapes how stable profits stay and how much pricing power existing players really have.
Identifying Barriers to Entry
Barriers to entry show how tough it is for new competitors to challenge established companies. High capital requirements, strong brand loyalty, and regulatory constraints keep new entrants out. When barriers are low—such as low startup costs or easy access to suppliers—new players can jump in and squeeze profits.
You can gauge entry barriers by comparing gross margins, R&D intensity, and customer acquisition costs with peers. Industries like semiconductors and pharma require large upfront investments, while online retail is much easier to crack.
| Barrier Type | Example | Effect on Entry |
|---|---|---|
| Economies of scale | Auto manufacturing | High cost deters small entrants |
| Brand loyalty | Consumer tech | Reduces customer switching |
| Regulation | Banking | Licensing and compliance hurdles |
Use a research platform to screen for firms with consistently high returns on invested capital (ROIC)—that’s usually a sign the barriers are working.
Impacts on Market Share
When barriers drop, new entrants grab market share by undercutting prices or targeting niche markets. That eats into incumbents’ market share and tightens margins.
Strong barriers—such as proprietary technology or exclusive distribution—help firms defend their turf.
You can track these changes by watching revenue growth rates and market concentration ratios. If the concentration falls, new threats are likely to rise.
Established firms might respond by ramping up marketing or squeezing out more efficiency. Sometimes, though, this dents earnings in the short run. You should weigh whether a company’s moat can really hold up before you go long.
Platforms like Seeking Alpha let you compare competitive dynamics across sectors and spot firms holding on to shares even as new players enter.
Assessing Switching Costs
Switching costs decide how easily customers can walk away. High switching costs—like data migration headaches in enterprise software or contract lock-ins—keep churn low and pricing power high. If switching is easy, customers become more price-sensitive and new entrants get a boost.
Check switching costs by looking at customer retention rates, contract lengths, and integration complexity. For instance, cloud service providers with workflows baked in tend to keep clients longer because it’s just a pain to move.
You can see these patterns using TrendSpider by overlaying company performance with new competitor entry trends. Companies with high switching costs usually have steadier revenue and less volatility—classic signs of a solid moat.
Competitive Rivalry and Industry Dynamics
Competitive rivalry shapes your stock’s long-term moat and decides whether margins expand or shrink. You get a feel for it by watching market-share shifts, pricing moves, and industry capacity growth.
Stable industries with disciplined competitors hang onto returns, but fragmented markets often squeeze profits.
Measuring Competitive Rivalry
You measure rivalry by tracking market concentration, growth rates, and switching costs. If four firms control 80% of the market, rivalry tends to be moderate. Fast-growing industries can take on new entrants without killing margins, but flat or shrinking markets ramp up competition.
Analysts use the Herfindahl-Hirschman Index (HHI) or revenue-share trends to gauge concentration. Then they compare that with return on invested capital (ROIC) to see if scale really leads to lasting profit.
Low differentiation cranks up rivalry. If products look the same and buyers can switch easily, price wars break out. Use Stock Rover to screen for companies with steady gross margins over five years—that’s usually a sign of competitive discipline.
Pricing Power in Saturated Markets
In mature markets, pricing power is the acid test for moat strength. Ask yourself: Can the company hike prices faster than inflation without losing customers?
Strong brands, cost leadership, or proprietary tech help sustain pricing power. On the flip side, oversupply or wild discounting kills it fast. Consumer goods firms with deep distribution networks often hold prices even during downturns.
Track operating margin trends and price elasticity metrics. If a company keeps or grows margins in a saturated market, it probably has a real structural edge. Use Seeking Alpha to compare peer margin histories and see what analysts are saying about pricing moves.
Case Study: Airline Industry
The airline industry shows how intense rivalry crushes profitability. Carriers battle over routes, fares, and loyalty programs, but fixed costs and low switching barriers keep margins razor-thin.
Even after consolidation, airlines stay capital-intensive and cyclical.
Fuel price swings and capacity expansions often spark fare wars. Once one airline cuts prices, the rest usually follow to keep planes full. That drags down returns and weakens pricing power.
You can track yield per passenger mile and market share by route with TradingView data feeds. Focus on airlines that manage capacity tightly and pull in higher yields—they tend to beat the rest over a full cycle.
Threat of Substitution and Substitute Products
Substitute products chip away at a company’s pricing power and its long-term profits. You’ll want to spot where customers could jump ship for something that offers similar perks at a lower price or with less hassle.
Evaluating Substitute Products
The threat of substitution pops up when another product or service meets the same need, just faster or for less money. You should look at how easily people can swap between choices. If switching costs are low and products feel interchangeable, the risk shoots up.
Take tea, coffee, and energy drinks, for example. All scratch the caffeine itch, but people weigh price, convenience, and health vibes differently. The same goes for laptops versus tablets—both handle everyday computing, but tablets lure folks who care about portability.
When you’re digging into companies, compare how substitutes stack up on the price-to-performance ratio. If a firm faces tons of decent alternatives, it’ll probably struggle to keep margins fat. You can screen for companies that hold steady gross margins even when substitutes crowd the field. That usually signals a real competitive moat.
Impact of Consumer Preferences
Consumer tastes can shift overnight, especially as new tech or social trends pop up. A tweak in lifestyle, income, or just what’s cool can make substitutes suddenly more attractive. Younger buyers, for example, might ditch sugary sodas for flavored teas or sparkling water due to health concerns.
Brand loyalty also plays a big part in substitution. Apple gets a boost from its tight ecosystem—people stick around since all their data, apps, and accessories are locked in. That setup makes switching less tempting, even if cheaper laptops or phones are out there.
Keep an eye on demographic and cultural waves. If people start caring more about sustainability or digital convenience, products that don’t keep up will fall behind.
Mitigating the Threat of Substitution
Companies fight substitution risk by making their products stand out and cranking up switching costs. They’ll use exclusive ecosystems, proprietary tech, or bundles, so alternatives just don’t look as good.
Look for firms investing in product innovation and customer experience, too. Beverage brands, for instance, launch low-sugar or plant-based lines to hang onto customers who might otherwise stray.
When you’re analyzing a portfolio, focus on businesses that keep their pricing power even with substitutes lurking. TrendSpider can help you track how market sentiment reacts to new product launches or price tweaks—a sudden drop might mean substitutes are gaining ground.
Bargaining Power of Suppliers and Buyers
You need to size up supplier and buyer power to see how much sway outside partners have over a company’s margins and pricing wiggle room. These forces show where cost pressure or pricing leverage could erode returns, and how management handles those challenges.
Supplier Power and Supply Chain Risks
Supplier power is about how much clout vendors have over input costs, quality, and supply. If a company’s stuck with just a handful of specialized suppliers, it’s in a tough spot if those suppliers crank up prices or tighten supply. On the flip side, spreading out sourcing weakens supplier leverage.
You can assess supplier power by examining supplier concentration, switching costs, and input scarcity. Semiconductor firms, for example, often depend on just a few fabrication plants, which gives suppliers significant bargaining power. Consumer goods companies, with loads of raw material sources, usually don’t face that kind of heat.
Supply chain hiccups—like shipping delays or geopolitical drama—can make supplier influence even stronger. When suppliers hold all the cards, a company’s profits hinge more on contract terms than on running a tight ship.
Buyer Power and Customer Experience
Buyer power is all about how much influence customers have on pricing, product quality, and service. If buyers can easily hop to a competitor or find a substitute, companies have to cut prices or pile on value to keep them. High buyer power squeezes margins and forces companies to keep innovating.
You can measure buyer power by digging into customer concentration, price sensitivity, and brand differentiation. For example, enterprise software vendors serving just a few big clients face way more buyer pressure than consumer brands selling to millions of folks.
Customer experience can blunt buyer power. Companies that nail service, keep pricing clear, and deliver reliable products build loyalty that takes the edge off tough negotiations.
FAQs
How do you determine a company’s competitive advantage using Porter’s Five Forces?
Check each force to see how it hits profit potential. Strong entry barriers, few substitutes, and weak supplier or buyer power point to a stronger moat.
With Stock Rover, you can line up industry peers and see how these forces play out in margins and returns on invested capital.
What specific metrics can you use to gauge a company’s moat strength?
Zero in on return on invested capital (ROIC), gross margin stability, and market share trends. If you see consistently high ROIC and widening margins, that usually means a durable edge.
Can you apply Porter’s Five Forces to any industry?
You can, but the way each force works shifts by industry. In tech, constant innovation ramps up the threat of substitutes. Utilities, meanwhile, get shielded by regulations that block new entrants.
It’s better to adjust your analysis for the sector instead of applying the model by rote.
What are the limitations of using Porter’s Five Forces for stock analysis?
The framework really focuses on industry structure, not how well a company executes or how sharp management is. It also assumes markets stay pretty stable—which isn’t always true, especially in fast-moving sectors.
Mix it with financial ratio analysis and trend data so you’re not relying too heavily on any one model.
Source link