Canada CPI set to show easing inflation as markets price in a BoC hold | FXStreet
On Monday, attention in Canada will turn to the release of February’s Consumer Price Index (CPI) figures. The data from Statistics Canada will offer the Bank of Canada (BoC) a fresh read on inflation dynamics just ahead of its March 18 meeting, where policymakers are widely expected to leave the policy rate unchanged at 2.25%.
Economists anticipate headline CPI rising by 2.1% YoY in February, still above the BoC’s target but easing from January’s 2.3% annual increase. On a monthly basis, prices are projected to rise 0.4%. Policymakers will also keep a close eye on the core measure, which excludes food and energy, that is set to increase by 2.4% after printing at 2.6% YoY in the opening month of 2026.
Analysts remain uneasy as inflation remains above the BoC’s target, although it has shown some cooling in January. The risk of US tariffs feeding into domestic prices is still seen as adding another layer of uncertainty.
What can we expect from Canada’s inflation rate?
At its latest meeting, the central bank signalled that policy is broadly where it needs to be to keep inflation close to the 2% target, assuming the economy evolves as expected. Still, officials were careful to stress that they are not operating on autopilot. Should the outlook weaken or inflation risks re-emerge, they stand ready to adjust policy accordingly.
When it comes to inflation, the message was cautiously reassuring. Headline price growth is expected to hover around the target, with spare capacity in the economy helping to offset part of the cost pressures linked to ongoing trade reconfiguration. That said, underlying inflation remains somewhat elevated, a reminder that the disinflation process is still incomplete.
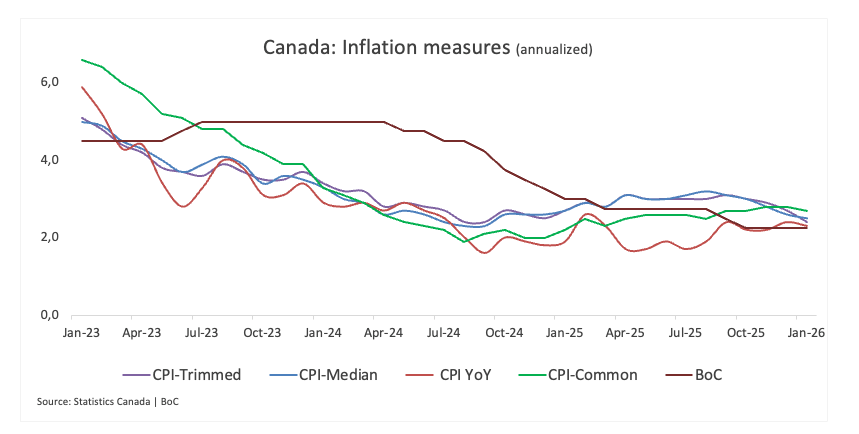
Inflation therefore remains the key variable to watch. The latest data showed headline CPI easing to 2.3% YoY in January, while core inflation moderated to 2.6% YoY. The Bank’s preferred gauges, CPI-Common, Trimmed Mean and Median, also softened. However, at 2.7%, 2.4% and 2.5%, respectively, they continue to run above the 2% objective.
When is the Canada CPI data due, and how could it affect USD/CAD?
Markets will turn their full attention to Monday at 12:30 GMT, when Statistics Canada releases its latest inflation figures. There is a noticeable sense of caution ahead of the print, with traders wary that price pressures may prove stickier than expected and keep the broader inflation trend from easing too quickly.
A stronger-than-expected reading would likely revive concerns that tariff-related costs are beginning to filter through to consumers. That scenario could push the Bank of Canada towards a slightly more cautious tone in the near term. It would also tend to offer the Canadian Dollar (CAD) some short-term support, as investors reassess the policy outlook in light of evolving trade tensions and their potential impact on inflation.
Pablo Piovano, Senior Analyst at FXStreet, notes that the Canadian Dollar has surrendered a large portion of its monthly gains in recent sessions, allowing USD/CAD to rebound sharply and approach the 1.3750 area after finding a monthly base near 1.3530.
According to Piovano, a continuation of the renewed bullish momentum could see the pair challenge the March peak at 1.3752 (March 3), followed by the key 200-day SMA near 1.3800. Beyond that, attention would shift to the provisional 100-day SMA around 1.3810, ahead of the 2026 high at 1.3928 (January 16).
On the downside, Piovano highlights initial support at the monthly low of 1.3525 (March 9), followed by the February trough at 1.3504 (February 11) and the 2026 bottom at 1.3481 (January 30).
“In addition, momentum indicators continue to lean modestly bullish. The Relative Strength Index (RSI) is approaching the 59 area, while the Average Directional Index (ADX) near 14 suggests the trend still lacks strong conviction,” he adds.
US-China Trade War FAQs
Generally speaking, a trade war is an economic conflict between two or more countries due to extreme protectionism on one end. It implies the creation of trade barriers, such as tariffs, which result in counter-barriers, escalating import costs, and hence the cost of living.
An economic conflict between the United States (US) and China began early in 2018, when President Donald Trump set trade barriers on China, claiming unfair commercial practices and intellectual property theft from the Asian giant. China took retaliatory action, imposing tariffs on multiple US goods, such as automobiles and soybeans. Tensions escalated until the two countries signed the US-China Phase One trade deal in January 2020. The agreement required structural reforms and other changes to China’s economic and trade regime and pretended to restore stability and trust between the two nations. However, the Coronavirus pandemic took the focus out of the conflict. Yet, it is worth mentioning that President Joe Biden, who took office after Trump, kept tariffs in place and even added some additional levies.
The return of Donald Trump to the White House as the 47th US President has sparked a fresh wave of tensions between the two countries. During the 2024 election campaign, Trump pledged to impose 60% tariffs on China once he returned to office, which he did on January 20, 2025. With Trump back, the US-China trade war is meant to resume where it was left, with tit-for-tat policies affecting the global economic landscape amid disruptions in global supply chains, resulting in a reduction in spending, particularly investment, and directly feeding into the Consumer Price Index inflation.
Economic Indicator
BoC Consumer Price Index Core (MoM)
The BoC Consumer Price Index Core, released by the Bank of Canada (BoC) on a monthly basis, represents changes in prices for Canadian consumers by comparing the cost of a fixed basket of goods and services. It is considered a measure of underlying inflation as it excludes eight of the most-volatile components: fruits, vegetables, gasoline, fuel oil, natural gas, mortgage interest, intercity transportation and tobacco products. The MoM figure compares the prices of goods in the reference month to the previous month. Generally, a high reading is seen as bullish for the Canadian Dollar (CAD), while a low reading is seen as bearish.
Last release:
Tue Feb 17, 2026 13:30
Frequency:
Monthly
Actual:
0.2%
Consensus:
–
Previous:
-0.4%
Source:
Statistics Canada