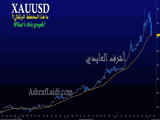
This Gold Chart
What does the graph represent? You know the reasons, but focus on this chart.
There are different explanations for the gold selloff by different people:
1. Reporters/Junior analysts: rising yields/high inflation end case for rate cuts.
2. Junior Traders: Selling few some holdings to lock gains & absorb portfolio losses
4. AdvisoryNewsletters that charge you $12k per year: Iran & Russia selling to finance wars etc.
3. Senior Traders: Margin calls…
Now back to the chart…what does the graph represent?
Click To Enlarge