Large Currency Speculators sharply add to Canadian Dollar Bearish Bets
By InvestMacro
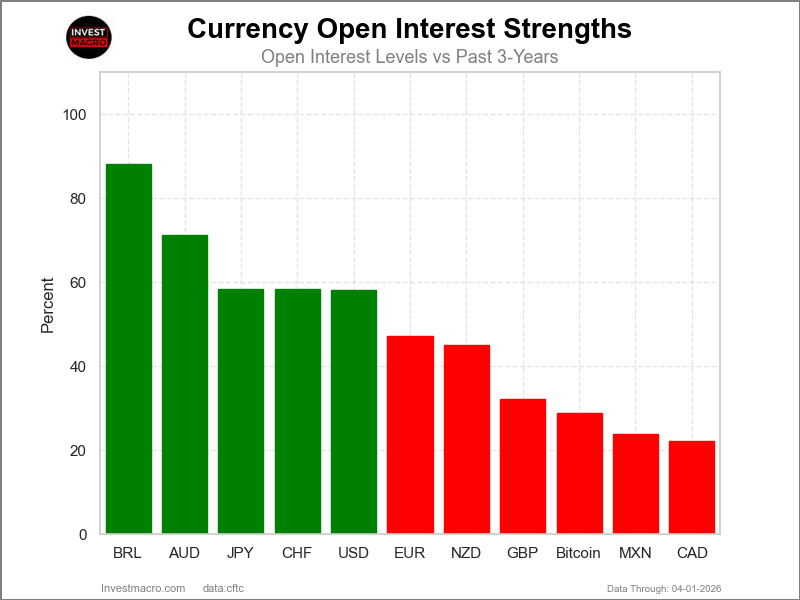
Open Interest (OI) is the amount of contracts that are currently live in the marketplace. OI Strength shows the current strength compared to the past 3-years.
Here are the latest charts and statistics for the Commitment of Traders (COT) data published by the Commodities Futures Trading Commission (CFTC).
The latest COT data is updated through Tuesday March 31st and shows a quick view of how large market participants (for-profit speculators and commercial traders) were positioned in the futures markets. All currency positions are in direct relation to the US dollar where, for example, a bet for the euro is a bet that the euro will rise versus the dollar while a bet against the euro will be a bet that the euro will decline versus the dollar.
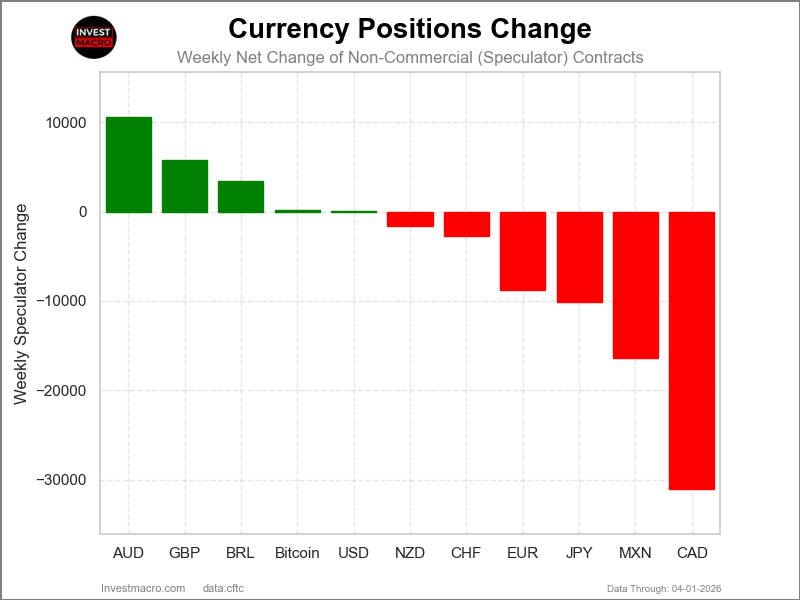
Weekly Speculator Changes led by Australian Dollar & British Pound
The COT currency market speculator bets were lower this week as five out of the eleven currency markets we cover had higher positioning while the other six markets had lower speculator contracts.
Leading the gains for the currency markets was the Australian Dollar (10,634 contracts) with the British Pound (5,757 contracts), the Brazilian Real (3,463 contracts), Bitcoin (147 contracts), and the US Dollar Index (64 contracts) also showing positive weeks.
The currencies seeing declines in speculator bets on the week were the Canadian Dollar (-31,082 contracts), the Mexican Peso (-16,392 contracts), the Japanese Yen (-10,066 contracts), the EuroFX (-8,772 contracts), the Swiss Franc (-2,774 contracts) and the New Zealand Dollar (-1,582 contracts) also registering lower bets on the week.
Speculators sharply add to Canadian Dollar Bearish Bets
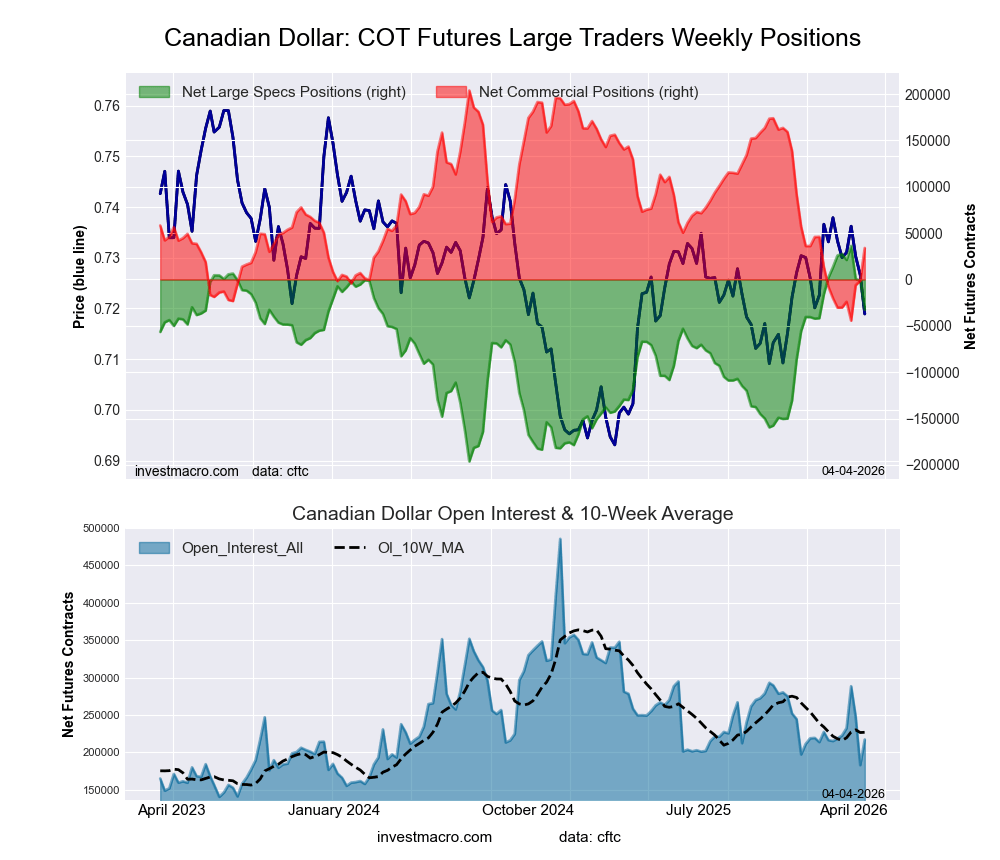
The Canadian Dollar weakness highlights the currencies markets speculator positions for the week. The large speculative Canadian Dollar position fell by over 31,000 contracts this week, marking its third consecutive week in decline and the fourth time out of the past five weeks. In just the past three weeks alone, the Canadian Dollar has shed -68,843 contracts from its overall standing, going from a net position of +36,159 contracts on March 10 to this week’s new total of -32,684 net contracts. The Canadian Dollar had been in bullish territory for a seven-week span from the end of January until the middle of March before speculators started adding bearish positions. In the Foreign Exchange markets this week, the Canadian Dollar fell modestly but has now fallen for four consecutive weeks. Previously, the Canadian Dollar had reached six-month highs in January and February, just above the 0.7415 levels. However, since the beginning of March, the Canadian Dollar has been in a downtrend which has seen its exchange rate fall to 0.7207 at the close of this week. Where the currency goes from here could be determined at its current level around 0.7200, which has been a source of major support numerous times over the past three years.
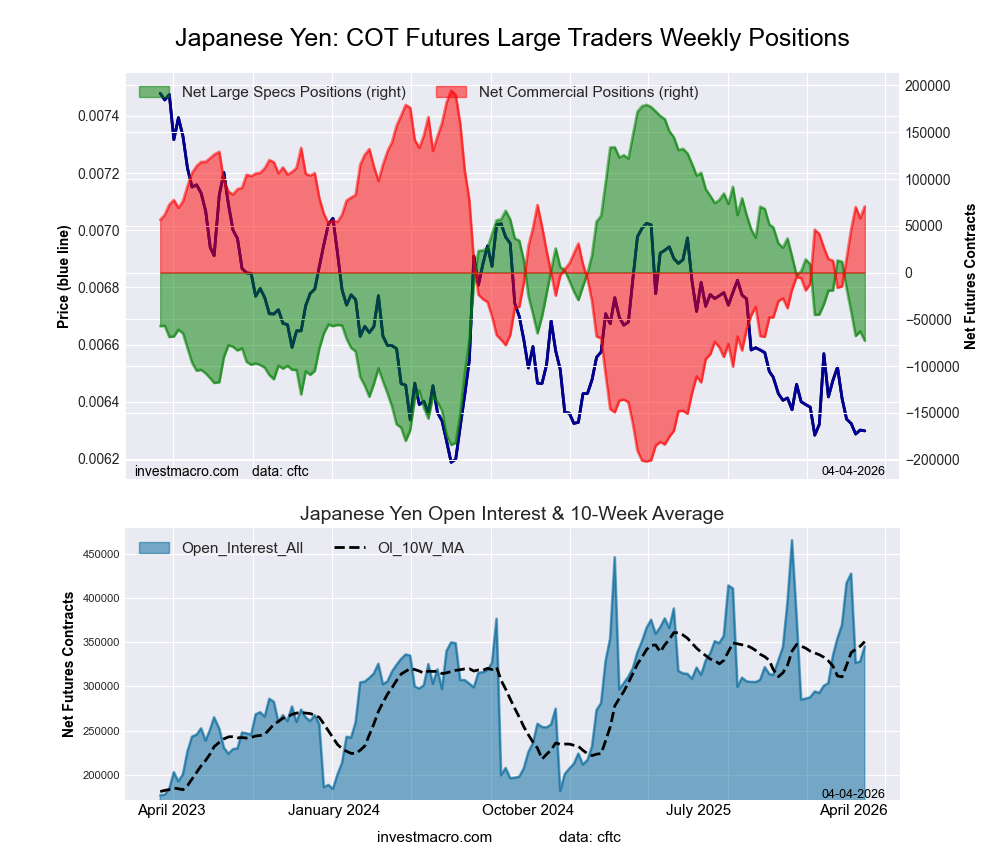
The Japanese Yen position continues to also go more bearish and fell this week for the fifth time out of the past six weeks. The cumulative total of the past six weeks has now fallen by -85,827 contracts, bringing the Japanese Yen position from a bullish level of +12,955 contracts on February 17 to this week’s new total of -72,872 contracts. This week’s net position is now the most bearish since July 2024. The Japanese Yen against the US Dollar closed this week right near the 160.00 major significant level. The Yen is seeing weakness around the lowest levels of the past 30 years. Further upside will run into the 161.00 resistance area, followed by the 161.75 – 162.00 resistance that was challenged in July 2024.
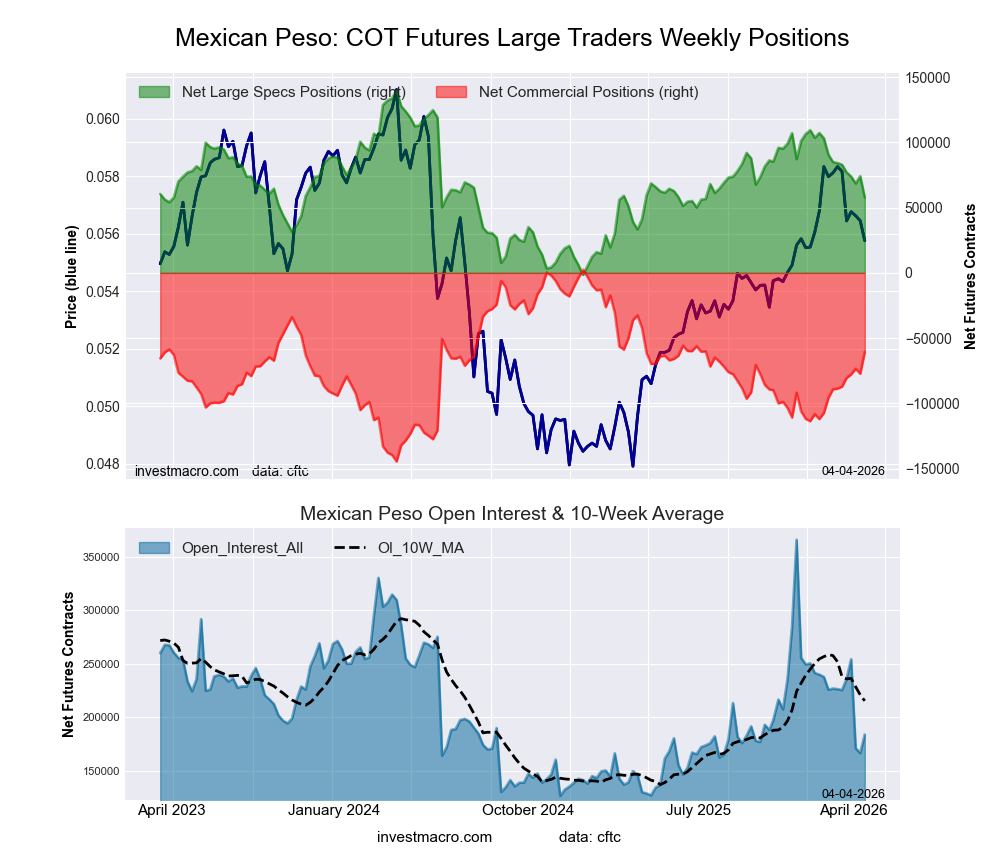
Mexican Peso positions dropped sharply this week by over -16,000 contracts. Peso positioning has been sliding since late January when it was at the end of a seven-week streak where positions were over 100,000 contracts. Since then, Peso speculative positions have cooled off by a total of -45,430 contracts. That has brought the overall position down to this week’s total of 57,684 net positions. The Peso, meanwhile, has been in a nice uptrend over the past year, with prices gaining by approximately 19% since the beginning of February 2025. The Peso has run into weakness over the past six weeks. However, the currency rebounded this week strongly by approximately +1.50%, breaking a previous five-week losing streak.
The Mexican Peso and Brazilian Real lead the Currency market price performances this week
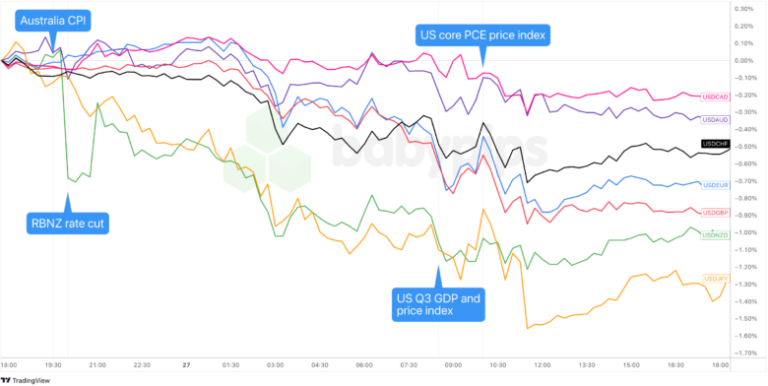
In the Currency markets, the price performance leaders were the Mexican Peso with a 1.46% rise on the week and the Brazilian Real, which increased by 1.30%. Bitcoin was modestly higher by 0.69%, while the Australian Dollar increased by 0.43%. The Japanese Yen ticked up by 0.32%, followed by the Euro, which was higher by 0.26%. Rounding out the gainers was the US Dollar Index, which edged higher by 0.03% on the week. The Swiss Franc was slightly lower by -0.02% and followed by the Canadian Dollar, which was lower by -0.34%. The British Pound was modestly lower by -0.40%, while the New Zealand Dollar rounds out the decliners on the week with a -0.84% decrease in the Currency markets.
Over the past 30 days, the only Currency that has a positive return is the US Dollar Index, which has risen by 2.48% in the past 30 days. While on the downside, Bitcoin has fallen by -5.77%, the New Zealand Dollar has dropped by -5.34%, and the Swiss Franc is down by approximately -4%.
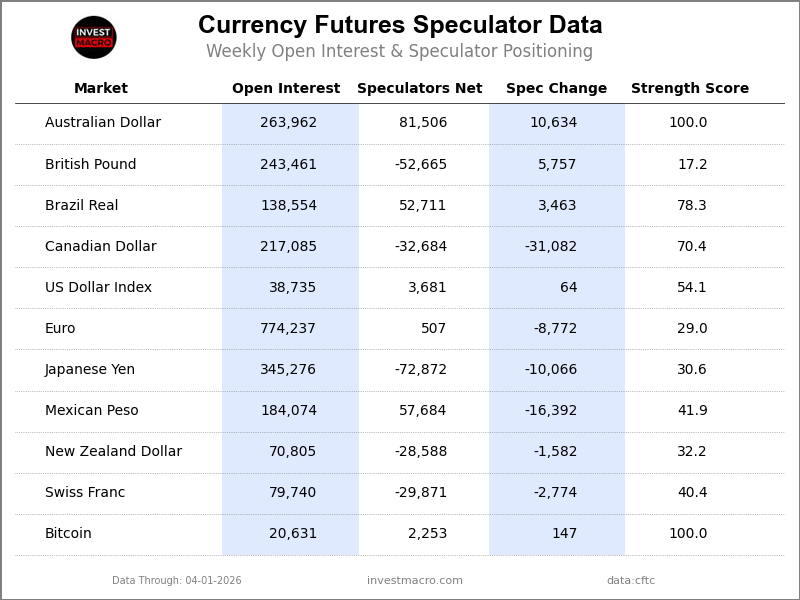
Currencies Data:
Legend: Open Interest | Speculators Current Net Position | Weekly Specs Change | Specs Strength Score compared to last 3-Years (0-100 range)
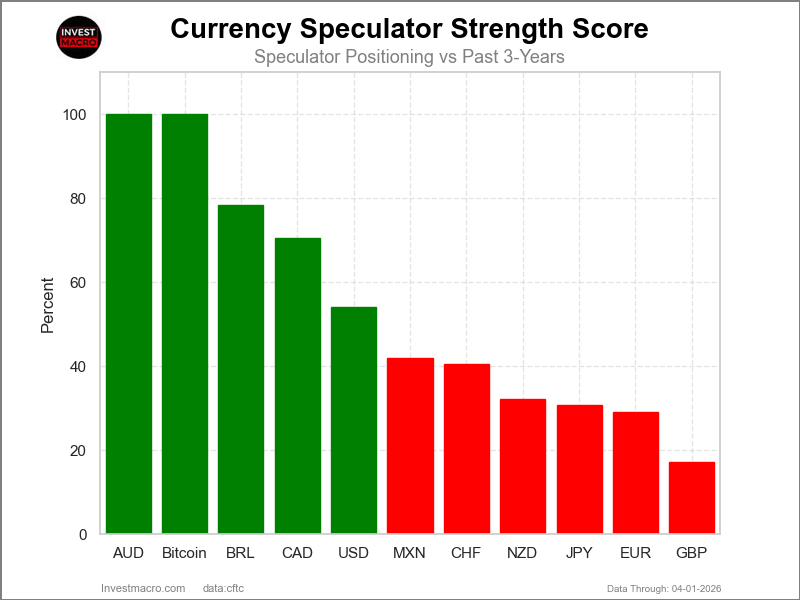
Strength Scores led by Australian Dollar & Bitcoin
COT Strength Scores (a normalized measure of Speculator positions over a 3-Year range, from 0 to 100 where above 80 is Extreme-Bullish and below 20 is Extreme-Bearish) showed that the Australian Dollar (100 percent) and the Bitcoin (100 percent) lead the currency markets this week. The Brazilian Real (78 percent), Canadian Dollar (70 percent) and the US Dollar Index (54 percent) come in as the next highest in the weekly strength scores.
On the downside, the British Pound (17 percent) comes in at the lowest strength levels currently and is in Extreme-Bearish territory (below 20 percent). The next lowest strength scores are the EuroFX (29 percent), the Japanese Yen (31 percent) and the New Zealand Dollar (32 percent).
3-Year Strength Statistics:
US Dollar Index (54.1 percent) vs US Dollar Index previous week (53.9 percent)
EuroFX (29.0 percent) vs EuroFX previous week (32.3 percent)
British Pound Sterling (17.2 percent) vs British Pound Sterling previous week (14.8 percent)
Japanese Yen (30.6 percent) vs Japanese Yen previous week (33.4 percent)
Swiss Franc (40.4 percent) vs Swiss Franc previous week (46.0 percent)
Canadian Dollar (70.4 percent) vs Canadian Dollar previous week (83.8 percent)
Australian Dollar (100.0 percent) vs Australian Dollar previous week (94.4 percent)
New Zealand Dollar (32.2 percent) vs New Zealand Dollar previous week (34.0 percent)
Mexican Peso (41.9 percent) vs Mexican Peso previous week (53.5 percent)
Brazilian Real (78.3 percent) vs Brazilian Real previous week (75.8 percent)
Bitcoin (100.0 percent) vs Bitcoin previous week (96.9 percent)
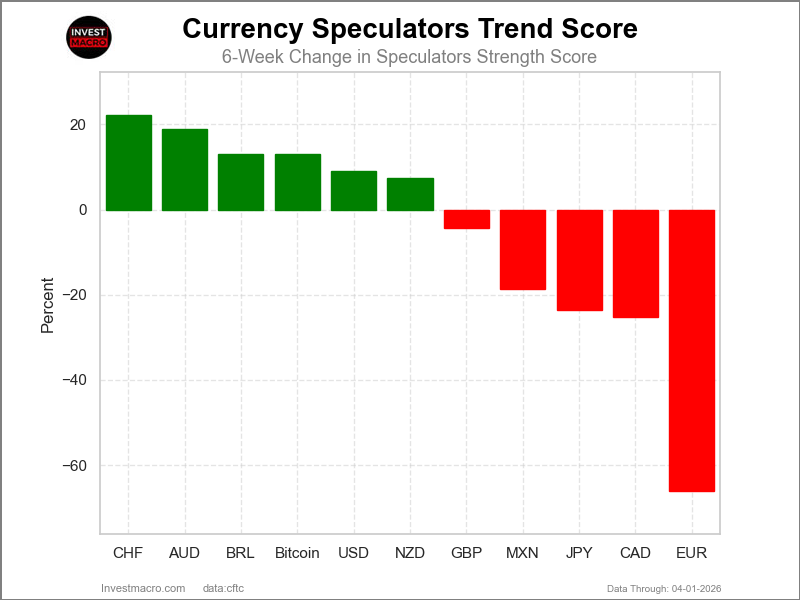
Swiss Franc & Australian Dollar top the 6-Week Strength Trends
COT Strength Score Trends (or move index, calculates the 6-week changes in strength scores) showed that the Swiss Franc (22 percent) and the Australian Dollar (19 percent) lead the past six weeks trends for the currencies. The Brazilian Real (13 percent), Bitcoin (13 percent) and the US Dollar Index (9 percent) are the next highest positive movers in the 3-Year trends data.
The EuroFX (-66 percent) leads the downside trend scores currently with the Canadian Dollar (-25 percent), Japanese Yen (-24 percent) and the Mexican Peso (-19 percent) following next with lower trend scores.
3-Year Strength Trends:
US Dollar Index (9.1 percent) vs US Dollar Index previous week (11.7 percent)
EuroFX (-66.2 percent) vs EuroFX previous week (-65.1 percent)
British Pound Sterling (-4.4 percent) vs British Pound Sterling previous week (-13.9 percent)
Japanese Yen (-23.6 percent) vs Japanese Yen previous week (-12.0 percent)
Swiss Franc (22.3 percent) vs Swiss Franc previous week (30.7 percent)
Canadian Dollar (-25.2 percent) vs Canadian Dollar previous week (-6.4 percent)
Australian Dollar (18.8 percent) vs Australian Dollar previous week (19.9 percent)
New Zealand Dollar (7.3 percent) vs New Zealand Dollar previous week (9.0 percent)
Mexican Peso (-18.7 percent) vs Mexican Peso previous week (-7.7 percent)
Brazilian Real (13.1 percent) vs Brazilian Real previous week (12.8 percent)
Bitcoin (13.0 percent) vs Bitcoin previous week (23.0 percent)
Individual COT Forex Markets:
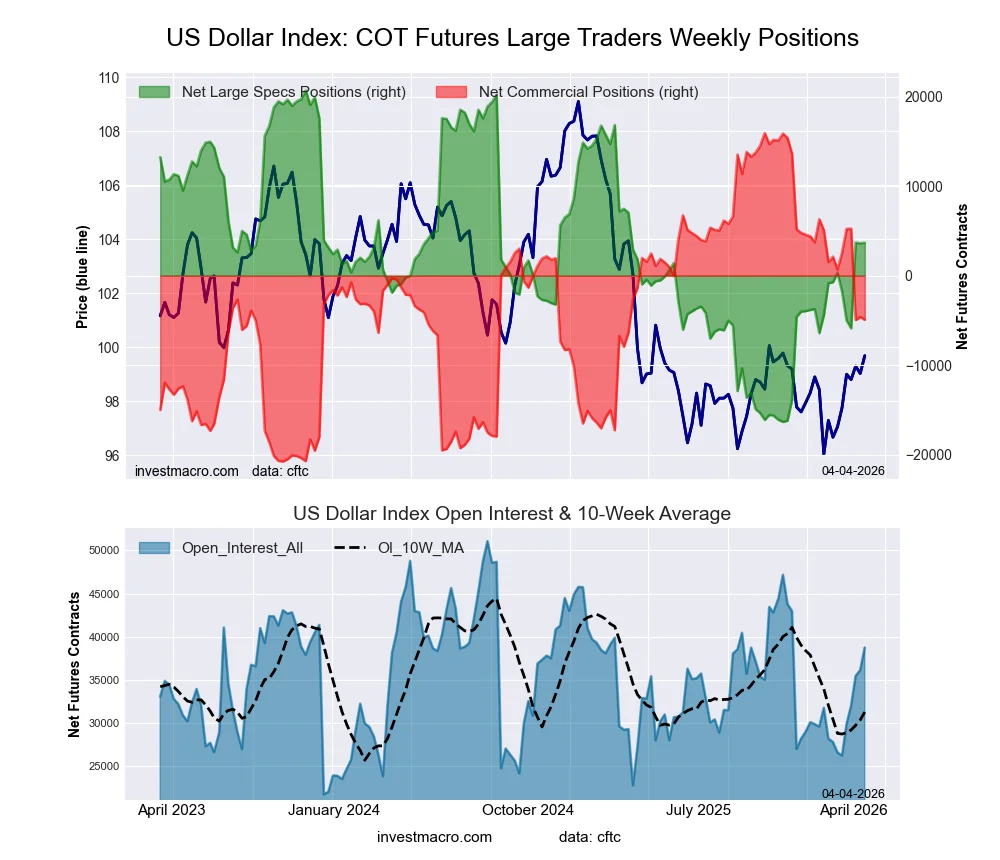
US Dollar Index Futures:
The US Dollar Index large speculator standing this week was a net position of 3,681 contracts in the data reported through Tuesday. This was a weekly rise of 64 contracts from the previous week which had a total of 3,617 net contracts.
This week’s current strength score (the trader positioning range over the past three years, measured from 0 to 100) shows the speculators are currently Bullish with a score of 54.1 percent. The commercials are Bearish with a score of 43.2 percent and the small traders (not shown in chart) are Bullish with a score of 60.8 percent.
Price Trend-Following Model: Strong Uptrend
Our weekly trend-following model classifies the current market price position as: Strong Uptrend.
| US DOLLAR INDEX Statistics | SPECULATORS | COMMERCIALS | SMALL TRADERS |
| – Percent of Open Interest Longs: | 56.0 | 29.2 | 8.7 |
| – Percent of Open Interest Shorts: | 46.5 | 41.9 | 5.5 |
| – Net Position: | 3,681 | -4,930 | 1,249 |
| – Gross Longs: | 21,708 | 11,319 | 3,389 |
| – Gross Shorts: | 18,027 | 16,249 | 2,140 |
| – Long to Short Ratio: | 1.2 to 1 | 0.7 to 1 | 1.6 to 1 |
| NET POSITION TREND: | |||
| – Strength Index Score (3 Year Range Pct): | 54.1 | 43.2 | 60.8 |
| – Strength Index Reading (3 Year Range): | Bullish | Bearish | Bullish |
| NET POSITION MOVEMENT INDEX: | |||
| – 6-Week Change in Strength Index: | 9.1 | -15.3 | 39.7 |
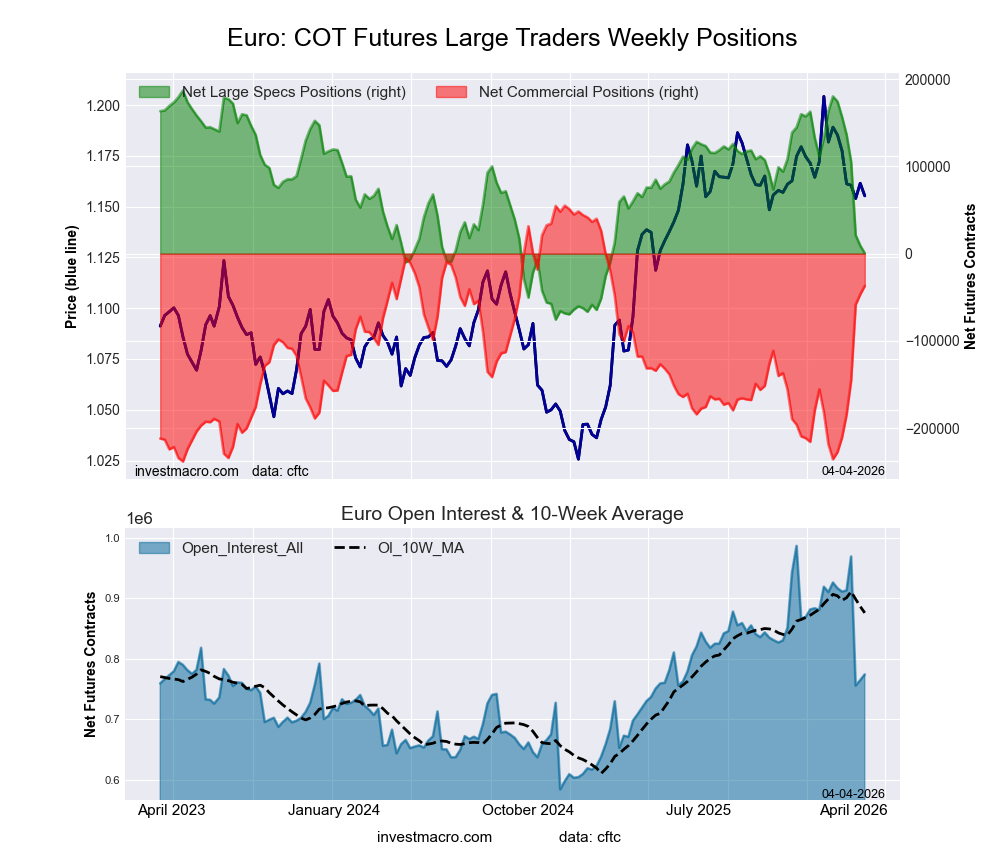
Euro Currency Futures:
The Euro Currency large speculator standing this week was a net position of 507 contracts in the data reported through Tuesday. This was a weekly decrease of -8,772 contracts from the previous week which had a total of 9,279 net contracts.
This week’s current strength score (the trader positioning range over the past three years, measured from 0 to 100) shows the speculators are currently Bearish with a score of 29.0 percent. The commercials are Bullish with a score of 68.6 percent and the small traders (not shown in chart) are Bullish with a score of 51.5 percent.
Price Trend-Following Model: Strong Downtrend
Our weekly trend-following model classifies the current market price position as: Strong Downtrend.
| EURO Currency Statistics | SPECULATORS | COMMERCIALS | SMALL TRADERS |
| – Percent of Open Interest Longs: | 25.9 | 59.7 | 10.8 |
| – Percent of Open Interest Shorts: | 25.8 | 64.5 | 6.0 |
| – Net Position: | 507 | -36,991 | 36,484 |
| – Gross Longs: | 200,168 | 462,337 | 83,289 |
| – Gross Shorts: | 199,661 | 499,328 | 46,805 |
| – Long to Short Ratio: | 1.0 to 1 | 0.9 to 1 | 1.8 to 1 |
| NET POSITION TREND: | |||
| – Strength Index Score (3 Year Range Pct): | 29.0 | 68.6 | 51.5 |
| – Strength Index Reading (3 Year Range): | Bearish | Bullish | Bullish |
| NET POSITION MOVEMENT INDEX: | |||
| – 6-Week Change in Strength Index: | -66.2 | 65.0 | -35.3 |
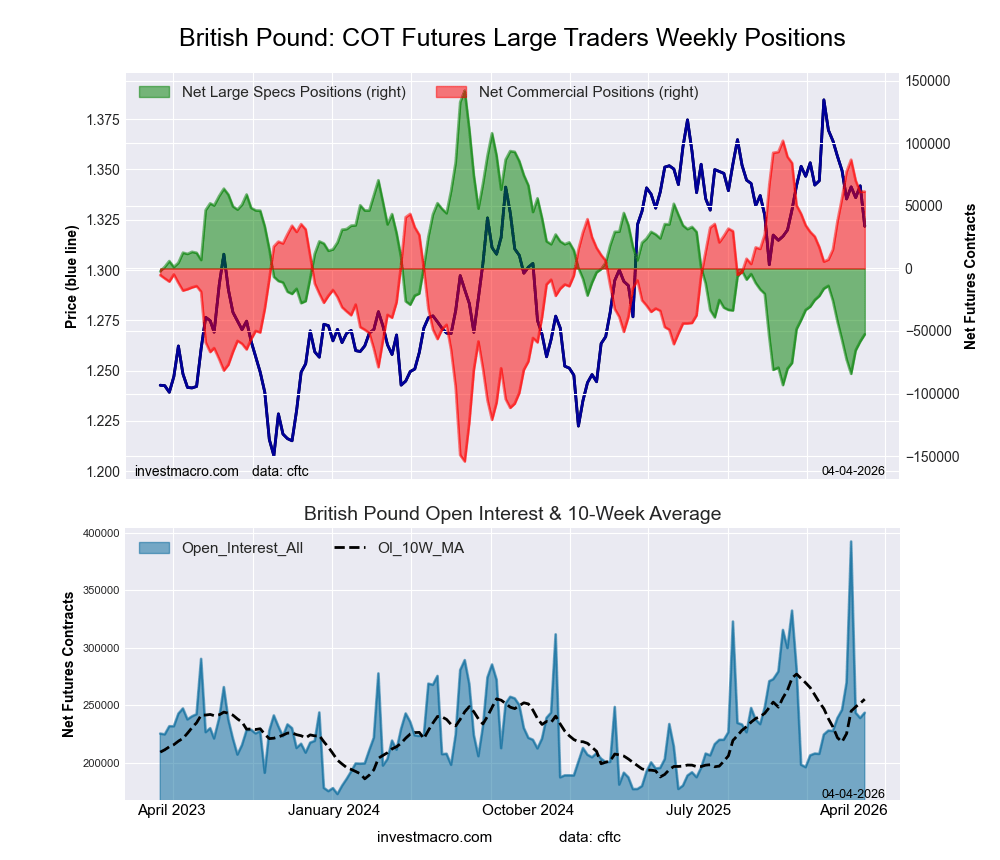
British Pound Sterling Futures:
The British Pound Sterling large speculator standing this week was a net position of -52,665 contracts in the data reported through Tuesday. This was a weekly boost of 5,757 contracts from the previous week which had a total of -58,422 net contracts.
This week’s current strength score (the trader positioning range over the past three years, measured from 0 to 100) shows the speculators are currently Bearish-Extreme with a score of 17.2 percent. The commercials are Bullish-Extreme with a score of 84.2 percent and the small traders (not shown in chart) are Bearish with a score of 30.5 percent.
Price Trend-Following Model: Uptrend
Our weekly trend-following model classifies the current market price position as: Uptrend.
| BRITISH POUND Statistics | SPECULATORS | COMMERCIALS | SMALL TRADERS |
| – Percent of Open Interest Longs: | 21.1 | 68.9 | 8.7 |
| – Percent of Open Interest Shorts: | 42.7 | 43.6 | 12.3 |
| – Net Position: | -52,665 | 61,408 | -8,743 |
| – Gross Longs: | 51,304 | 167,652 | 21,248 |
| – Gross Shorts: | 103,969 | 106,244 | 29,991 |
| – Long to Short Ratio: | 0.5 to 1 | 1.6 to 1 | 0.7 to 1 |
| NET POSITION TREND: | |||
| – Strength Index Score (3 Year Range Pct): | 17.2 | 84.2 | 30.5 |
| – Strength Index Reading (3 Year Range): | Bearish-Extreme | Bullish-Extreme | Bearish |
| NET POSITION MOVEMENT INDEX: | |||
| – 6-Week Change in Strength Index: | -4.4 | 9.3 | -35.1 |
Japanese Yen Futures:
The Japanese Yen large speculator standing this week was a net position of -72,872 contracts in the data reported through Tuesday. This was a weekly decrease of -10,066 contracts from the previous week which had a total of -62,806 net contracts.
This week’s current strength score (the trader positioning range over the past three years, measured from 0 to 100) shows the speculators are currently Bearish with a score of 30.6 percent. The commercials are Bullish with a score of 68.8 percent and the small traders (not shown in chart) are Bearish with a score of 42.3 percent.
Price Trend-Following Model: Strong Downtrend
Our weekly trend-following model classifies the current market price position as: Strong Downtrend.
| JAPANESE YEN Statistics | SPECULATORS | COMMERCIALS | SMALL TRADERS |
| – Percent of Open Interest Longs: | 27.6 | 53.9 | 11.8 |
| – Percent of Open Interest Shorts: | 48.7 | 33.4 | 11.2 |
| – Net Position: | -72,872 | 70,707 | 2,165 |
| – Gross Longs: | 95,356 | 185,944 | 40,898 |
| – Gross Shorts: | 168,228 | 115,237 | 38,733 |
| – Long to Short Ratio: | 0.6 to 1 | 1.6 to 1 | 1.1 to 1 |
| NET POSITION TREND: | |||
| – Strength Index Score (3 Year Range Pct): | 30.6 | 68.8 | 42.3 |
| – Strength Index Reading (3 Year Range): | Bearish | Bullish | Bearish |
| NET POSITION MOVEMENT INDEX: | |||
| – 6-Week Change in Strength Index: | -23.6 | 21.9 | -2.7 |
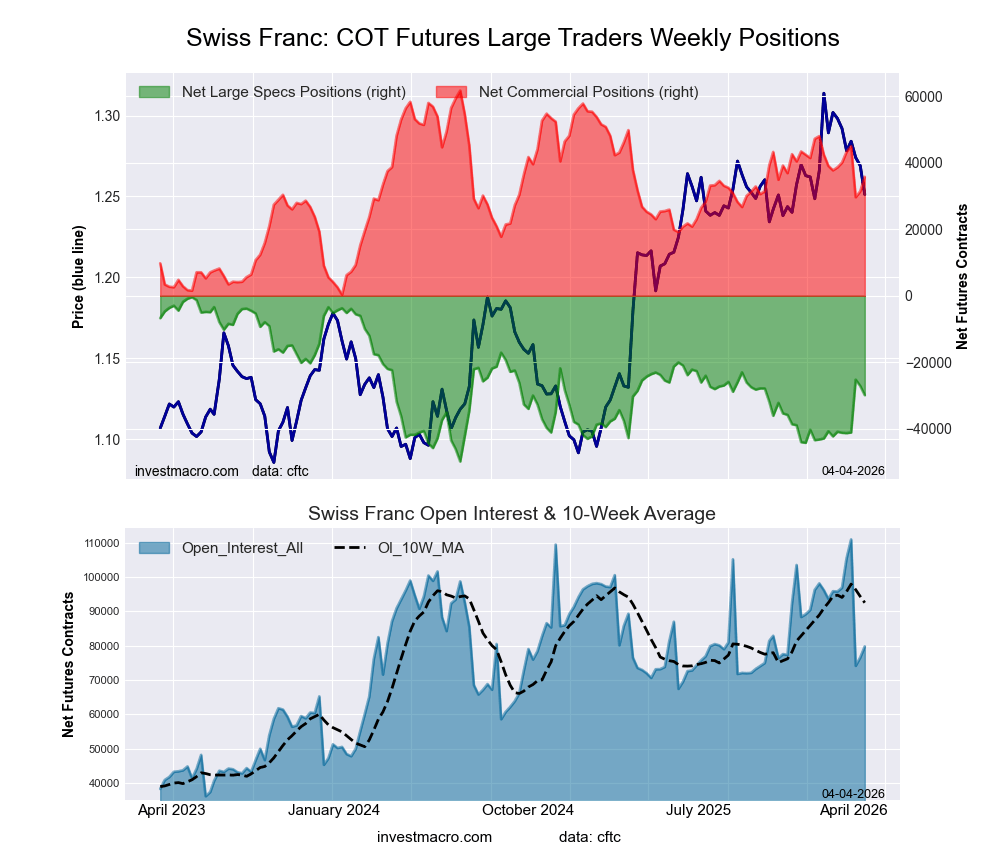
Swiss Franc Futures:
The Swiss Franc large speculator standing this week was a net position of -29,871 contracts in the data reported through Tuesday. This was a weekly reduction of -2,774 contracts from the previous week which had a total of -27,097 net contracts.
This week’s current strength score (the trader positioning range over the past three years, measured from 0 to 100) shows the speculators are currently Bearish with a score of 40.4 percent. The commercials are Bullish with a score of 57.8 percent and the small traders (not shown in chart) are Bullish with a score of 53.9 percent.
Price Trend-Following Model: Weak Uptrend
Our weekly trend-following model classifies the current market price position as: Weak Uptrend.
| SWISS FRANC Statistics | SPECULATORS | COMMERCIALS | SMALL TRADERS |
| – Percent of Open Interest Longs: | 11.7 | 73.0 | 15.0 |
| – Percent of Open Interest Shorts: | 49.1 | 28.2 | 22.3 |
| – Net Position: | -29,871 | 35,735 | -5,864 |
| – Gross Longs: | 9,315 | 58,243 | 11,957 |
| – Gross Shorts: | 39,186 | 22,508 | 17,821 |
| – Long to Short Ratio: | 0.2 to 1 | 2.6 to 1 | 0.7 to 1 |
| NET POSITION TREND: | |||
| – Strength Index Score (3 Year Range Pct): | 40.4 | 57.8 | 53.9 |
| – Strength Index Reading (3 Year Range): | Bearish | Bullish | Bullish |
| NET POSITION MOVEMENT INDEX: | |||
| – 6-Week Change in Strength Index: | 22.3 | -4.7 | -34.5 |
Canadian Dollar Futures:
The Canadian Dollar large speculator standing this week was a net position of -32,684 contracts in the data reported through Tuesday. This was a weekly decline of -31,082 contracts from the previous week which had a total of -1,602 net contracts.
This week’s current strength score (the trader positioning range over the past three years, measured from 0 to 100) shows the speculators are currently Bullish with a score of 70.4 percent. The commercials are Bearish with a score of 31.6 percent and the small traders (not shown in chart) are Bearish with a score of 41.7 percent.
Price Trend-Following Model: Weak Uptrend
Our weekly trend-following model classifies the current market price position as: Weak Uptrend.
| CANADIAN DOLLAR Statistics | SPECULATORS | COMMERCIALS | SMALL TRADERS |
| – Percent of Open Interest Longs: | 26.0 | 55.8 | 14.6 |
| – Percent of Open Interest Shorts: | 41.0 | 40.2 | 15.2 |
| – Net Position: | -32,684 | 33,986 | -1,302 |
| – Gross Longs: | 56,421 | 121,227 | 31,625 |
| – Gross Shorts: | 89,105 | 87,241 | 32,927 |
| – Long to Short Ratio: | 0.6 to 1 | 1.4 to 1 | 1.0 to 1 |
| NET POSITION TREND: | |||
| – Strength Index Score (3 Year Range Pct): | 70.4 | 31.6 | 41.7 |
| – Strength Index Reading (3 Year Range): | Bullish | Bearish | Bearish |
| NET POSITION MOVEMENT INDEX: | |||
| – 6-Week Change in Strength Index: | -25.2 | 25.9 | -16.3 |
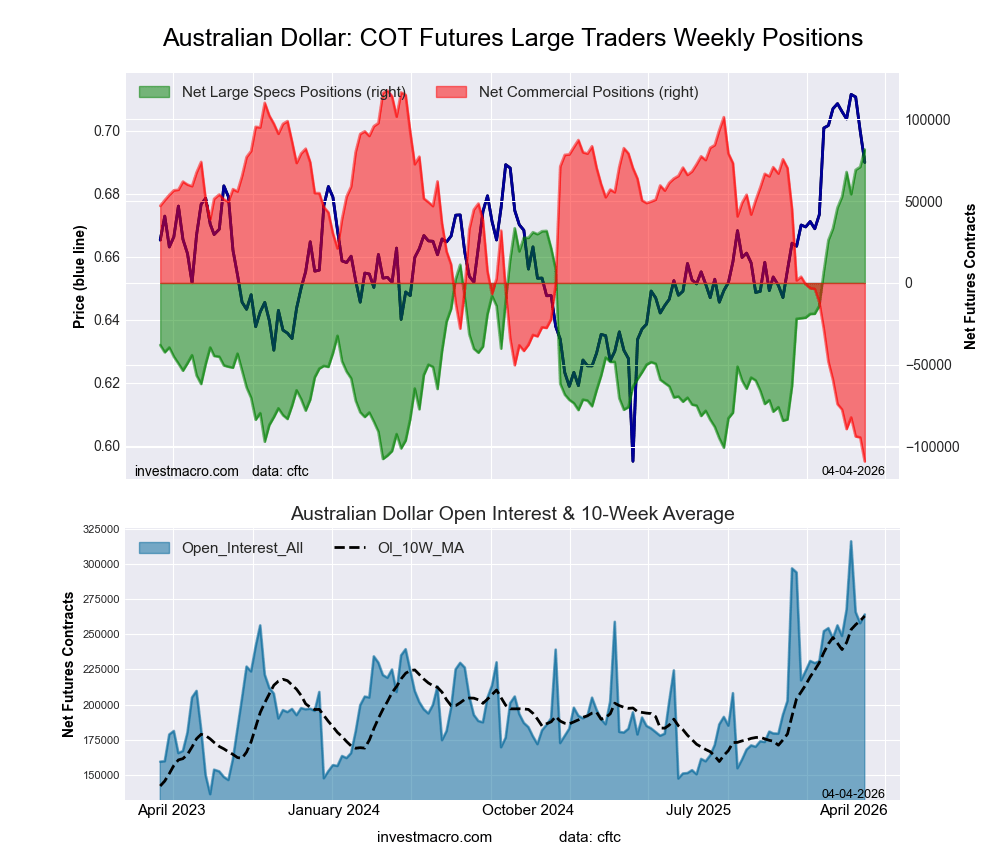
Australian Dollar Futures:
The Australian Dollar large speculator standing this week was a net position of 81,506 contracts in the data reported through Tuesday. This was a weekly rise of 10,634 contracts from the previous week which had a total of 70,872 net contracts.
This week’s current strength score (the trader positioning range over the past three years, measured from 0 to 100) shows the speculators are currently Bullish-Extreme with a score of 100.0 percent. The commercials are Bearish-Extreme with a score of 0.0 percent and the small traders (not shown in chart) are Bullish-Extreme with a score of 98.9 percent.
Price Trend-Following Model: Weak Uptrend
Our weekly trend-following model classifies the current market price position as: Weak Uptrend.
| AUSTRALIAN DOLLAR Statistics | SPECULATORS | COMMERCIALS | SMALL TRADERS |
| – Percent of Open Interest Longs: | 53.7 | 30.0 | 15.9 |
| – Percent of Open Interest Shorts: | 22.8 | 71.3 | 5.5 |
| – Net Position: | 81,506 | -109,041 | 27,535 |
| – Gross Longs: | 141,775 | 79,251 | 42,040 |
| – Gross Shorts: | 60,269 | 188,292 | 14,505 |
| – Long to Short Ratio: | 2.4 to 1 | 0.4 to 1 | 2.9 to 1 |
| NET POSITION TREND: | |||
| – Strength Index Score (3 Year Range Pct): | 100.0 | 0.0 | 98.9 |
| – Strength Index Reading (3 Year Range): | Bullish-Extreme | Bearish-Extreme | Bullish-Extreme |
| NET POSITION MOVEMENT INDEX: | |||
| – 6-Week Change in Strength Index: | 18.8 | -15.5 | -1.1 |
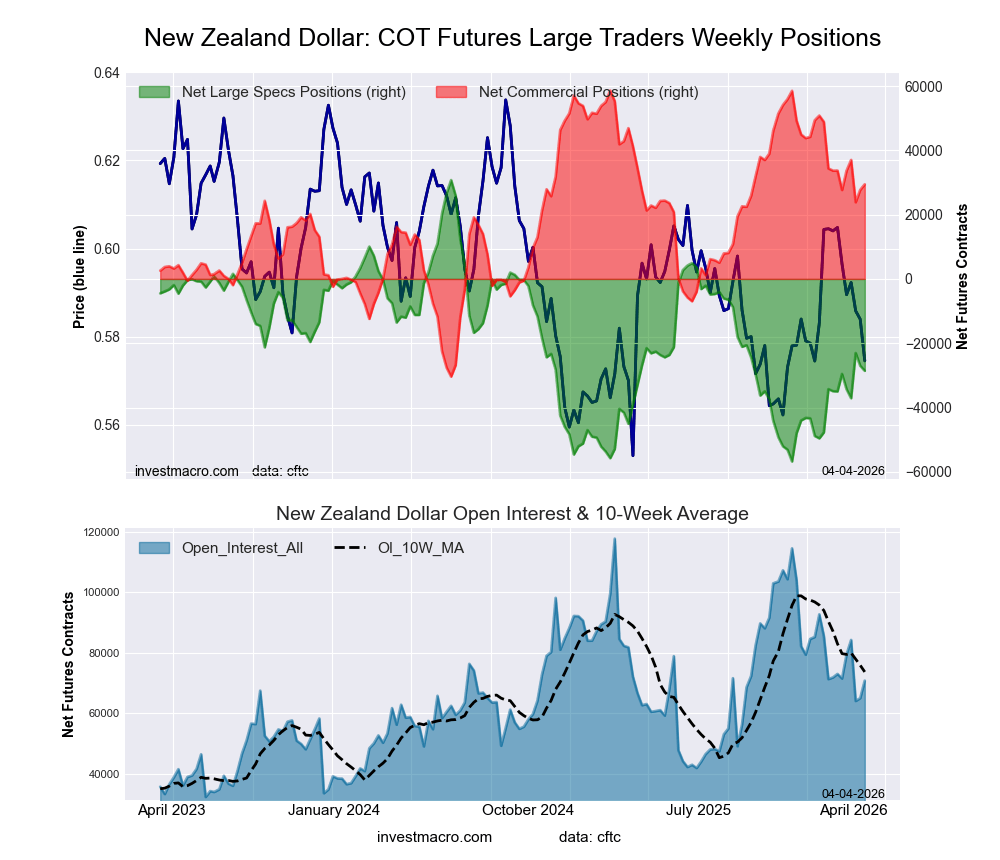
New Zealand Dollar Futures:
The New Zealand Dollar large speculator standing this week was a net position of -28,588 contracts in the data reported through Tuesday. This was a weekly fall of -1,582 contracts from the previous week which had a total of -27,006 net contracts.
This week’s current strength score (the trader positioning range over the past three years, measured from 0 to 100) shows the speculators are currently Bearish with a score of 32.2 percent. The commercials are Bullish with a score of 67.2 percent and the small traders (not shown in chart) are Bearish with a score of 41.2 percent.
Price Trend-Following Model: Weak Uptrend
Our weekly trend-following model classifies the current market price position as: Weak Uptrend.
| NEW ZEALAND DOLLAR Statistics | SPECULATORS | COMMERCIALS | SMALL TRADERS |
| – Percent of Open Interest Longs: | 15.1 | 79.0 | 5.3 |
| – Percent of Open Interest Shorts: | 55.4 | 37.4 | 6.5 |
| – Net Position: | -28,588 | 29,446 | -858 |
| – Gross Longs: | 10,663 | 55,919 | 3,735 |
| – Gross Shorts: | 39,251 | 26,473 | 4,593 |
| – Long to Short Ratio: | 0.3 to 1 | 2.1 to 1 | 0.8 to 1 |
| NET POSITION TREND: | |||
| – Strength Index Score (3 Year Range Pct): | 32.2 | 67.2 | 41.2 |
| – Strength Index Reading (3 Year Range): | Bearish | Bullish | Bearish |
| NET POSITION MOVEMENT INDEX: | |||
| – 6-Week Change in Strength Index: | 7.3 | -4.8 | -28.1 |
Mexican Peso Futures:
The Mexican Peso large speculator standing this week was a net position of 57,684 contracts in the data reported through Tuesday. This was a weekly lowering of -16,392 contracts from the previous week which had a total of 74,076 net contracts.
This week’s current strength score (the trader positioning range over the past three years, measured from 0 to 100) shows the speculators are currently Bearish with a score of 41.9 percent. The commercials are Bullish with a score of 57.1 percent and the small traders (not shown in chart) are Bearish with a score of 38.8 percent.
Price Trend-Following Model: Weak Uptrend
Our weekly trend-following model classifies the current market price position as: Weak Uptrend.
| MEXICAN PESO Statistics | SPECULATORS | COMMERCIALS | SMALL TRADERS |
| – Percent of Open Interest Longs: | 51.2 | 45.2 | 3.0 |
| – Percent of Open Interest Shorts: | 19.8 | 78.2 | 1.4 |
| – Net Position: | 57,684 | -60,576 | 2,892 |
| – Gross Longs: | 94,183 | 83,284 | 5,529 |
| – Gross Shorts: | 36,499 | 143,860 | 2,637 |
| – Long to Short Ratio: | 2.6 to 1 | 0.6 to 1 | 2.1 to 1 |
| NET POSITION TREND: | |||
| – Strength Index Score (3 Year Range Pct): | 41.9 | 57.1 | 38.8 |
| – Strength Index Reading (3 Year Range): | Bearish | Bullish | Bearish |
| NET POSITION MOVEMENT INDEX: | |||
| – 6-Week Change in Strength Index: | -18.7 | 19.1 | -9.2 |
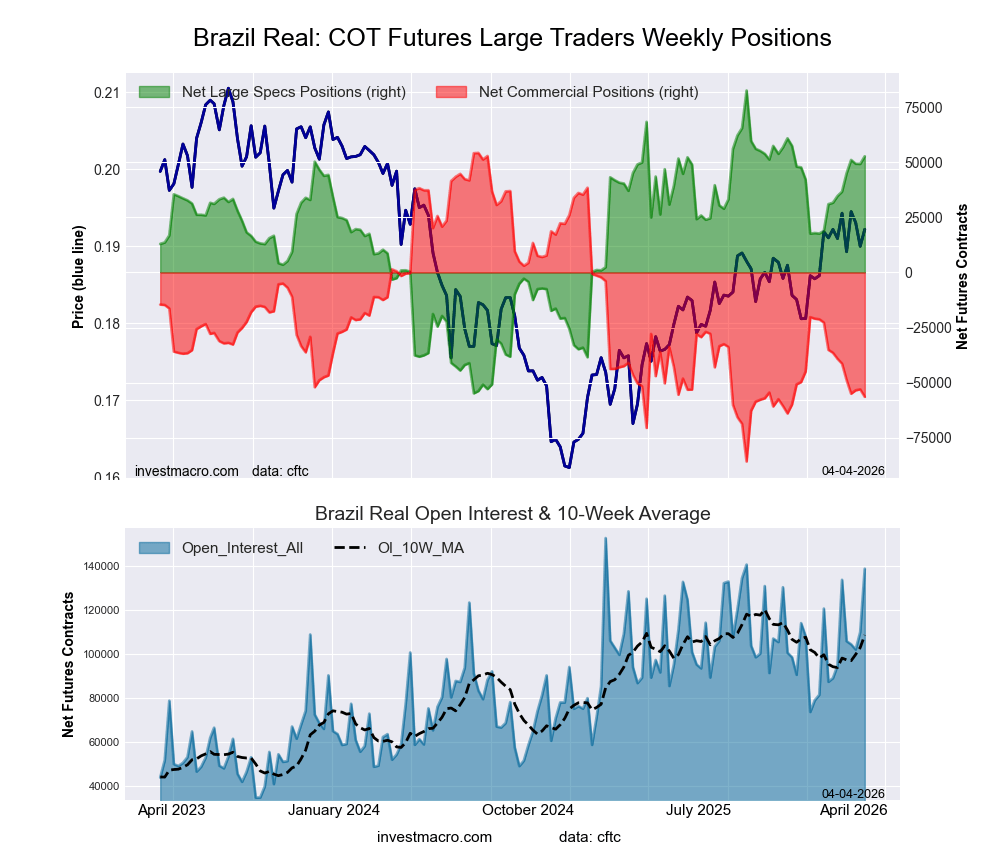
Brazilian Real Futures:
The Brazilian Real large speculator standing this week was a net position of 52,711 contracts in the data reported through Tuesday. This was a weekly lift of 3,463 contracts from the previous week which had a total of 49,248 net contracts.
This week’s current strength score (the trader positioning range over the past three years, measured from 0 to 100) shows the speculators are currently Bullish with a score of 78.3 percent. The commercials are Bearish with a score of 20.9 percent and the small traders (not shown in chart) are Bearish with a score of 42.1 percent.
Price Trend-Following Model: Strong Uptrend
Our weekly trend-following model classifies the current market price position as: Strong Uptrend.
| BRAZIL REAL Statistics | SPECULATORS | COMMERCIALS | SMALL TRADERS |
| – Percent of Open Interest Longs: | 59.8 | 28.8 | 3.4 |
| – Percent of Open Interest Shorts: | 21.7 | 69.6 | 0.7 |
| – Net Position: | 52,711 | -56,481 | 3,770 |
| – Gross Longs: | 82,787 | 39,920 | 4,727 |
| – Gross Shorts: | 30,076 | 96,401 | 957 |
| – Long to Short Ratio: | 2.8 to 1 | 0.4 to 1 | 4.9 to 1 |
| NET POSITION TREND: | |||
| – Strength Index Score (3 Year Range Pct): | 78.3 | 20.9 | 42.1 |
| – Strength Index Reading (3 Year Range): | Bullish | Bearish | Bearish |
| NET POSITION MOVEMENT INDEX: | |||
| – 6-Week Change in Strength Index: | 13.1 | -12.3 | -4.3 |
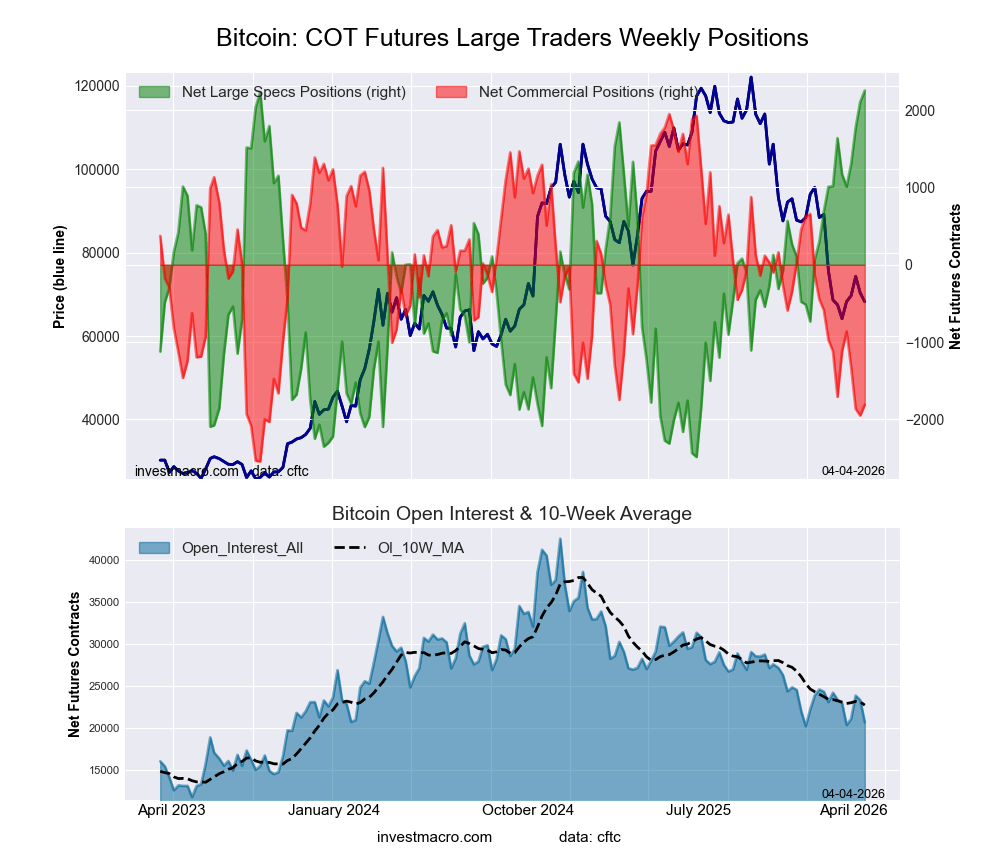
Bitcoin Futures:
The Bitcoin large speculator standing this week was a net position of 2,253 contracts in the data reported through Tuesday. This was a weekly rise of 147 contracts from the previous week which had a total of 2,106 net contracts.
This week’s current strength score (the trader positioning range over the past three years, measured from 0 to 100) shows the speculators are currently Bullish-Extreme with a score of 100.0 percent. The commercials are Bearish-Extreme with a score of 16.3 percent and the small traders (not shown in chart) are Bearish-Extreme with a score of 14.3 percent.
Price Trend-Following Model: Downtrend
Our weekly trend-following model classifies the current market price position as: Downtrend.
| BITCOIN Statistics | SPECULATORS | COMMERCIALS | SMALL TRADERS |
| – Percent of Open Interest Longs: | 72.3 | 0.8 | 3.9 |
| – Percent of Open Interest Shorts: | 61.4 | 9.6 | 6.1 |
| – Net Position: | 2,253 | -1,809 | -444 |
| – Gross Longs: | 14,914 | 168 | 805 |
| – Gross Shorts: | 12,661 | 1,977 | 1,249 |
| – Long to Short Ratio: | 1.2 to 1 | 0.1 to 1 | 0.6 to 1 |
| NET POSITION TREND: | |||
| – Strength Index Score (3 Year Range Pct): | 100.0 | 16.3 | 14.3 |
| – Strength Index Reading (3 Year Range): | Bullish-Extreme | Bearish-Extreme | Bearish-Extreme |
| NET POSITION MOVEMENT INDEX: | |||
| – 6-Week Change in Strength Index: | 13.0 | -2.3 | -26.6 |
Article By InvestMacro – Receive our weekly COT Reports by Email
*COT Report: The COT data, released weekly to the public each Friday, is updated through the most recent Tuesday (data is 3 days old) and shows a quick view of how large speculators or non-commercials (for-profit traders) were positioned in the futures markets.
The CFTC categorizes trader positions according to commercial hedgers (traders who use futures contracts for hedging as part of the business), non-commercials (large traders who speculate to realize trading profits) and nonreportable traders (usually small traders/speculators) as well as their open interest (contracts open in the market at time of reporting).See CFTC criteria here.
All information and opinions on this website and contained in this article are for general informational purposes only and do not constitute investment advice.

- COT Metals Charts: Speculator Bets led by Copper & Palladium Apr 5, 2026
- COT Bonds Charts: Speculator Bets led by SOFR 1-Month this week Apr 5, 2026
- COT Energy Charts: Bloomberg Commodity Index Speculator Bets Surge Higher Apr 5, 2026
- COT Soft Commodities Charts: Sugar Bets continue higher, Soybean Oil Bets at 5-Year High Apr 5, 2026
- Week Ahead: USDInd braces for slew of risk events Apr 3, 2026
- WTI oil prices surged by 11%, breaking above 111 dollars per barrel Apr 3, 2026
- GBP/USD: Geopolitical Tensions Drive Pound Selling Apr 3, 2026
- Investor optimism remains supported by signals of a possible de-escalation in the Middle East Apr 2, 2026
- USD/JPY – Yen Weakens Amid Geopolitical Uncertainty Apr 2, 2026
- Signs of diplomatic dialogue have appeared in the Middle East – markets reacted positively Apr 1, 2026
Source link