We Went 100% Cash Before the NASDAQ Dropped 8.5% — One Signal Told Us When to Get Back In
Enjoy this post? Share the love.

Three weeks before this post, we moved to 100% cash right before the NASDAQ dropped 8.5%. Most traders either tried to pick the bottom and got chopped, or waited for a pullback that never came and missed the recovery entirely.
On April 8th, one specific rule-based signal told us the odds had shifted. We acted on it. Three open positions are now sitting on gains of +23%, +14%, and +12%.
This has nothing to do with luck or better instincts. It comes down to having a methodology that tells you exactly when to act, and being disciplined enough to follow it.
SOH Mode: Sitting on Hands Is a Discipline, Not a Failure
When our model portfolio went 100% to cash ahead of the correction, we entered what our community calls SOH mode — sitting on hands. Capital was protected. No trades were forced. We waited for the next buy signal.
No market goes down forever. That is not an opinion. It is the foundation of everything we do. SOH mode is not giving up. It is the discipline of staying ready without bleeding yourself dry on trades that carry no edge.
Two Traps That Catch Traders Coming Out of a Correction
Two mistakes catch most traders when a market is trying to bottom. Both are predictable. Both are avoidable with the right signal.
The first trap is trying to pick the bottom. During a downtrend, every small bounce looks like the low. Traders buy the first bounce and get stopped out. They try again. The market chops. They bleed small losses and lose their confidence. By the time the real move starts, they have been wrong so many times they no longer trust the signal. Trying to pick the bottom costs you twice: once in your account, once in your conviction.
The second trap is waiting for a pullback that never comes. More disciplined traders hold off and wait for price confirmation. That is solid instinct. But after the NASDAQ formed its low, it moved up six straight days. Traders waiting for a better entry kept waiting. They protected their capital on the way down and missed the recovery on the way up. The market does not owe you a better entry. It just keeps going.
Both traps share the same root cause: no rule-based signal telling you exactly when the odds have shifted. Without one, you are either guessing too early and getting chopped near the bottom, or waiting too long and watching the rally go without you.
What the April 8th IBD Follow-Through Day Signal Actually Looked Like
Two clean technical signals came together on April 8th. The first was an IBD follow-through day. A follow-through day occurs when an index rises at least +1.25% on higher volume than the prior day, at least four sessions after the market has formed a low. This triggered on day six. Volume surged above the prior day’s level and the NASDAQ gained over +2%. A follow-through day signals that institutions, banks, mutual funds, hedge funds, and pension funds, are starting to step back into the market. That is why it carries real weight.
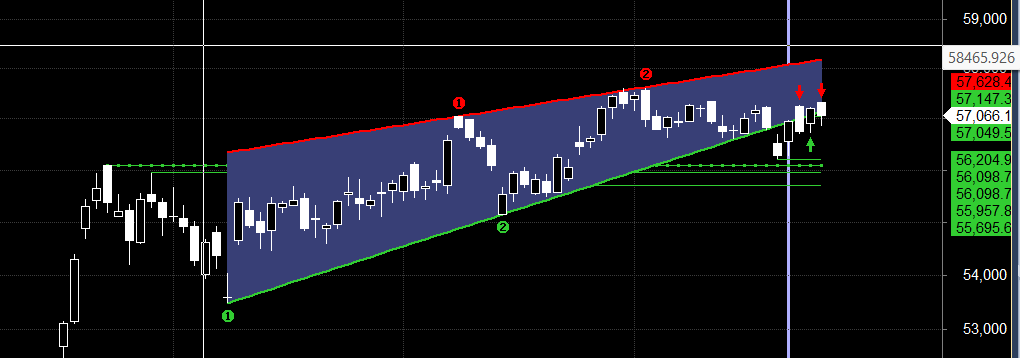
The second signal: the market gapped above its 50-day moving average and held it, in both the NASDAQ and the S&P 500. The 50-day moving average is a key line for intermediate-term trend. In an uptrend, it acts as support. In a downtrend, it acts as resistance. Clearing it cleanly and holding the level was confirmation the tide was shifting.
We were not predicting the bottom was in. We were reacting to what the chart was showing us. On April 8th specifically, the volume profile and price behavior above the 50-day gave us two independent reasons to act. Not a gut feeling, not a guess. That distinction is everything.
Exit criteria were also defined before a single order was placed. A distribution day within a few sessions of the signal, or a close back below the April 8th gap day low without a quick reversal, would have triggered a full reassessment. Neither of those things happened.
The buy signal and the complete methodology behind it, including the position sizing formula covered below, are both walkthrough topics in our free live masterclass. Reserve your spot here:
👉 The Real Reason 90% of Traders Fail — Free Live Masterclass
What We Bought and How We Sized Each Position
We did not jump in with 10 positions at once. We started with a few, watched the price action, and committed to adding more only if the market stayed healthy. The plan was in place before a single order was placed.
On April 9th, we entered Micron ($MU). The price had gapped above its 50-day moving average and was holding that level after getting hammered during the correction. The convergence of the 20 and 8 EMAs just below our entry defined the risk clearly. If price could not hold that cluster, the trade was wrong and we would know it fast. That specific risk definition is what made Micron actionable even though it was not the market leader at that point.
Also on April 9th, we entered Celestica ($CLS) via an intraday trade alert sent to Wagner Daily PRO subscribers. $CLS had been held back by a downtrend line for months. On April 9th, the price broke through that line on strong volume. The alert went out in real time. We entered at $321.98.
That same day, we entered Intuitive Machines ($LUNR) via another intraday alert. Setups do not always wait for the open, which is exactly why we supplement the pre-market report with intraday alerts throughout the session.
On April 16th, we added Corning ($GLW) at $164.50. $GLW was on the watch list back on April 9th, but it never pulled back to our buy price. We canceled the limit order and waited. When it set up again on April 16th, the alert went out and we entered on our terms. The stock came to us. That is the discipline of not chasing.
The Two Trades That Did Not Work and Why That Is Part of the Strategy
Not every trade worked. $ARM was entered on April 10th and stopped out the same day for a -4.3% loss on the stock. PL was entered on April 13th and stopped out the next day for a -6% loss on the stock.
Most traders see those percentages and feel sick. Both trades were intentionally sized so that the maximum loss to the overall trading account was less than -0.25% each. Not -4%. Not -6%. One quarter of one percent. That is position sizing working exactly as designed. The stop was hit, the exit was taken, and we moved on. No second-guessing. No hoping for a bounce.
You cannot hold winners with conviction if you are not willing to cut losers without hesitation. The two are directly connected. That is the methodology.
Where the Open Positions Stand
As of Friday’s close at the time of filming:
- $CLS (Celestica): entered at $321.98, currently up +23% from entry. A partial position (20%) was trimmed at a 21% gain on April 14th to lock in profit. The core 80% is still running.
- $MU (Micron): entered at $405, currently up +12.4% from entry. Still open. Watching for a breakout to a new high.
- $LUNR (Intuitive Machines): entered at $24.20, currently up +14% from entry. Breaking out to new highs. Still open.
Total exposure across the model portfolio sits at 17%. That means 83% remains in cash. We eased back in, selectively deployed capital, and we are not all-in. The market had already moved roughly +5% off the lows when the buy signal triggered. We did not catch the exact bottom. We never tried to. What we caught was the bulk of the move out of the middle, when the odds were in our favor. That is exactly what a rule-based swing trading methodology is designed to do.
The signal was there. We followed it. The rest took care of itself.
Elevate your trading journey with Morpheus Trading and Deron Wagner’s wealth of experience.
Want to go deeper? Join Deron Wagner live every week for our free masterclass — The Real Reason 90% of Traders Fail. Reserve your spot here:
👉 academy.morpheustrading.com/free-trading-masterclass
For daily professional swing trade alerts across stocks, crypto, futures, and Forex, visit The Wagner Daily PRO.
And always remember: trade what you see, not what you think.
Stay Connected:
Stay Informed:
Disclaimer: The information presented in this post is for educational and entertainment purposes only and is not financial advice. We are not financial advisors. Trading can result in loss of funds. Individuals must consider all risk factors including their own personal financial situation before trading. All individuals are responsible for their own trades and investments. Morpheus Trading and affiliates are not responsible for individual loss due to poor trading decisions or any other actions which may lead to loss of funds.
Enjoy this post? Share the love.