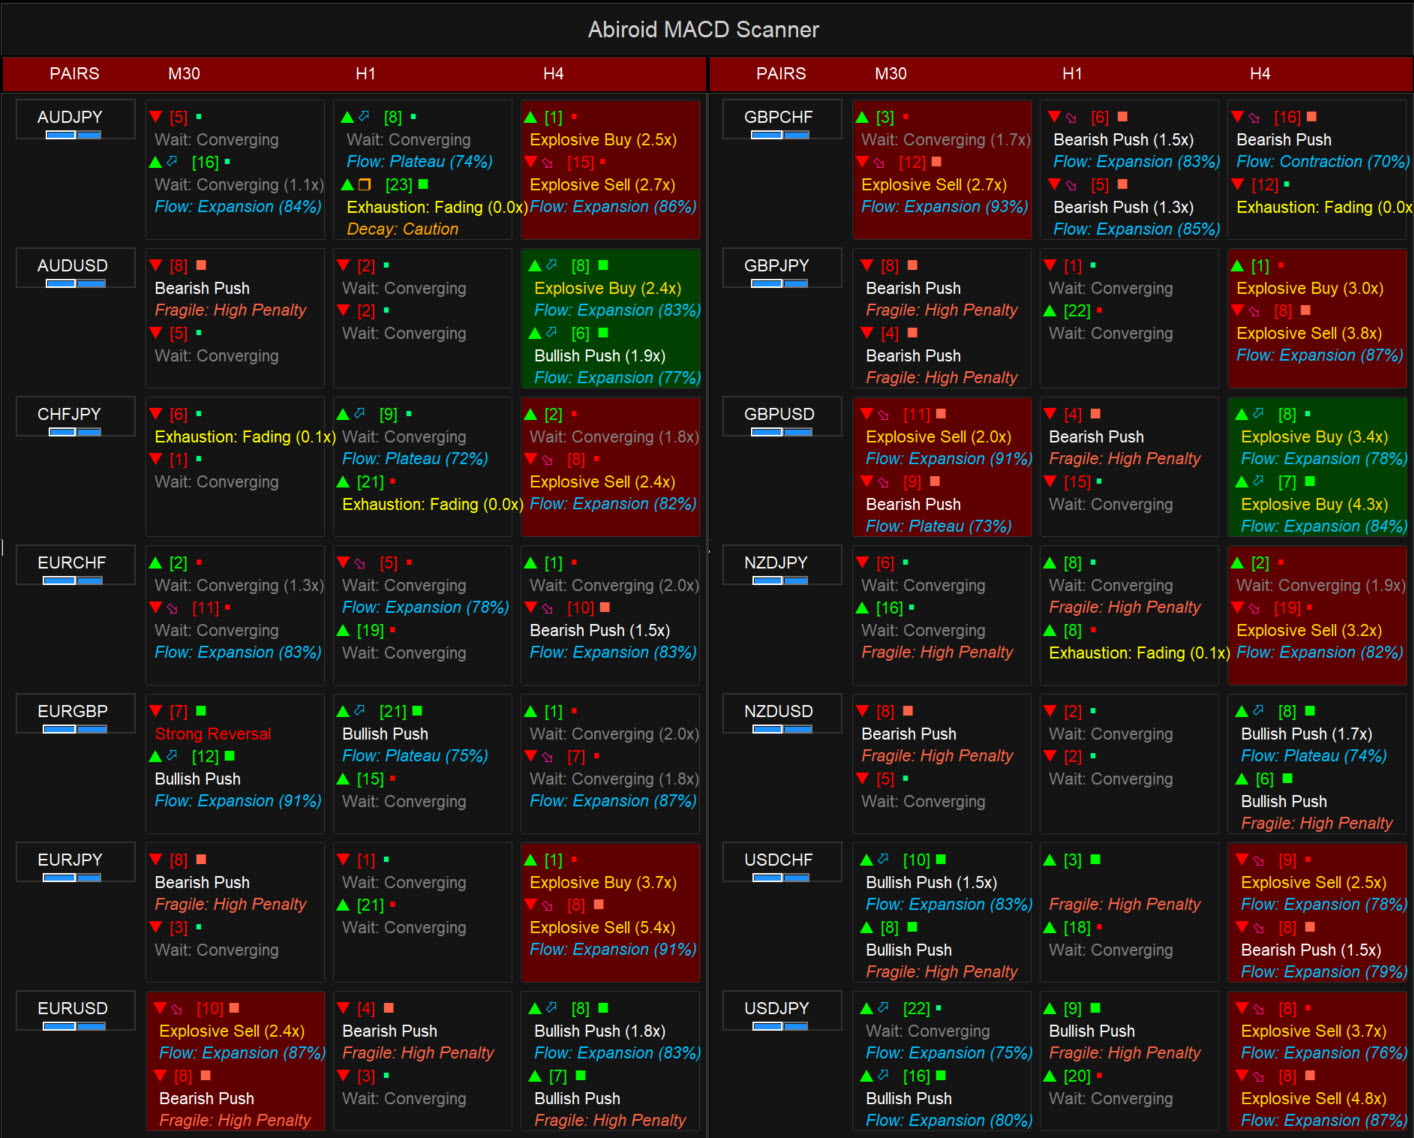
MACD Scanner Dashboard
MT4:
https://www.mql5.com/en/market/product/175519/
Key Features at a Glance
- Multi-Timeframe Scanning: Monitor multiple timeframes (M30, H1, H4, etc.) for each pair simultaneously
- Multiple MACD Configurations: Run up to 5 different MACD parameter sets on the same chart to catch moves at different scales
- Kinetic Flow Filter: Distinguishes between genuine trend momentum and false signals caused by sideways price action
- Divergence Detection: Identifies regular and hidden divergences that often precede major reversals
- Explosive Momentum Alerts: Flags moments when MACD momentum is expanding at an abnormal rate (potential breakout)
- Exhaustion Warnings: Detects when momentum is running out, helping you manage risk before reversals
- Currency Strength Integration: Shows which currencies are structurally strong or weak, providing bias confirmation
- Real-Time Scanning: Updates only when new bars form, preserving system performance
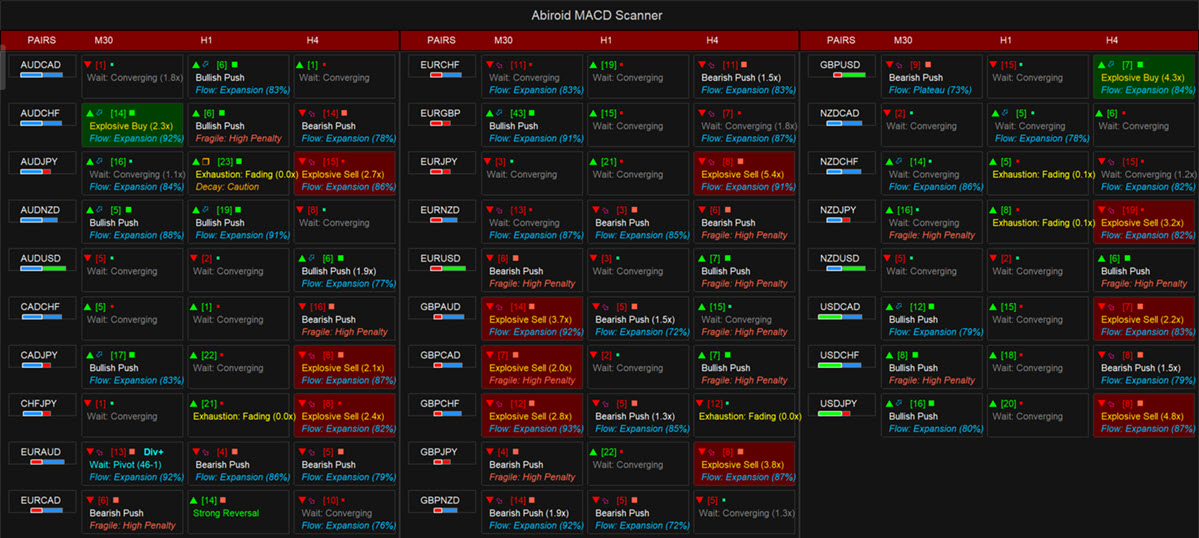
- Multi-Pair Dashboard: View 7 to 28 pairs at once with color-coded signal strength and urgency indicators
What is MACD and Why Does It Matter?
MACD (Moving Average Convergence Divergence) is a momentum indicator that measures the relationship between two exponential moving averages of price. Most traders understand MACD shows when to buy or sell based on crossovers, but this scanner goes deeper. It analyzes:
The MACD Line: This is the core momentum reading. It’s calculated by subtracting the slow exponential moving average from the fast moving average. When this line is above zero, it suggests upward momentum. Below zero suggests downward momentum.
The Signal Line: This is a moving average of the MACD line itself. When the MACD line crosses above the signal line, it’s often viewed as a bullish trigger. When it crosses below, it’s bearish.
The Histogram: The vertical bars you see in the MACD chart represent the distance between the MACD line and the signal line. When the histogram is growing (getting taller), momentum is accelerating. When it’s shrinking (getting smaller), momentum is decelerating—even if the MACD line is still in bullish territory.
This scanner monitors all three components across your entire pair list, identifying moments when multiple signals align to create high-conviction trading opportunities.
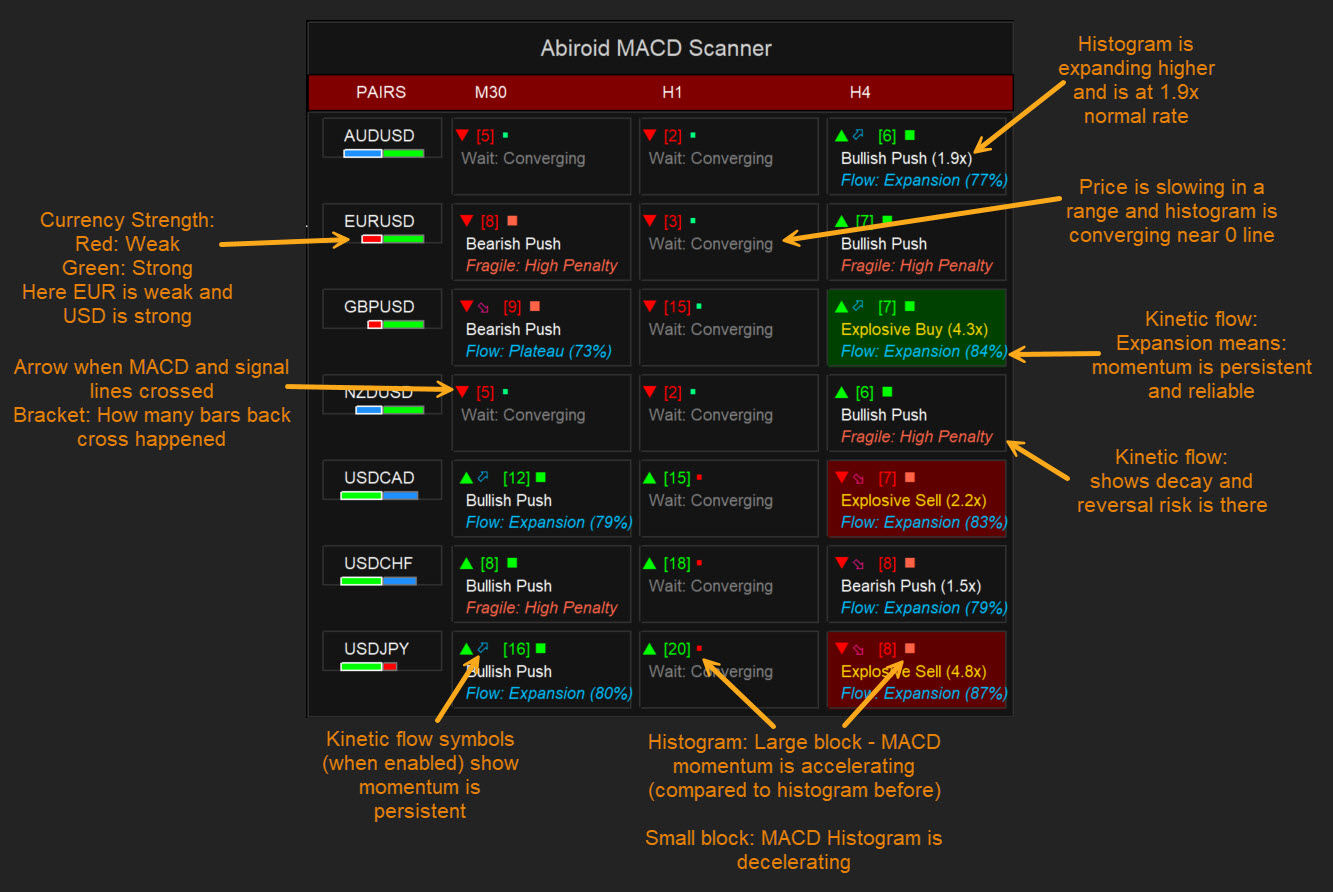
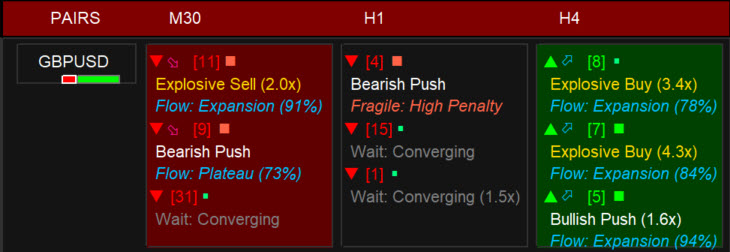
Understanding the Dashboard
The dashboard is organized as a grid with pairs listed on the left and timeframes across the top. Each cell contains a wealth of information presented in an organized layout:
Row 1 – Technical Symbols: You’ll see visual symbols and icons representing different signals:
- A right arrow symbol (displayed in green) indicates a bullish MACD cross. A left arrow symbol (displayed in red) indicates a bearish MACD cross.
- Kinetic flow symbols (when enabled) show momentum state – blue diamond for strong bull flow, pink diamond for strong bear flow, orange symbol for momentum decay, yellow exclamation mark for exhaustion
- Numbers in brackets like “[3]” show how many bars ago the signal occurred. Smaller numbers mean fresher and more actionable signals.
- Histogram state symbols – an up icon (n) shows histogram growing/expanding, a down icon (§) shows histogram shrinking/contracting
- Divergence tags like “Div+” (bullish regular), “Div-” (bearish regular), “hDiv+” (bullish hidden), or “hDiv-” (bearish hidden) highlight divergence signals
Row 2 – MACD Action Text: This is the core momentum recommendation. You might see:
- “Explosive Buy” or “Explosive Sell (2.1x)” – Histogram is expanding at abnormal rate (2.1x normal), signaling potential breakout or acceleration
- “Exhaustion: Fading (1.8x)” – Momentum has reached extremes and is contracting; may precede reversal
- “Wait: Pivot (45-52)” – Divergence detected between bars 45-52; price action may fail at prior highs/lows
- “Wait: Converging (0.8x)” – Histogram is shrinking; momentum losing strength; avoid entries
- “Strong Reversal (1.6x)” – Price crossed zero-line with expanding histogram; high-conviction reversal signal
- “Bullish Push (1.9x)” or “Bearish Push (1.5x)” – Momentum expanding above/below zero with directional persistence
- “Flat: Consolidation (2.3p)” – MACD near zero-line; market in indecision phase; wait for breakout
Row 3 – Kinetic Flow Status: This appears when Kinetic Filter is enabled and shows momentum persistence and quality:
- “Flow: Uptrend Robust (92%)” or “Flow: Downtrend Robust (87%)” – Strong directional bias with high quality score; momentum is persistent and reliable
- “Decay: Bullish Bias” or “Decay: Bearish Bias” – Momentum is losing strength but directional bias remains; start tightening stops
- “Fragile: High Penalty” – Momentum showing inconsistent direction; high risk of whipsaws
- “Exhaustion: 65% Penalty” – Kinetic analysis shows severe decay; reversal risk is elevated
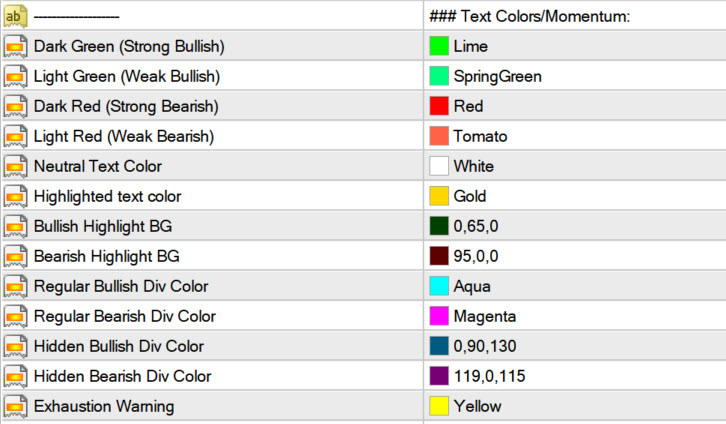
Background Colors: The cell background tells you at a glance the priority level. Bright green or red backgrounds highlight “Explosive” or multi-timeframe confirmations. Neutral colors show developing or fading signals.
How to Use the MACD Scanner in Your Trading
Step 1: Configure Your Pairs and Timeframes
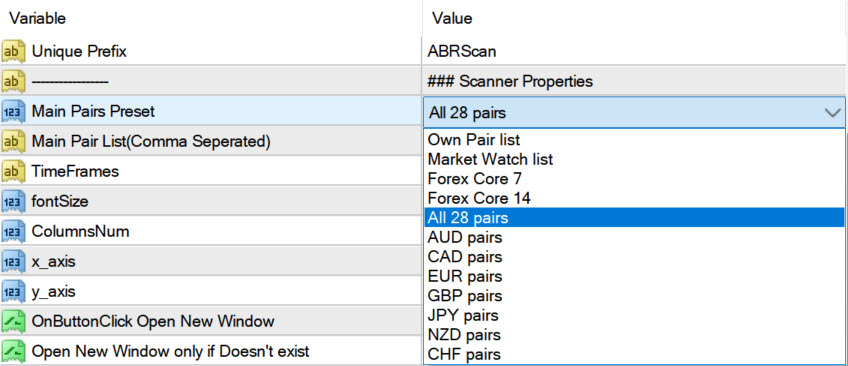
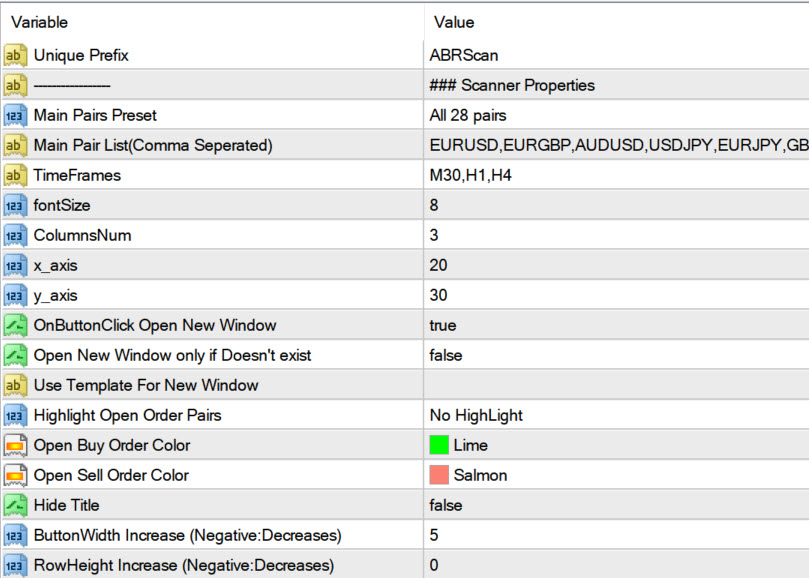
Before the scanner can work, you need to tell it which pairs and timeframes to monitor. In the indicator settings, you’ll find:
Pairs Trading: Select from preset lists (Core 7, Core 14, Core 28) or enter your own comma-separated list. If you want to trade EURUSD, GBPUSD, and AUDUSD, you’d enter them like: EURUSD,GBPUSD,AUDUSD
TimeFrames: List the timeframes you want to scan. M30, H1, and H4 are good starting points. You can scan as many or as few as you like. Be careful not to use too many pairs/timeframes if you already have multiple MACDs. It might take up too much space.
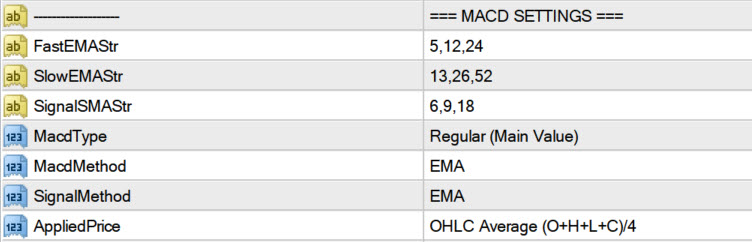
Step 2: Understand Your MACD Settings
The scanner allows you to run multiple MACD configurations simultaneously. This is powerful because it lets you see trends at different speeds.
Standard/Balanced Configuration (Fast 12, Slow 26, Signal 9): This is the classic MACD setup used by most traders. It reacts reasonably quickly to price changes but isn’t too sensitive to noise. Use this if you want a balanced view of momentum. It’s great for swing trading where you hold positions from a few hours to a few days.
Faster Configuration (Fast 5, Slow 13, Signal 6): This responds quickly to price changes. Use this when scalping or trading breakouts on lower timeframes. It will give more signals but can also be whipsawed more easily. However, when this setup shows agreement with slower setups, the signal quality is often very high.
Slower Configuration (Fast 24, Slow 52, Signal 18): This is very smooth and responds slowly to price changes. Use this for longer-term trend confirmation on higher timeframes (H4 and above). It filters out much of the noise and helps you avoid trading against major trends.
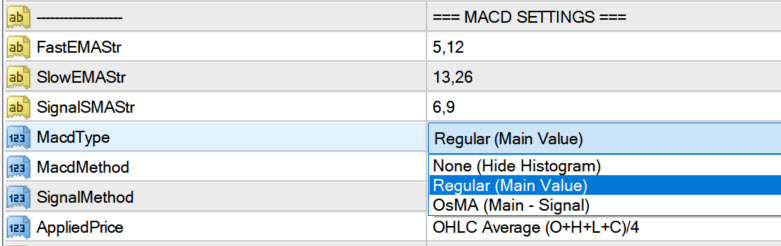
MACD Symbols will be drawn based on the type of histogram you select:
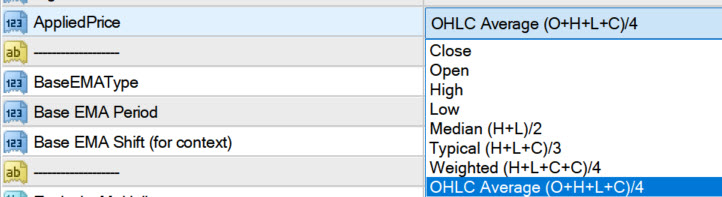
Select Applied Price from drop down:
Each table cell will contain 3 MACD info. Each info will have 3 lines. So when using 3 MACDs, you will get 9 lines per cell.
So to make sure it fits on chart, don’t use too many pairs. And try to increase the number of columns.
Step 3: Use the Color Scheme to Prioritize Signals
The dashboard is color-coded to help you quickly spot the best opportunities:
Bright Green Background: Bullish explosive momentum. Multiple timeframes may be confirming, or momentum is expanding significantly.
Bright Red Background: Bearish explosive momentum. Similar strength as green but pointing downward.
Dark Green or Maroon Cells: Developing bullish or bearish trends, but not yet at extreme momentum.
Gray or Neutral Cells: No strong signal. The MACD is either neutral or fading.
Pro Tip: In scalping mode, prioritize the bright-colored cells with “[1]” or “[2]” recency. These are fresh, strong signals. In swing trading, you can be patient and wait for darker colors to form on higher timeframes.
Step 4: Combine with Currency Strength for Bias
The scanner can display Currency Strength data alongside MACD signals. This tells you which individual currencies are strong or weak structurally.
For example, if you see an “Explosive Buy” signal for EURUSD, check if EUR is showing as strong (high CS reading) and USD is showing as weak (low CS reading). When both align with your MACD signal, conviction is much higher.
Best Stops, Take Profit, and Risk Management
Stop Loss Placement
For Bullish Signals: Place your stop loss below the recent swing low, typically 1.5 to 2 times the current Average True Range (ATR) below entry. This gives the trade room to breathe but protects you if MACD momentum reverses sharply.
For Bearish Signals: Place your stop loss above the recent swing high, using the same ATR multiple.
Tip: Tighter stops (1x ATR) work better for scalping. Wider stops (2-3x ATR) work better for swing trading, as short-term noise won’t shake you out before the move develops.
Take Profit Targets
Explosive Signals: These often run hard. Consider a wider profit target, like 2 to 3 times your risk. For example, if you risk 20 pips, target 40-60 pips.
Strong But Not Explosive Signals: A 1 to 2 risk-to-reward ratio is reasonable. Risk 20 pips, target 20-40 pips.
Use Divergence as a Trail-Stop Trigger: If the scanner flags a divergence, that’s often where the move ends. If you’re in a profitable trade and a divergence appears, consider moving your stop to break-even or taking half profits.
Exhaustion Warnings
When you see “Exhaustion Warning” on a signal, it means the MACD histogram has been pushed to extremes. This doesn’t mean sell immediately, but it’s a yellow light. If you’re holding a profitable position, consider taking profits. If you’re thinking of entering, wait for confirmation that the trend is resuming before adding.
MACD Cheat Sheet: Best Settings by Situation
Scalping (M5, M15)
Use: Fast EMA 5, Slow EMA 13, Signal 6 combined with M30 data.
Why: The faster settings react quickly to price moves on short timeframes. Use M30 as confirmation to filter out false signals on M5.
Trade Style: Quick entries and exits (5-30 minute holds). Multiple trades per day.
Day Trading (M30, H1)
Use: Standard (12, 26, 9) on M30 and H1, with slower (24, 52, 18) on H4 as confirmation.
Why: The standard settings are balanced. Use H4 as a filter to ensure you’re trading with the larger trend.
Trade Style: Hold positions 1-4 hours. Average 3-5 trades per day.
Swing Trading (H1, H4, D1)
Use: Standard (12, 26, 9) on H4 and D1, with fast (5, 13, 6) on H1 for entry timing.
Why: The H4 and D1 show the larger trend. H1 helps you time entries within that trend.
Trade Style: Hold positions 1-5 days. Average 1-2 trades per day.
Trend Following (H4, D1, W1)
Use: Slower (24, 52, 18) on H4 and D1, and standard (12, 26, 9) on W1.
Why: Smoothed MACD filters noise and keeps you in winning trades. W1 confirmation ensures you’re aligned with weekly structure.
Trade Style: Hold positions 5-20 days. Average 1-3 trades per week.
Understanding the Calculations: How MACD Scanner Works
The Core MACD Calculation
The MACD line is created by subtracting the 26-period exponential moving average from the 12-period exponential moving average. An exponential moving average gives more weight to recent prices, making MACD responsive to current price action.
The Signal line is a 9-period exponential moving average of the MACD line itself. This smooths out MACD’s movements and provides crossover signals.
The Histogram is simply MACD minus Signal. When the histogram is positive and growing, momentum is accelerating upward. When it’s negative and shrinking, downward momentum is accelerating.
The Histogram Ratio (Explosive Detection)
The scanner calculates a “histogram ratio” by comparing the current histogram size to the average histogram size over the last 50 bars. If the current histogram is 1.5x larger than normal, something significant is happening. If it’s 2x larger, the scanner flags it as “Explosive.”
Why does this matter? Small MACD crossovers happen all the time, but when a crossover occurs with abnormal histogram expansion, it often signals a real breakout rather than noise.
The Kinetic Flow Filter
Kinetic Flow analyzes how MACD behaves over the last 8 bars. The scanner looks for persistence—is MACD consistently moving in one direction, or is it bouncing around? If MACD shows consistent directional bias for at least 5 bars, it’s considered a “flow state.” If it’s oscillating, it’s “decay.”
This filter helps you avoid trading during choppy, sideways markets where MACD crossovers are random noise.
Divergence Detection
Regular Divergence (Potential Reversal): Price makes a higher high, but MACD makes a lower high. This suggests that even though price is reaching new highs, momentum is weakening. The scanner flags this as a potential reversal signal.
Hidden Divergence (Trend Continuation): Price makes a lower low, but MACD makes a higher low. This suggests weakness in the downtrend—the next move could be a bounce upward. Or price makes a higher high and MACD makes a higher high, confirming trend continuation.
The scanner searches the last 50 bars for divergence patterns, using at least 5 bars between potential pivot points to ensure they’re meaningful, not just noise.
Exhaustion Detection
The scanner tracks how long MACD has been in extreme territory (very positive or very negative). If MACD remains above +0.5 (or below -0.5) for at least 5 bars while the histogram is shrinking, it’s considered “Exhausted.” This often precedes mean-reversion moves where price pulls back sharply.
Zero-Line Context
Whether MACD is above or below zero matters. A bullish crossover that happens below zero is called a “Golden Cross” and often has more follow-through than a crossover that happens above zero (which could be a false breakdown). The scanner tags this context so you can assess signal quality.
Currency Strength Integration
If enabled, the scanner calculates the strength of each currency using one of two modes:
Daily Range Mode: How far has the currency moved today relative to its daily range? If a currency pair closed near the daily high, the base currency is strong. This is fast and reactive to intraday momentum.
SMA Mode: Where is the currency price relative to its moving average? Prices above the moving average and expanding away suggest structural strength. This is slower but more reliable for longer-term positioning.
When you see both a strong MACD signal and currency strength confirmation, conviction is much higher.
Settings Explained: Configuring the Scanner for Your Needs
Essential Settings
Main Pairs Preset: Choose from Core 7 (EURUSD, GBPUSD, AUDUSD, USDJPY, etc.), Core 14 (adds crosses like EURGBP, AUDJPY), or Core 28 (all major and minor pairs). For beginners, Core 7 is sufficient. As you develop, Core 14 or 28 gives more opportunities.
TimeFrames: Enter as comma-separated values: M30,H1,H4. The more timeframes you scan, the more data the system processes. Start with 3 and expand if your system can handle it.
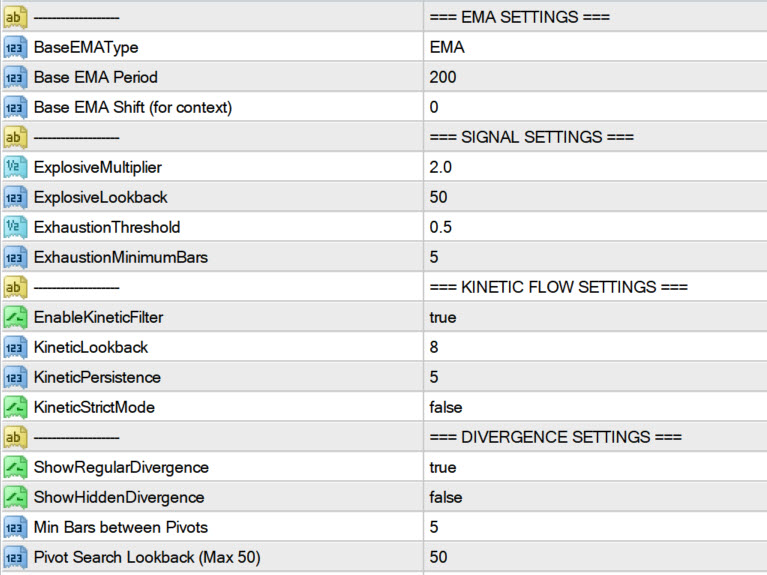
MACD Settings: You can configure up to 5 different MACD parameter sets. By default, the standard (12, 26, 9) is included. Add (5, 13, 6) for faster signals, or (24, 52, 18) for smoother, slower signals. Each adds one row to each cell in the dashboard.
Alert Settings
Alert Enabled: Toggle this to receive alerts when new signals form.
Alert on New Cross: When enabled, you’ll get alerted each time MACD crosses the signal line. Disable this if you find the noise level too high.
Explosive Alert: Set this to only be alerted when MACD momentum is expanding significantly (1.5x normal or higher). This reduces alert volume while keeping high-quality signals.
Kinetic Flow Settings
Enable Kinetic Filter: Toggle on to only flag MACD crosses that have strong directional persistence (not just random bounces).
Kinetic Lookback: How many bars to analyze for directional bias (default 8). Longer lookback = stricter filter.
Kinetic Persistence: How many bars must show consistent direction (default 5 out of 8). Higher number = stricter filter.
Kinetic Strict Mode: When on, requires very strict persistence. Use this in choppy markets to reduce false signals.
Divergence Settings
Show Regular Divergence: Toggle to display potential reversal divergences. Leave on in ranging markets, disable in strong trends.
Show Hidden Divergence: Toggle to display trend-continuation divergences. Useful in trending markets.
Divergence Min Bars: Minimum bars between pivots (default 5). Increase this to find only major divergences.
Divergence Lookback: How far back to search for divergence patterns (default 50 bars). Longer lookback finds older divergences.
Currency Strength Settings (If Enabled)
Use Currency Strength: Toggle to show currency strength data in the dashboard.
CS Mode: Choose “SMA” (structural trend) or “Daily Range” (intraday momentum).
CS MA Period: For SMA mode, how many bars to average (default 20). Longer periods = smoother, more stable readings.
Visual Settings
Font Size: Adjust the text size on the dashboard (default 8).
Columns: How many columns to display (default 2). More columns = smaller text but more pairs visible at once.
Button Width / Row Height: Adjust the size of each pair cell to your preference.
Debug Settings
Show Debug Values: When enabled, the scanner prints detailed calculation logs to the terminal. Useful for understanding what the scanner is doing bar-by-bar.
Debug Pair: Choose which pair to analyze in detail (e.g., EURUSD).
Start Debug Bar: Which bar to start analyzing from (0 = most recent).
Debug For Bars: How many bars to print debug data for.
Advanced Usage Tips
Multi-Timeframe Confirmation Strategy
Don’t trade on a single timeframe. If you see a bullish signal on M30, check if H1 confirms it. If both show explosive momentum in the same direction, you have a high-conviction setup. If they disagree, wait for alignment before trading.
Currency Strength Confluence
Use Currency Strength as a second filter. A “Strong Buy” signal is much more reliable if the base currency is showing as strong and the quote currency as weak. If they contradict, the signal has lower conviction.
Exhaustion as a Profit-Taking Trigger
When you see “Exhaustion Warning,” don’t short the exhaustion immediately. Instead, if you’re long, use it as a signal to move your stop closer or take partial profits. The reversal might not come immediately, but the risk-reward is shifting against you.
Fresh Signal Focus
The “[1]” or “[2]” recency tags show when signals just formed. These are almost always fresher and more actionable than “[8]” or “[10]” signals. In fast markets, age matters—a 10-bar-old signal often isn’t tradeable anymore.
Combining Multiple MACD Setups
Run 3 MACD configurations simultaneously. If all three show bullish signals on the same pair and timeframe, that’s a very strong setup. If only the fastest MACD shows a signal while the slower ones remain neutral, it might be a scalp only—don’t expect a multi-hour trend.
Common Scenarios and How to Trade Them
Scenario 1: Explosive Bull Signal on H1 with Kinetic Flow
This is a high-probability entry setup. The histogram is expanding abnormally, and momentum is showing persistent directional bias. The kinetic filter confirms this isn’t noise.
Trade: Enter on the break of the signal bar’s high (if you’re entering long). Set your stop 1.5x ATR below the signal bar’s low. Target 2x your risk.
Expected Hold Time: 1-4 hours on H1.
Scenario 2: Bullish Cross on M30 but H1 Shows Exhaustion
The M30 is generating a signal, but the higher timeframe is warning that momentum is fading. This is a lower-probability trade.
Trade: If you must trade, use tight stops (1x ATR) and target 1x risk only. Better to wait for H1 to reset before trading.
Scenario 3: Regular Divergence Detected
Price is making higher highs, but MACD is not. The next candlestick or two often brings a reversal. If you’re holding a long position, this is a warning to be ready to exit.
Trade: If holding long, exit half on the divergence warning. If not yet in, wait for price to fail at the highs, then short.
Scenario 4: Kinetic Flow Shows Decay
MACD is oscillating up and down. Crosses are happening but with no persistence. This is a choppy market environment.
Trade: Reduce size or sit out. Wait for Kinetic Flow to show “Bull Flow” or “Bear Flow” before trading. Choppy markets kill directional traders.
Performance Optimization
The MACD Scanner processes a lot of data. To keep your platform running smoothly:
Limit Your Pair Count: Start with 7 pairs (Core 7). Add more only if your system handles it smoothly.
Limit Your Timeframes: Three timeframes (M30, H1, H4) are usually sufficient for most trading styles. Five timeframes on 28 pairs is very compute-intensive.
Disable Unnecessary Features: If you don’t use Hidden Divergences, disable them. If you don’t care about Kinetic Flow, disable it. Every feature you turn off reduces CPU load.
Refresh After Ticks: The scanner only updates when this many ticks have passed. Default is 20. You can increase to 50 or 100 to reduce updates and improve performance.
Troubleshooting
No signals appearing: Check that your pairs are spelled correctly and exist in your broker’s Market Watch. Some brokers add suffixes like “.t” to pair names.
Signals disappearing after one bar: This might be intentional if Kinetic Flow resets. Or your timeframe settings might be wrong. Check the debug output.
Chart lags or freezes: You’re processing too much data. Reduce pair count or timeframes. Increase the “Refresh After Ticks” value.
Currency Strength shows all neutral: Make sure you have enough currency pairs in your Market Watch. Currency Strength needs multiple pairs to calculate strength accurately. If you only have 3 pairs, CS can’t calculate properly.
Conclusion: Trading with Confidence
The MACD Scanner transforms momentum analysis from a single-pair, single-timeframe activity into a comprehensive, multi-dimensional scanning tool. Instead of staring at one chart hoping for a signal, you can now see at a glance where the market is generating momentum-based opportunities across your entire watchlist.
The key is to use the scanner as a filter, not a holy grail. A “Strong Buy” signal doesn’t guarantee profit—it tells you momentum is present. Combine it with proper risk management (appropriate stops and position sizing), Currency Strength confirmation when possible, and multi-timeframe alignment, and you significantly improve your odds.
Start with the default settings and one or two MACD configurations. As you become comfortable with how the scanner works, gradually add complexity. Test different MACD settings on different timeframes. Keep records of which settings work best for your trading style and market conditions.
Remember: the best indicator is the one you understand and trust. Spend time with this scanner, backtest the signals you see, and refine your approach. Over time, you’ll develop an intuition for which signals have the highest probability of follow-through.
Trade with confidence, manage your risk, and let the MACD Scanner guide your focus to where the momentum is. That’s where the best opportunities usually hide.
Source link