The Ultimate Breakout Strategy – The Coiled Spring Indicator Strategy Review | Trading Strategy Guides


If you’ve ever watched a stock explode 10% in a single day and thought “I knew that was coming” — you’re not crazy. There really are patterns that show up before big moves happen. The problem isn’t spotting them in hindsight. The problem is catching them in real time, before the move, consistently enough to actually make money on them.
In this review, we’re going to break down one of the most reliable breakout patterns in trading — the “coiled spring” setup — explain exactly how to identify it manually, and then show you a TradingView indicator that was built specifically to automate the entire process.
We’ll cover:
- What the coiled spring pattern actually is and why it works
- The three things every real breakout has before it happens
- Real trade examples across stocks, ETFs, and commodities
- A full review of the Coiled Spring Pro indicator — including results, features, and pricing
Disclosure: This article contains affiliate links. If you purchase through our link, we may receive a commission at no additional cost to you. Results shown are from real documented trades. Past performance is not indicative of future results. Trading involves substantial risk of loss.
What Is the “Coiled Spring” Pattern in Trading?
The coiled spring pattern refers to a period of extreme price compression — where a stock or asset stops trending and enters a tight sideways range — followed by a sharp, explosive breakout in one direction.
Think of it literally like a spring: the tighter you compress it, the more energy it stores. And when you release it, that stored energy comes out fast. The same physics apply to markets. When a stock compresses into an extremely tight range, both buyers and sellers are in a standoff. Volume dries up. Volatility collapses. And then — when one side finally wins — all of that stored energy releases at once, creating the kind of sharp, fast moves that can double or triple an options trade in a matter of days.
The Coiled Spring Pro indicator running on TradingView — available on any device
This pattern shows up on every timeframe and every asset class — stocks, ETFs, futures, forex, crypto. And it’s one of the few patterns in technical analysis that is both predictive and logical. The compression has to end eventually. The question is just which direction it breaks — and having a system that identifies the highest-probability direction before the move is where the real edge lives.
Why Most Traders Miss the Setup (Or Get Trapped)
Here’s the frustrating reality: most traders see the coiled spring pattern after it’s happened. They watch a stock rip 8% in a day, go back on the chart, and say “oh yeah, it was clearly compressing right there.” But in the moment, when the stock is just sitting there doing nothing for two weeks, it’s almost impossible to know when — or even if — the breakout is coming.
The other common problem is false breakouts. A stock pokes above resistance for one bar and immediately reverses. Traders who chased the initial move get trapped, stop out, and then watch the stock go on to make the actual breakout without them. This happens constantly, and it’s one of the main reasons breakout trading has a reputation for being difficult.
The core challenge: compression is easy to see in hindsight — it’s nearly impossible to act on in real time without a systematic way of measuring it. That’s the gap this review is going to address.
Before we get to the tool, let’s make sure you actually understand what separates a real breakout from a fakeout. There are three things that need to be present for a coiled spring breakout to have real follow-through.
The 3 Things Every Real Breakout Has
After studying hundreds of breakout trades across every market condition, these are the three non-negotiable factors that show up in the setups that work — and are almost always missing in the ones that don’t.
Key #1
Volume Surge
No volume, no breakout — period. When price breaks through a level without a significant volume surge, it’s almost always a trap. The surge tells you that real money — institutions, funds, large traders — is committing to the move. When they pile in, they don’t move quietly. You want to see volume that is at least 40–50% above the recent average on the actual breakout candle. The bigger the surge, the better the follow-through.
Key #2
A Meaningful Price Level Being Broken
Price has to be breaking something that other traders are watching — previous swing highs, multi-week range highs, round numbers, prior resistance zones. When these levels break, stop orders get triggered, short sellers start covering, and breakout buyers pile in. That combination of forced and voluntary buying is what creates the explosive moves. A breakout in the middle of nowhere, without a meaningful level being cleared, is just chop.
Key #3
Volatility Compression Before the Break
The setup has to be there before the move. Price should have been compressing — getting quieter, candles getting smaller, ATR dropping below its average — for at least 5 to 10 bars (and ideally longer) before the breakout candle fires. The longer and tighter the compression, the more energy is stored, and the more explosive the resulting move tends to be.
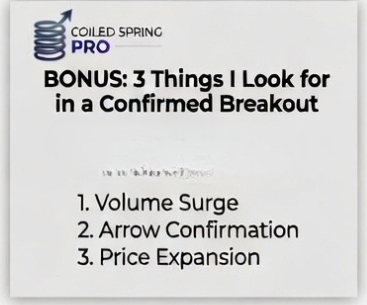
The three keys to a confirmed breakout setup — volume, level, and compression all working together
When all three are present simultaneously — compression, meaningful level, volume surge — you have a high-conviction breakout setup. The tricky part is that monitoring all three conditions across dozens of charts, in real time, while the market is moving, is exhausting. This is where most traders burn out, or miss the signal entirely because they weren’t watching at exactly the right moment.
What the Setup Looks Like: Step by Step
To understand how this plays out in practice, let’s walk through the exact sequence of what happens before, during, and after a coiled spring breakout.
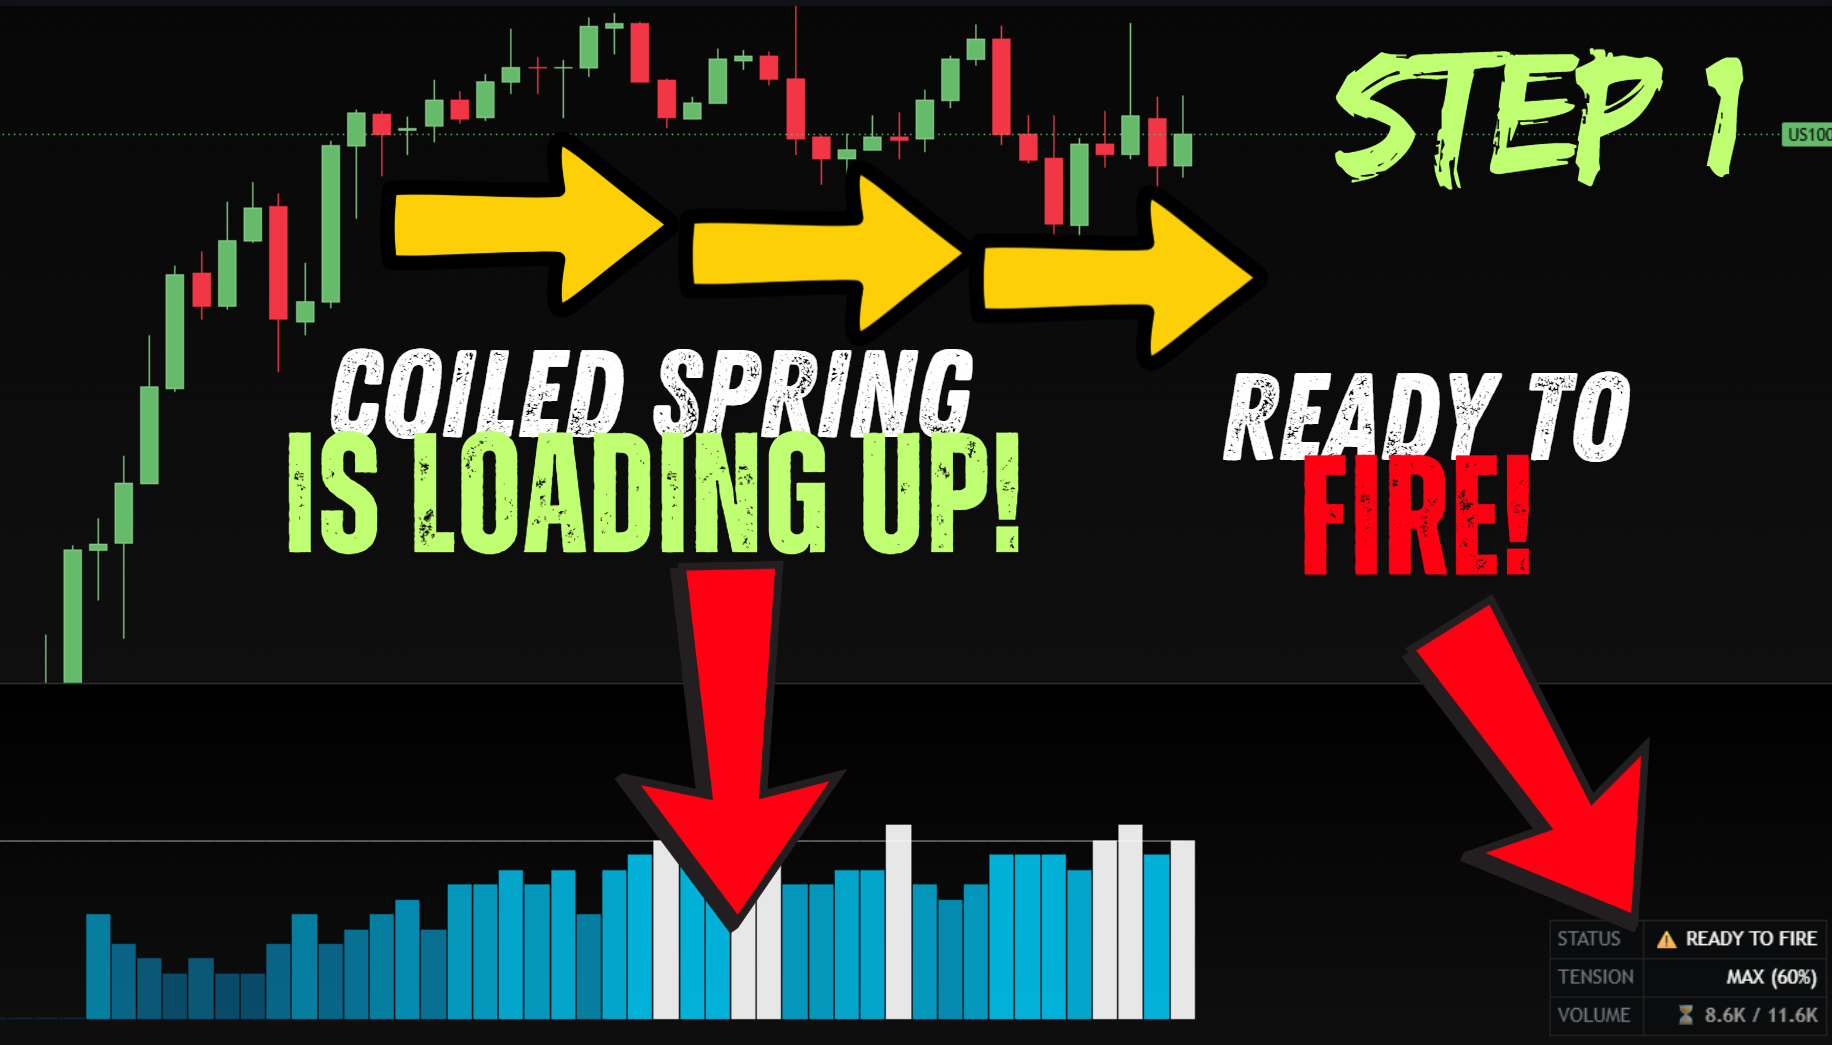
Step 1: Maximum Tension Builds — “Ready to Fire”
In the compression phase, the market is coiling. Moving averages begin to pinch together. Bollinger Bands squeeze inside Keltner Channels. RSI flatlines near 50. Volume dries up below the recent average. None of these things alone are significant — but when all of them happen simultaneously across 15 to 20 different technical conditions, you have a spring that is wound to maximum tension and ready to snap.
Step 1: Maximum tension builds — the indicator signals “Ready to Fire” before the move happens
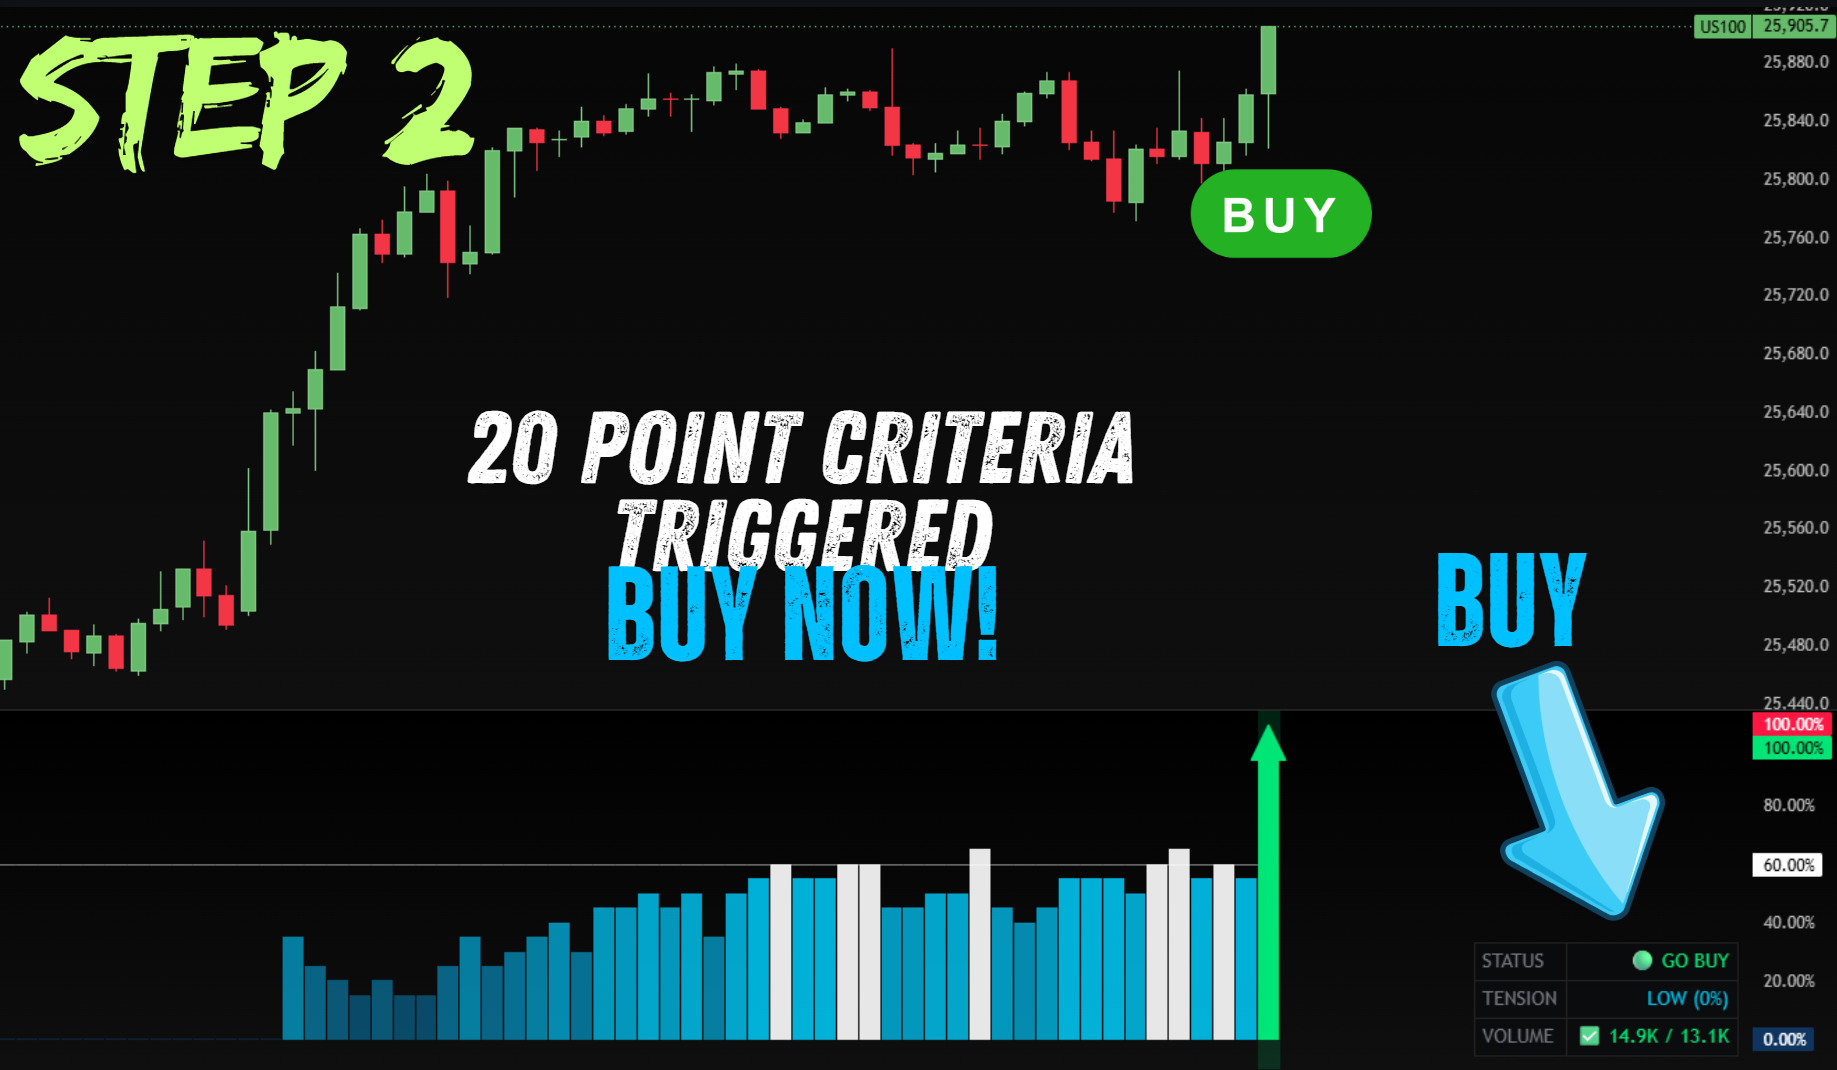
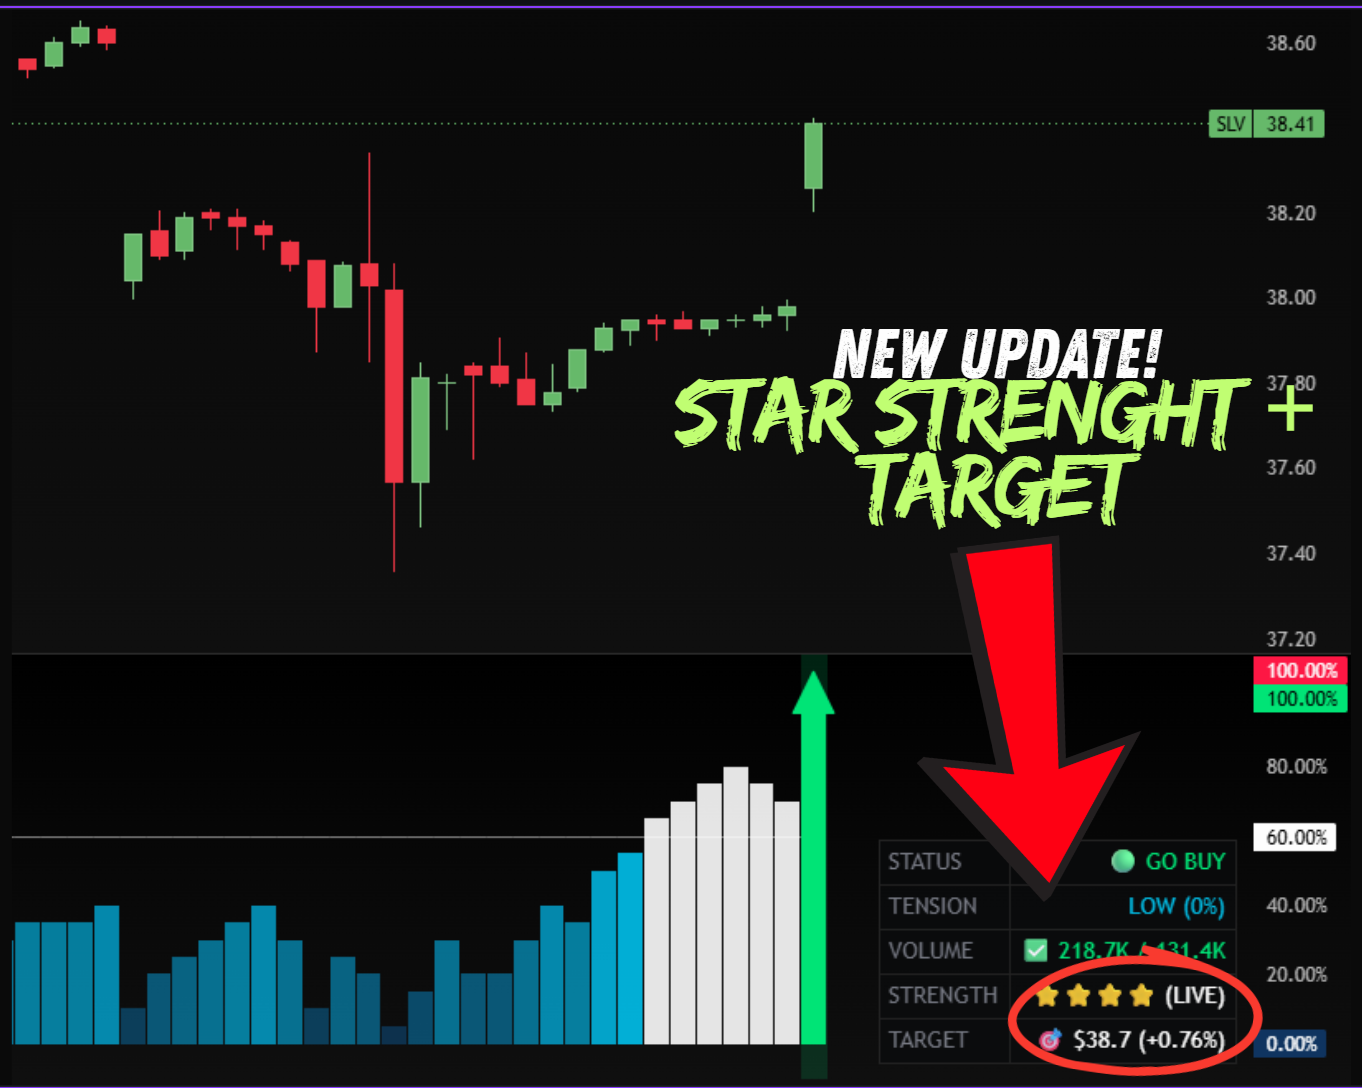
Step 2: The Breakout Signal Fires — “Go Buy” or “Go Sell”
When tension reaches its peak and a volume surge confirms the directional break, the signal fires at bar close. This is the moment of truth — the spring releases. The signal appears on the chart as a clear directional arrow, and a dashboard in the corner of the screen shows the signal strength (star rating), projected target price, and expected move percentage. No ambiguity. No guessing.
Step 2: The signal fires — a clear green “Go Buy” arrow with a projected target price displayed on-screen
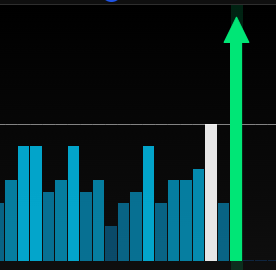
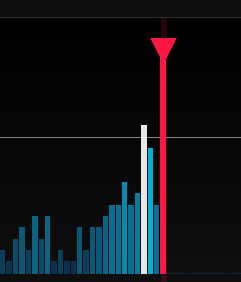
Step 3: The Move Explodes — Ride It to the Target
What happens after the signal fires is what makes this pattern so compelling. Because the compression was so tight, the release tends to be sharp and fast. Price often rips toward the projected target in a straight line, with very little pullback, as the trapped energy unwinds. This is what creates the outsized options returns — a fast directional move right after a low-volatility period, which means you bought your options when they were cheap.
Step 3: Price explodes immediately after the confirmed signal — this is what the follow-through looks like
There’s an Easier Way to Find These Setups
Everything we’ve described above — monitoring 20 simultaneous technical conditions, checking volume surge thresholds, watching for key level breaks, calculating signal strength — is exactly what the Coiled Spring Pro indicator does automatically, on every chart, on every bar, in real time.
Instead of spending hours scanning charts and doing math in your head, you just add the indicator to any ticker in TradingView and let it do the work. The tension meter climbs as conditions align. When it hits the armed threshold, it alerts you. And when the snap fires, it shows you exactly where it happened, what the strength rating is, and what the projected target is.
A clean green “Spring Up” buy signal — the indicator does all the analysis and shows you exactly when to act
And when the spring snaps down — a clean red “Spring Down” sell signal for the short side
Coiled Spring Pro Review: How the Indicator Works
Coiled Spring Pro is a custom TradingView indicator developed by Ben Losier of FindBetterTrades.com. It runs a proprietary 20-element tension matrix that simultaneously measures moving average compression, volatility contraction, oscillator behavior, and volume patterns — all weighted and combined into a single tension score from 0 to 100%.
Here’s a quick breakdown of how the system works:
The 20-Element Tension Matrix
The indicator monitors 20 separate technical conditions at the same time. Each condition that aligns adds to the tension score. When enough conditions align simultaneously — typically around 60% or more — the spring is considered “armed” and ready to fire. The more conditions that align, the higher the star rating and the more explosive the expected move.
The Star Rating System
Not all signals are equal. The indicator uses a 2 to 5 star rating system to grade each signal based on how many elements were in alignment at the time of the snap. A 5-star signal means almost every technical condition was perfectly compressed at once — these are the setups that tend to produce the biggest, fastest moves.
The star rating system grades each signal by compression quality — higher stars mean bigger expected moves
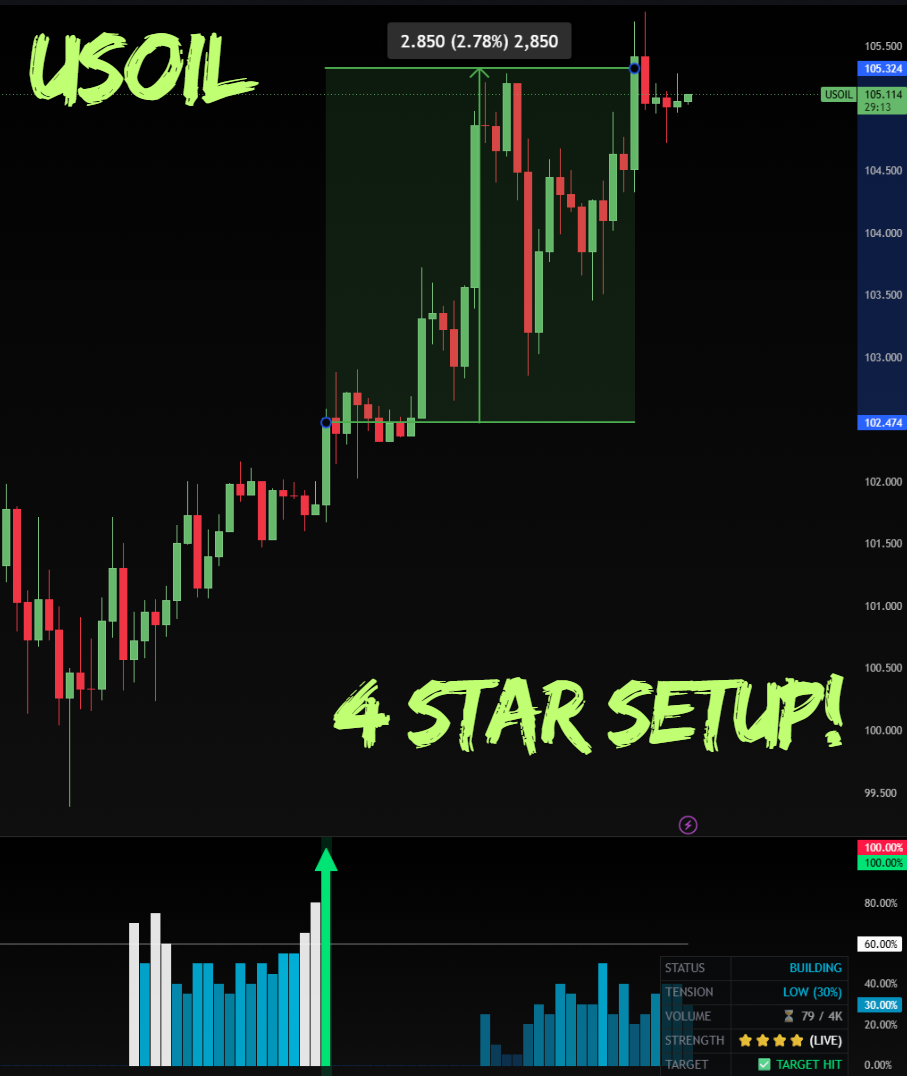
The Live HUD Dashboard
In the bottom-right corner of the chart, a real-time dashboard displays five pieces of information: the current status (Building / Ready to Fire / Go Buy / Go Sell), the tension percentage, volume confirmation status, the current star rating, and the projected profit target. Everything you need to make a decision is visible at a glance — no secondary tools required.
A 4-star USOIL trade — the HUD dashboard shows status, tension, volume, strength, and target all in one place
Real Trade Results — What This Indicator Has Found
Let’s look at some of the documented trade examples from the Coiled Spring Pro signal history. These are real trades on real charts — you can pull up every single one of these in TradingView and see the signal for yourself.
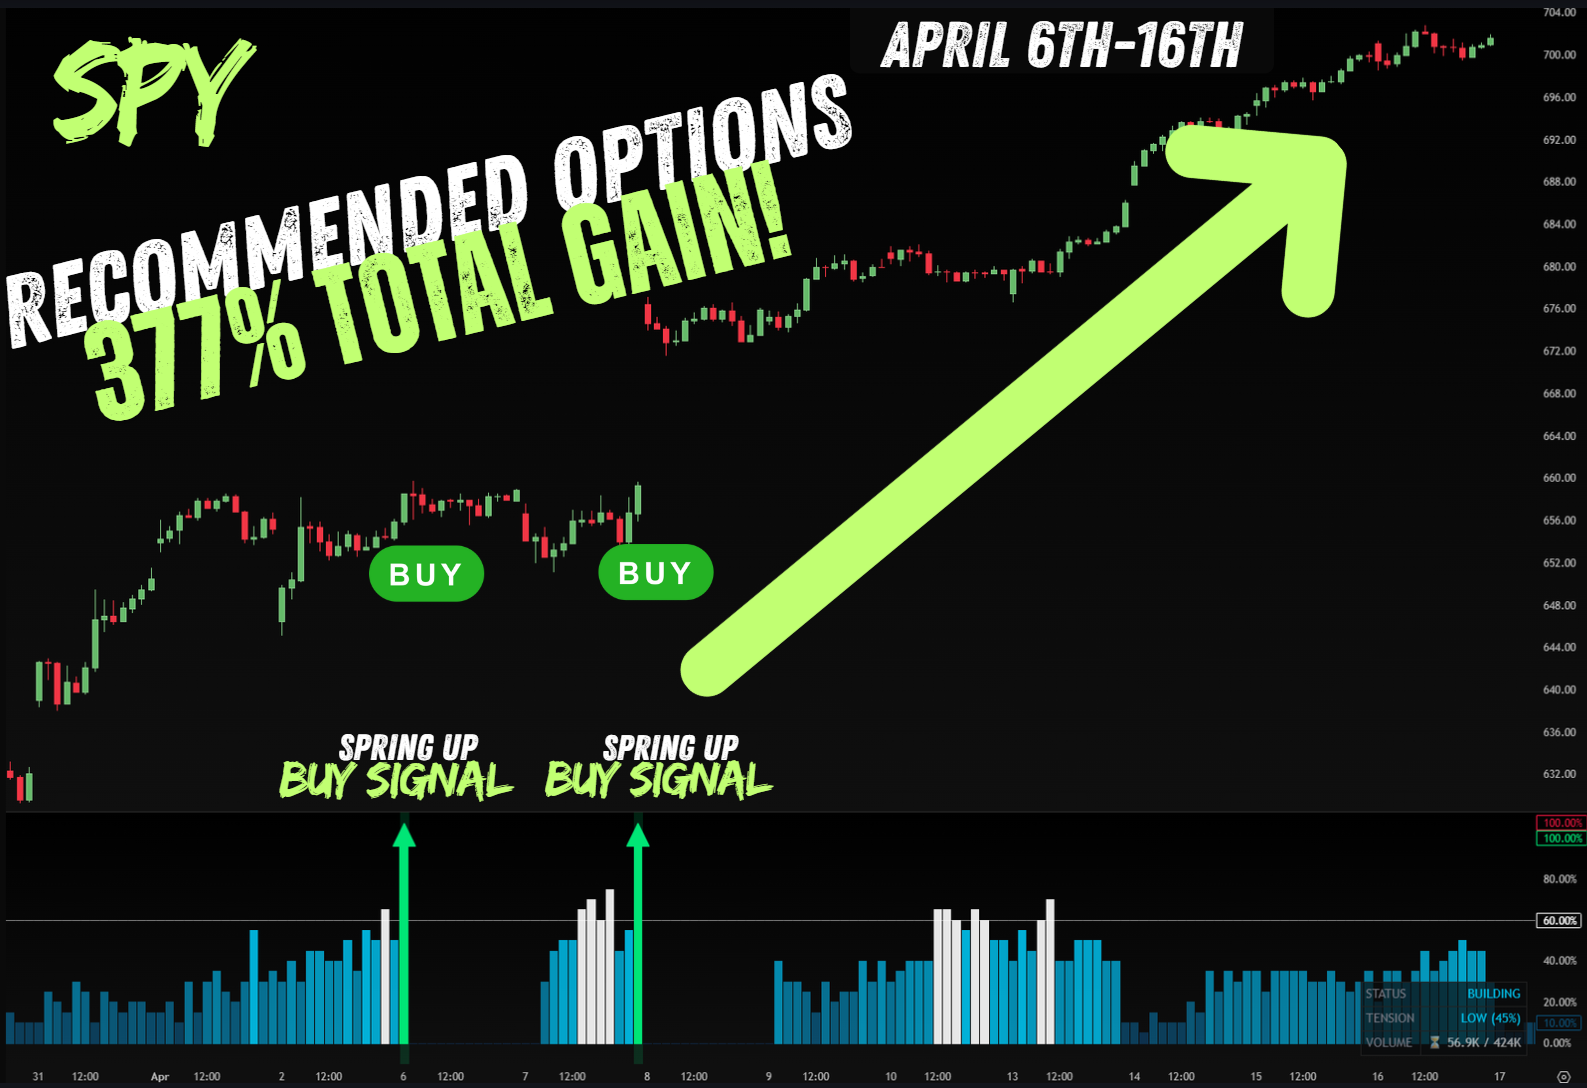
SPY — 377% Options Gain
377%
Options Gain
SPY — Apr 6–16
2
Spring Up Signals
Back-to-back setups
Two flawless Spring Up signals on SPY between April 6th and 16th — resulting in a 377% recommended options gain
Two consecutive “Spring Up Buy Signals” between April 6th and 16th. The indicator caught both setups during a volatile period when most traders were either sitting on their hands or getting chopped up. The signals fired at exactly the right moments and the options positions were carried to massive gains.
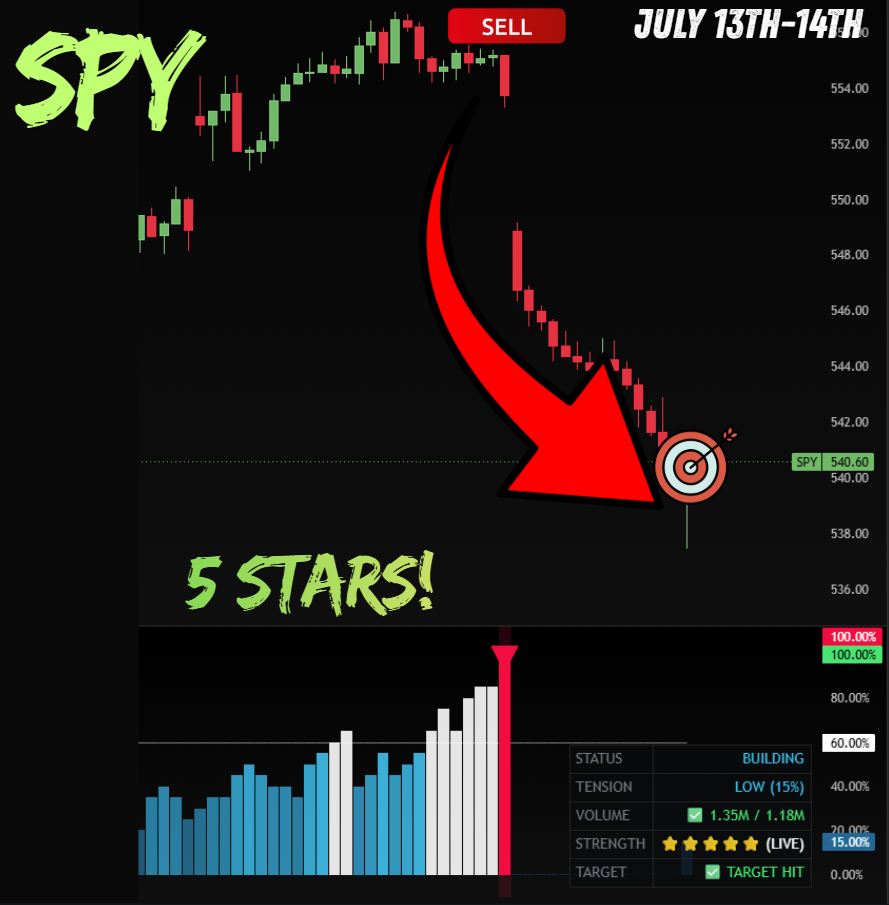
SPY — 5-Star Signal, Target Hit
A 5-star SPY signal — the projected target was displayed on the HUD and then confirmed as “✅ TARGET HIT”
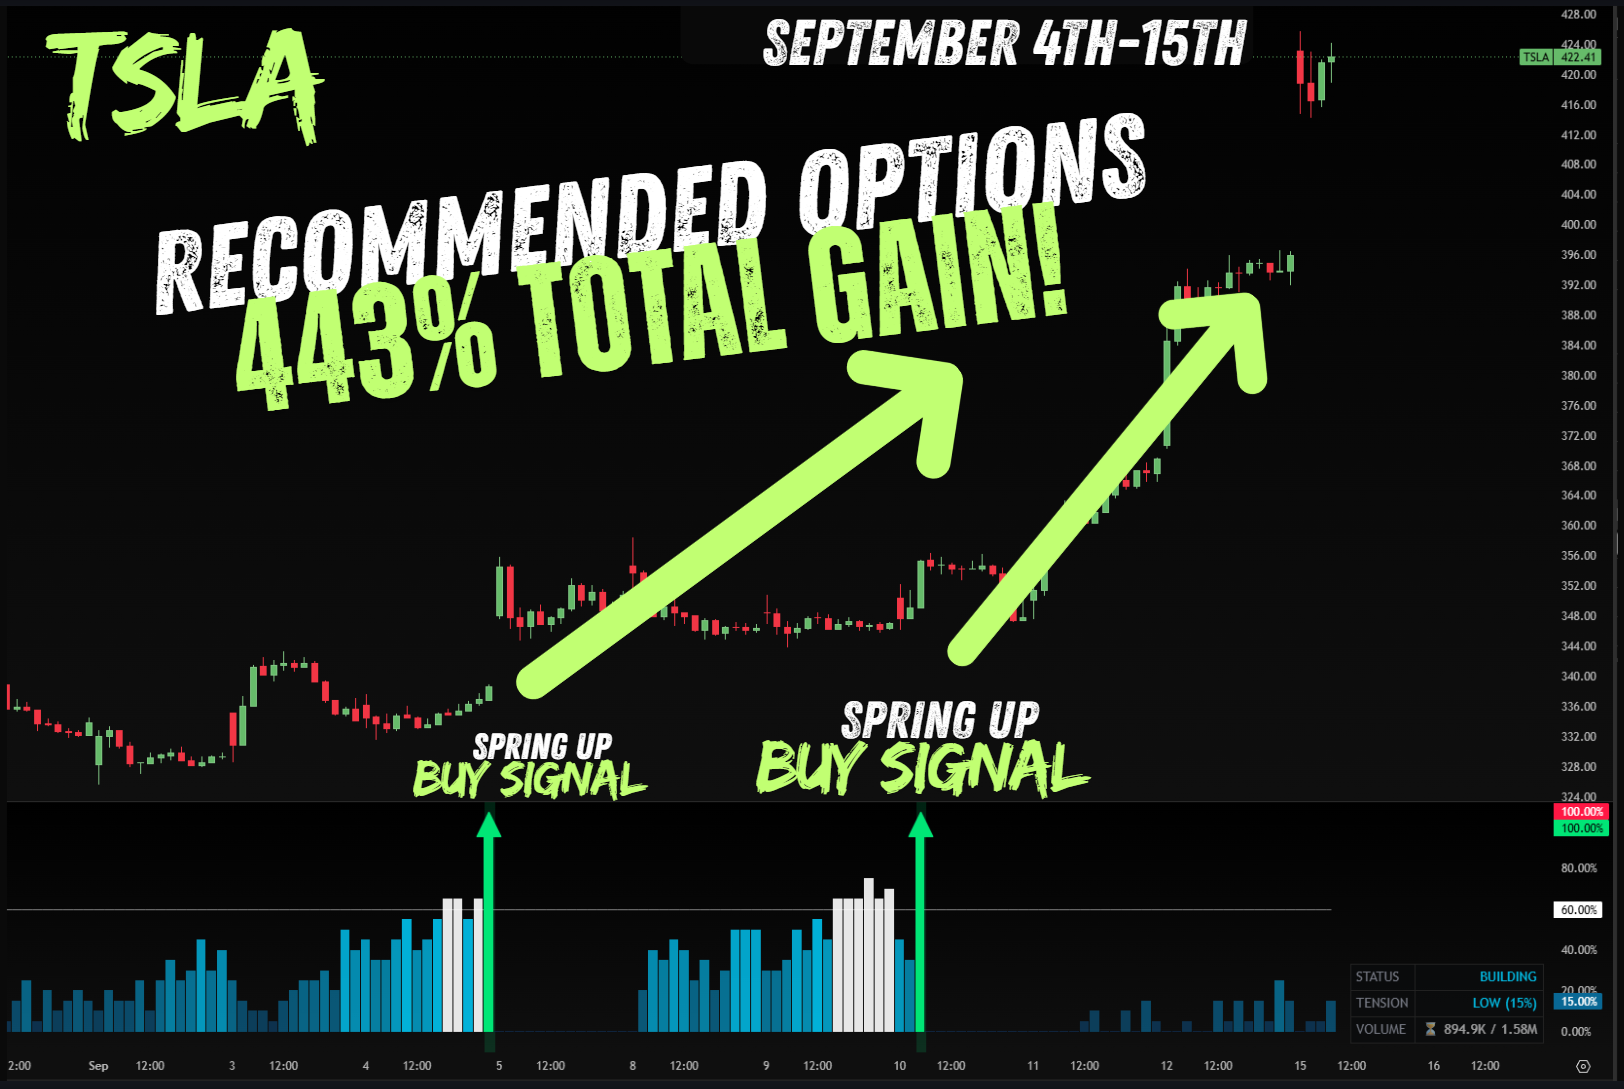
TSLA — 443% Total Gain Across Two Trades
443%
Total Options Gain
TSLA — Sep 4–15
2
Back-to-Back Signals
Both hit target
Back-to-back Spring Up signals on Tesla between September 4th and 15th — 443% combined options gain
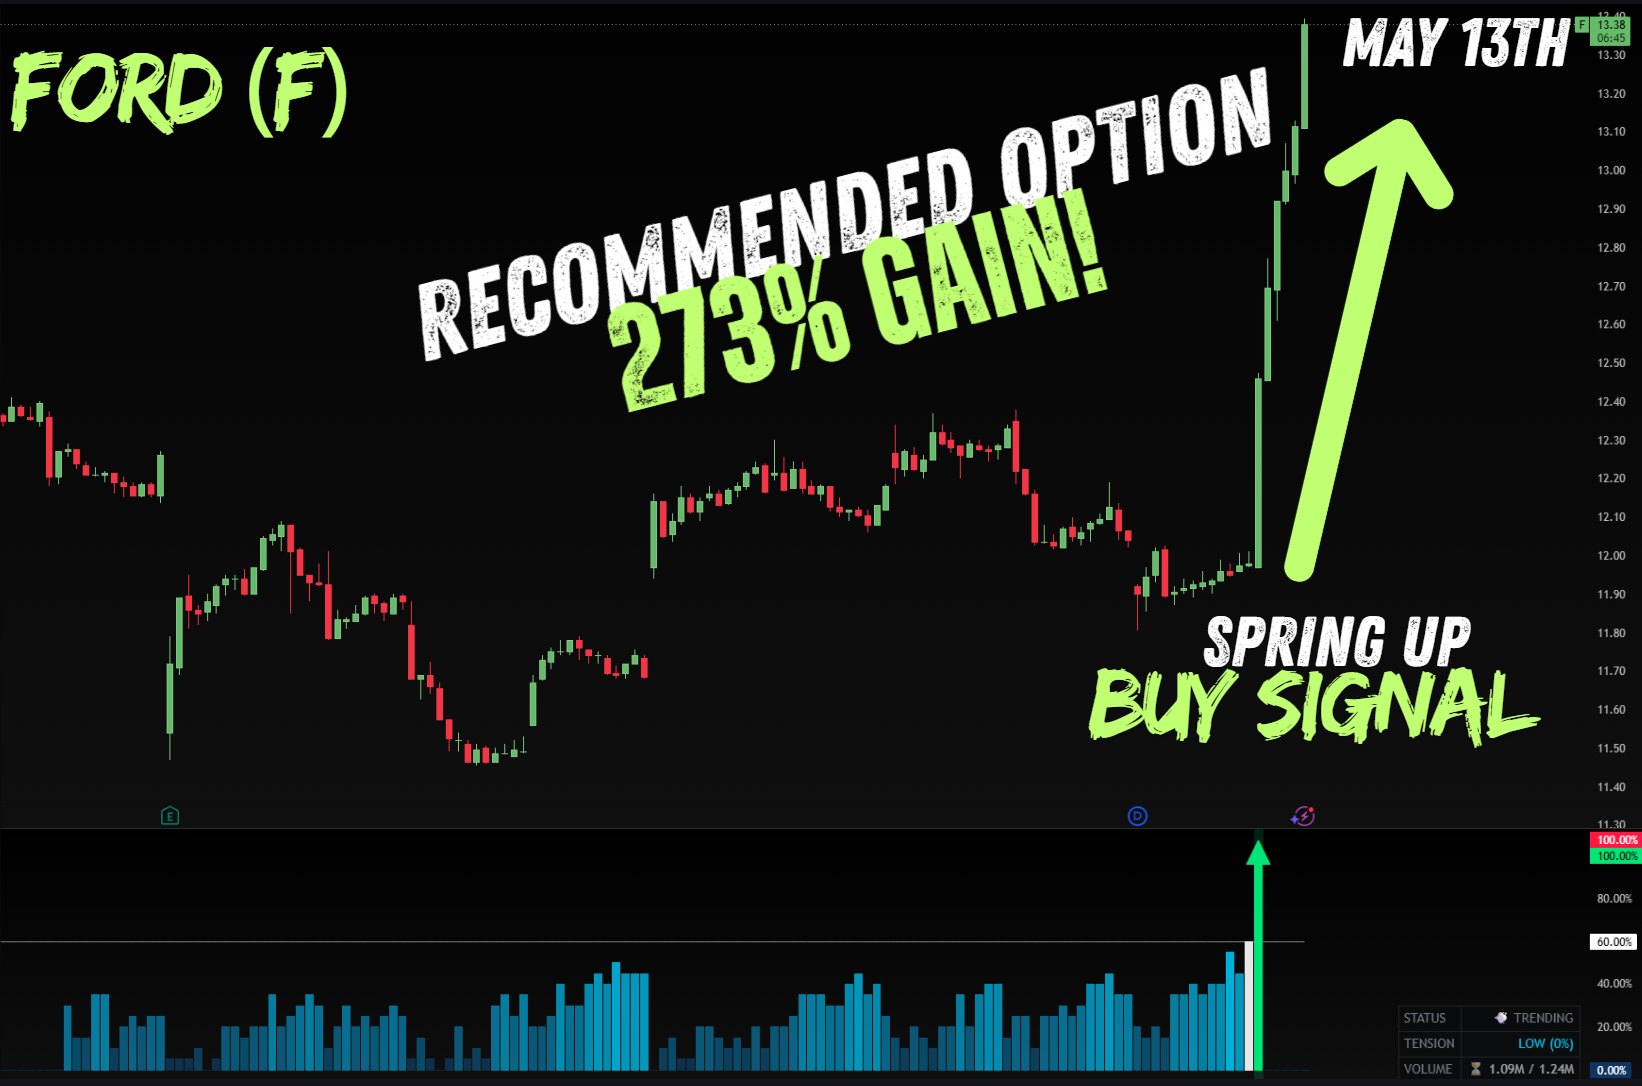
Ford (F) — 273% Gain on a Gap-Up
The Spring Up Buy Signal fired right before a massive gap-up candle on Ford (F) May 13th — 273% options gain
The signal fired right before a massive vertical gap-up candle. This is one of the most powerful applications of the indicator — when the compression is directly under a key level and the signal fires at close, the next session gap creates an immediate multi-hundred-percent options gain on the open.
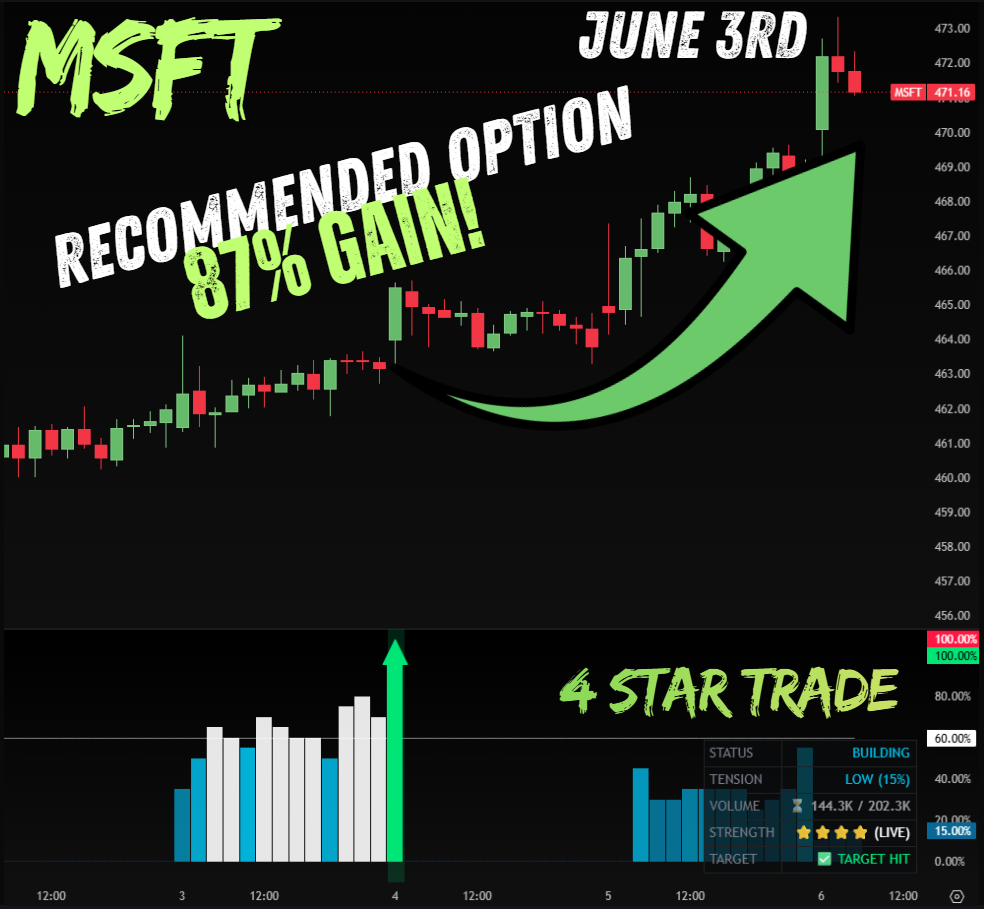
MSFT — 87% Options Gain
MSFT trade — 87% options gain on a clean Spring Up signal
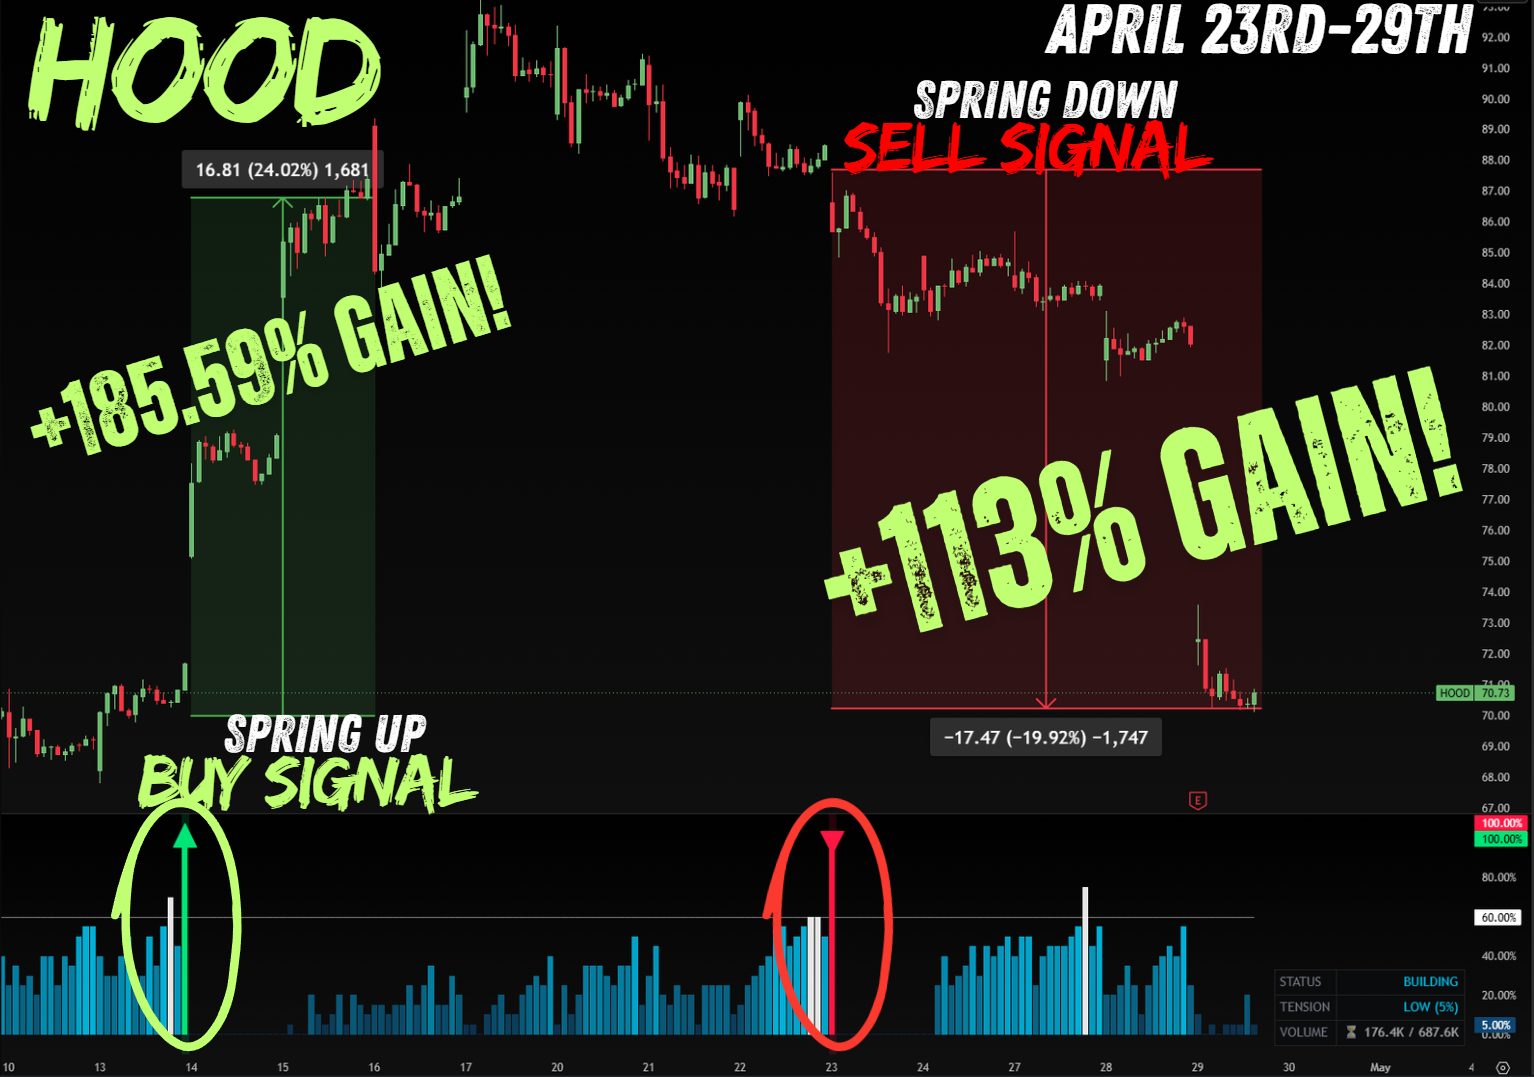
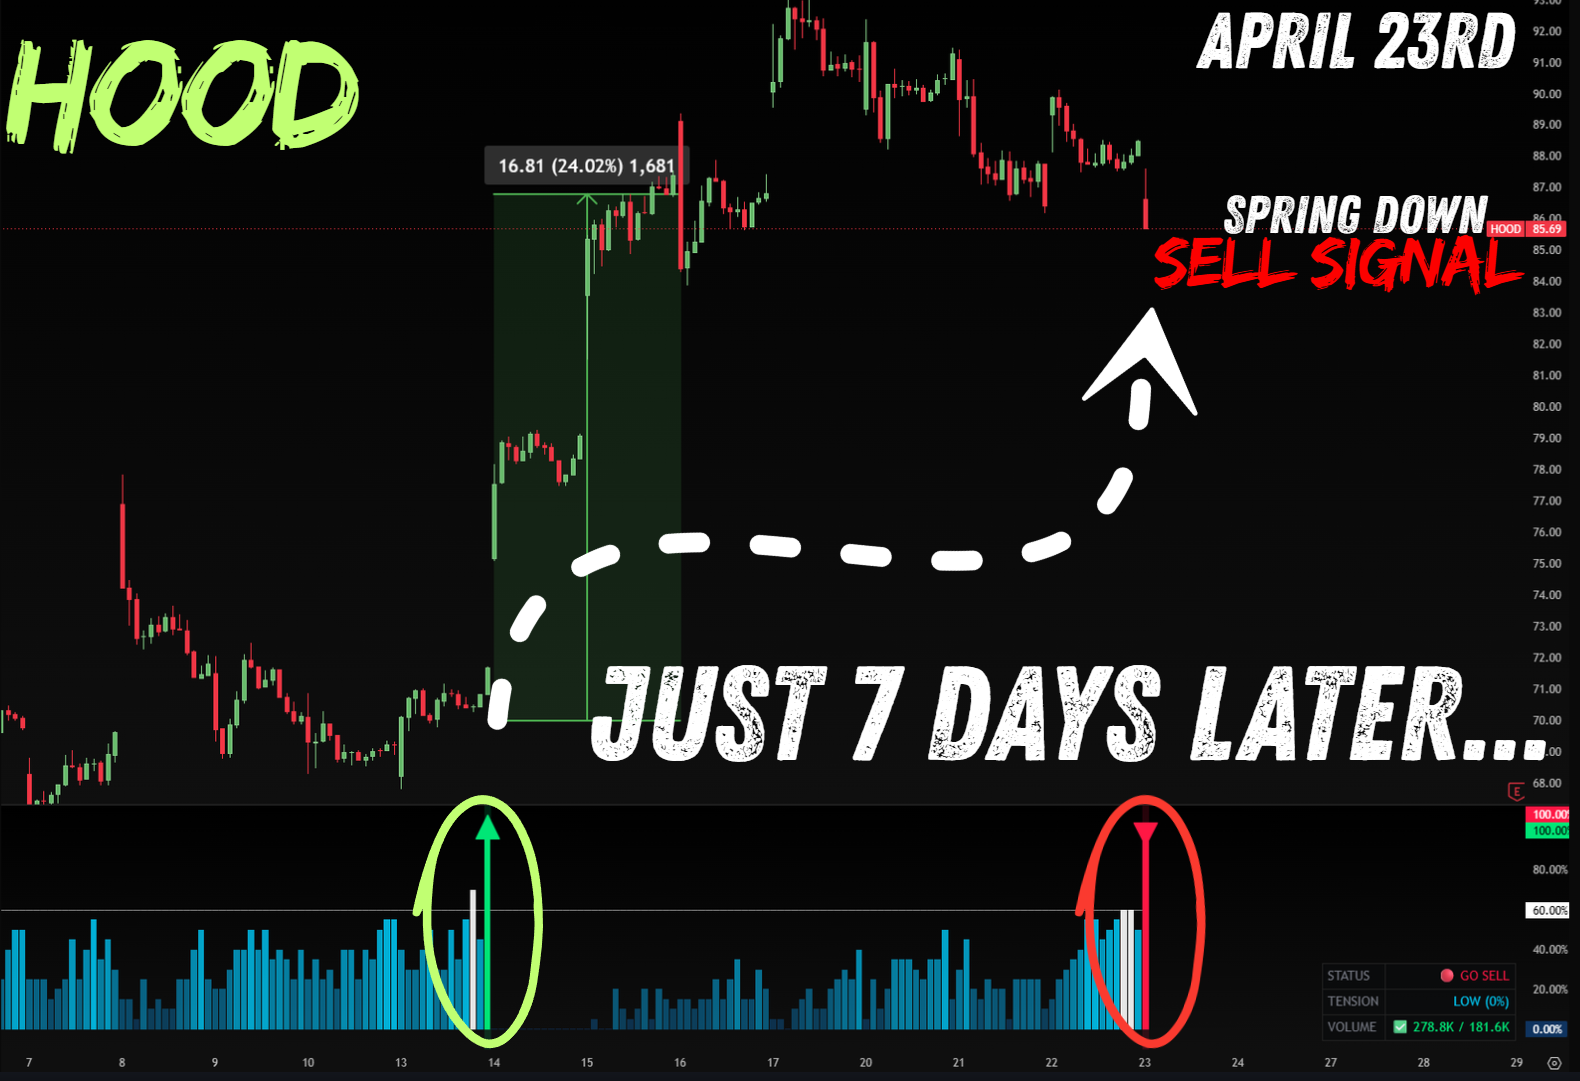
HOOD — Playing Both Sides: +185% Up and +113% Down
This is one of the most impressive sequences in the indicator’s documented history. Coiled Spring Pro caught a massive pump on Robinhood (HOOD) with a Spring Up signal, then just seven days later dynamically flipped to a Spring Down Sell Signal right at the top — catching the dump as well.
HOOD — Spring Up Buy Signal (+185% options gain) followed by a Spring Down Sell Signal just 7 days later (+113%) — playing both sides
The April 14th Buy Signal and the April 23rd Sell Signal — a 7-day flip from max long to max short on HOOD
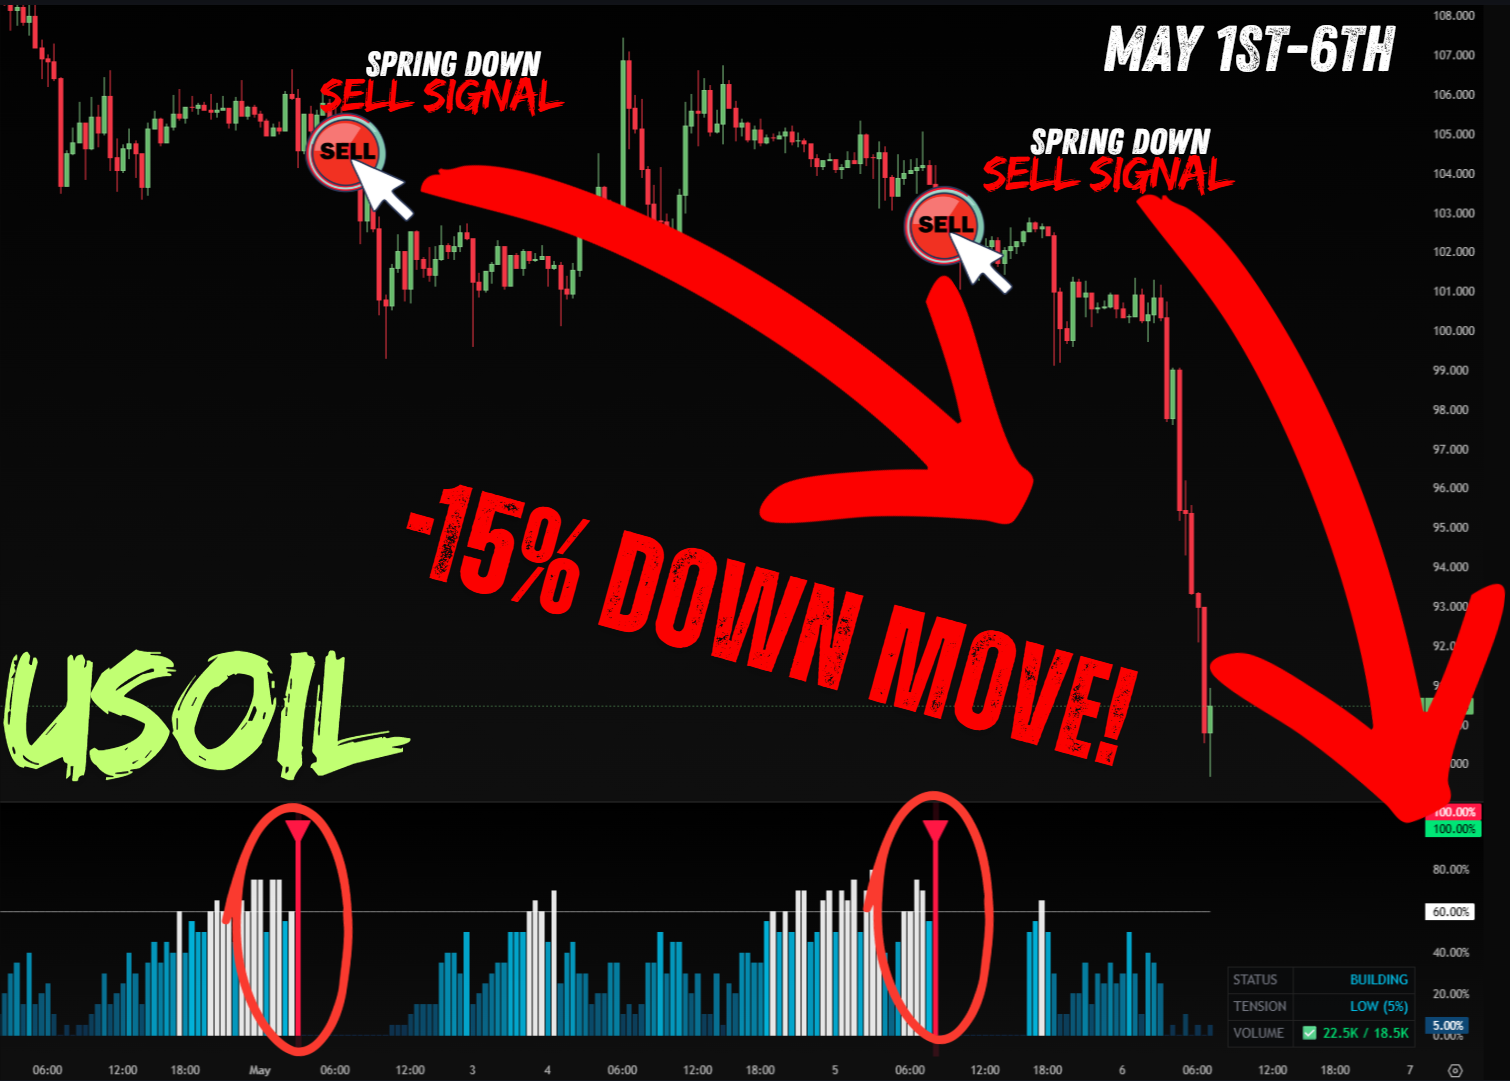
USOIL — 15% Drop Caught From the Top
Two “Spring Down Sell Signals” between May 1st–6th perfectly called the top on USOIL before a 15% drop
Two back-to-back Spring Down signals called the exact top on crude oil before a massive 15% decline. The indicator identified the compression, recognized the downside break, and signaled before the bottom fell out. This is the indicator working on a commodity futures market — it works across all asset classes.
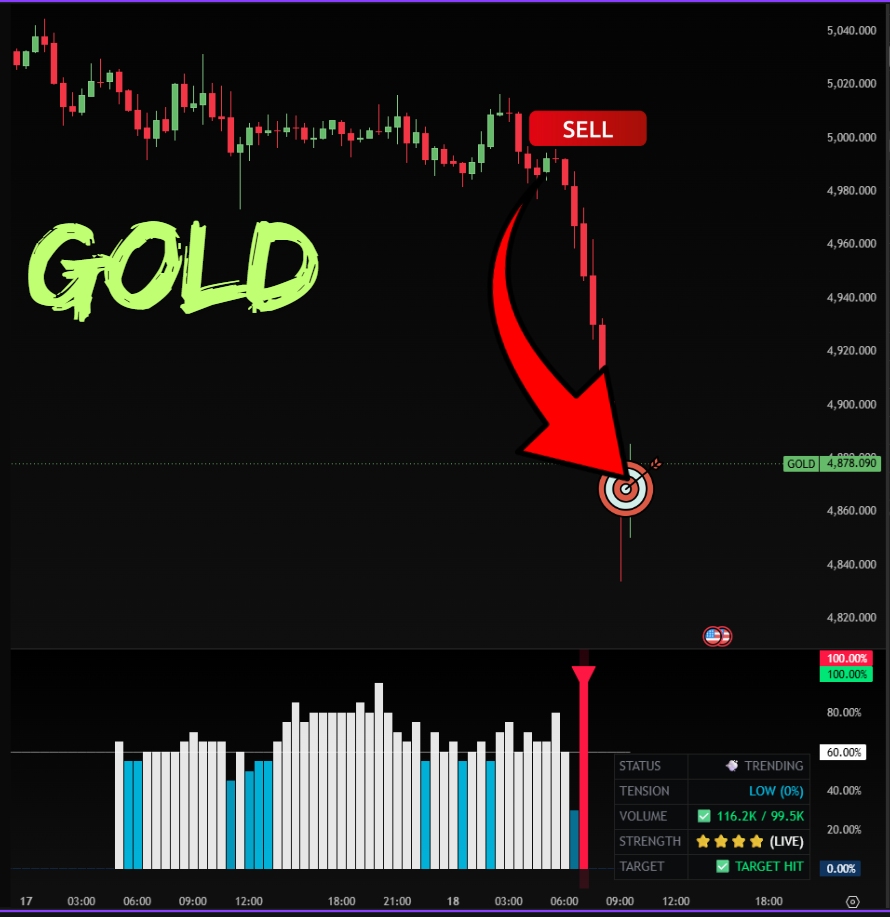
Gold — Strong Move Down March 18th
Gold — Spring Down signal called the top before a sharp decline on March 18th
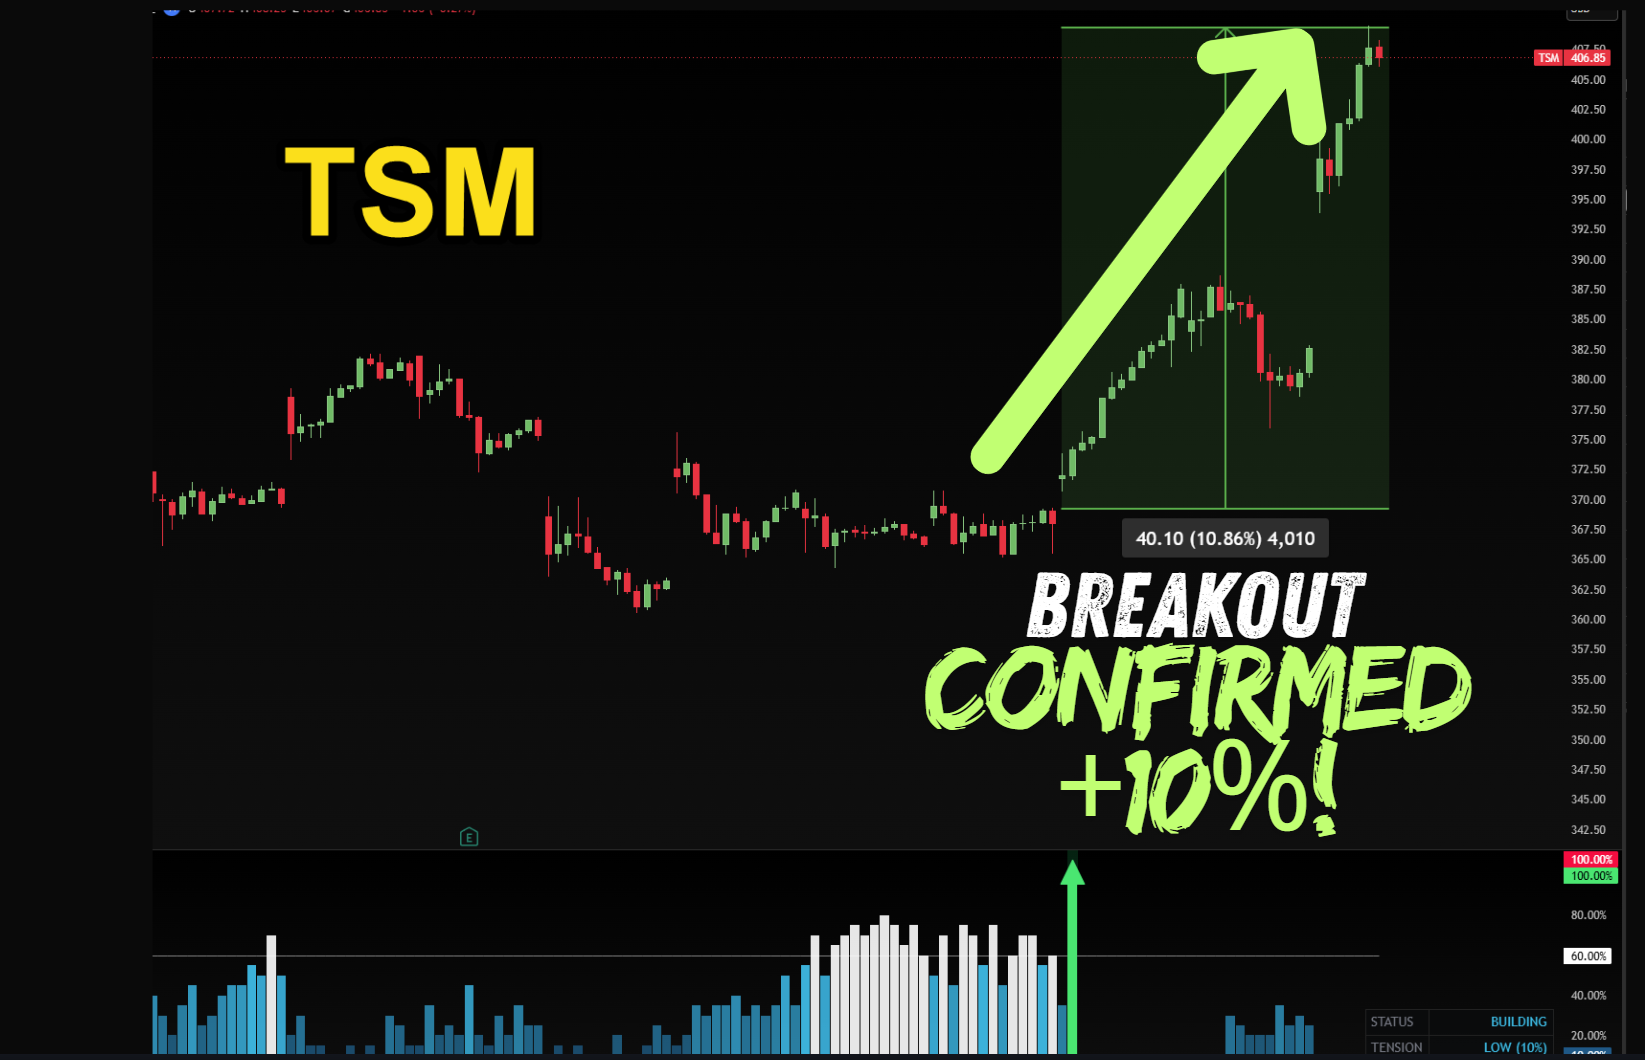
TSM — Breakout Confirmed
TSM — the indicator confirms a true breakout, filtering out the fakeouts that trap most breakout traders
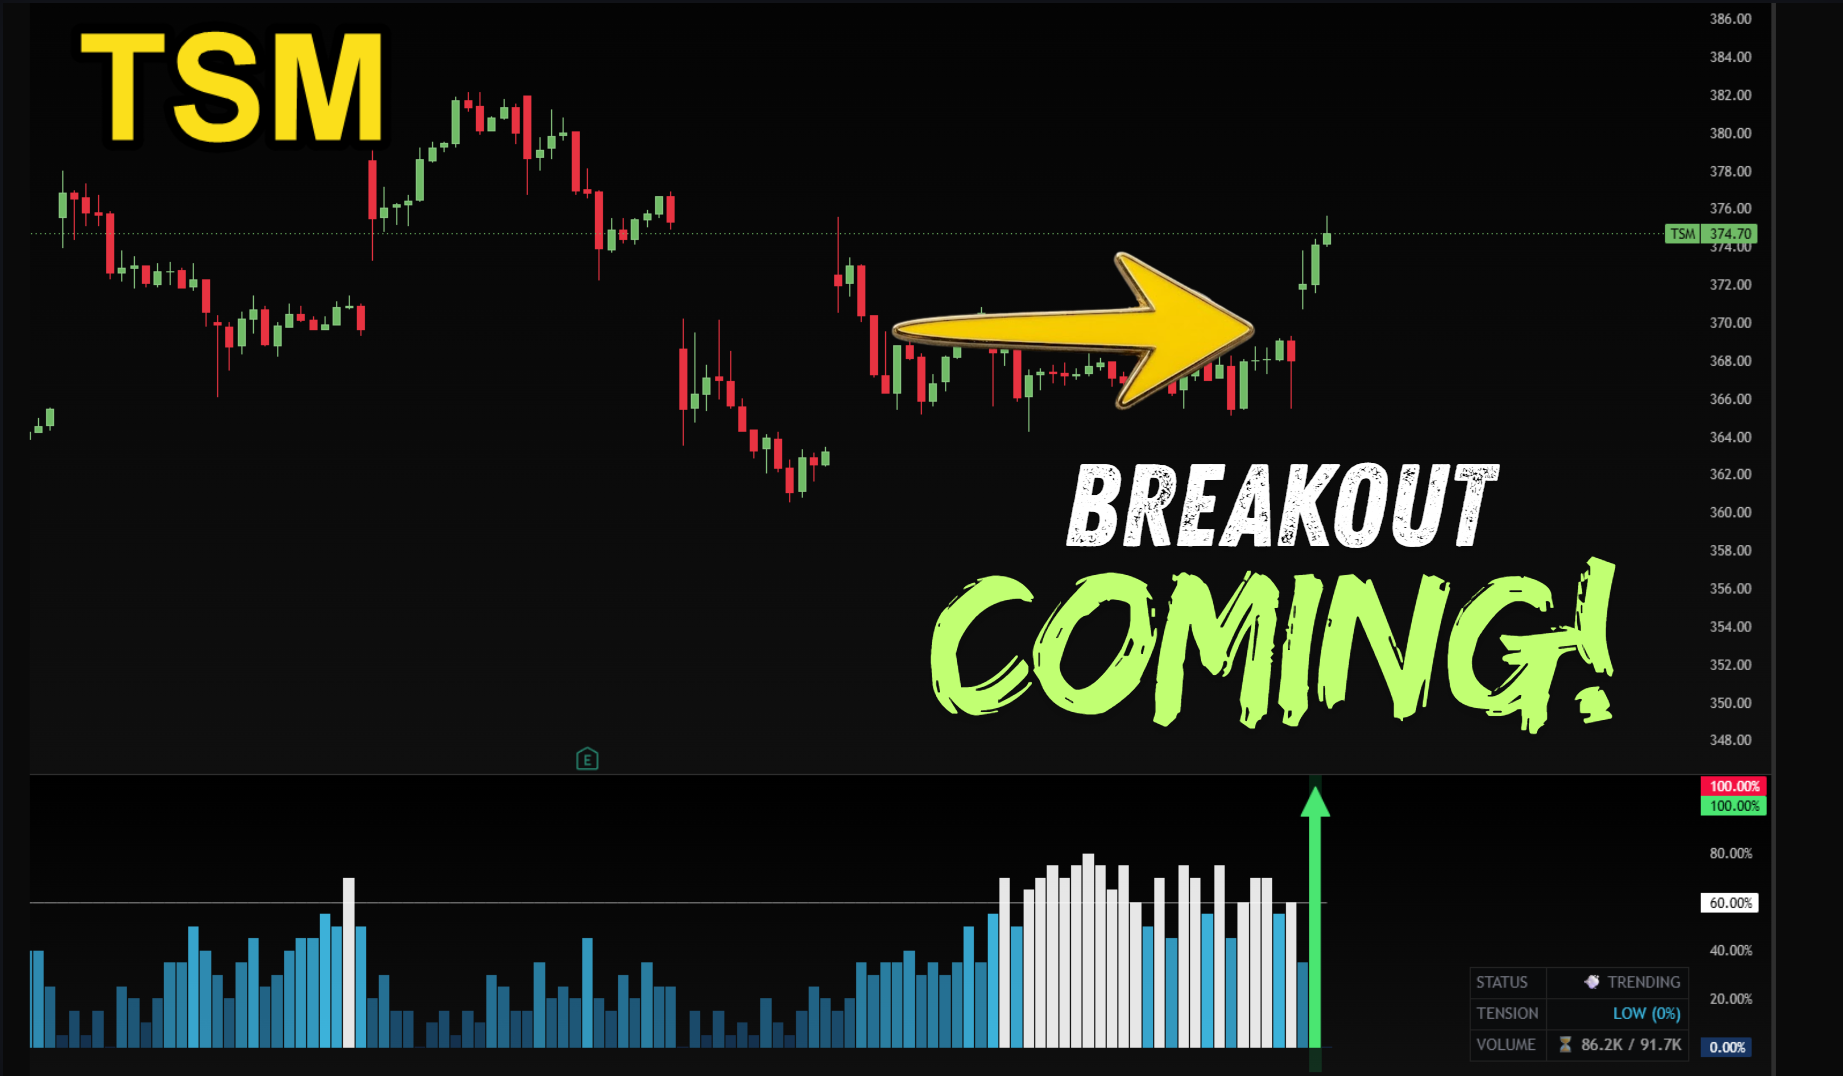
The calm before the storm — TSM in the tension-building phase before the confirmed breakout
What’s Included in Coiled Spring Pro
The indicator itself is only part of what you get. The full Coiled Spring Pro package includes a complete system for learning, implementing, and profiting from the coiled spring strategy.
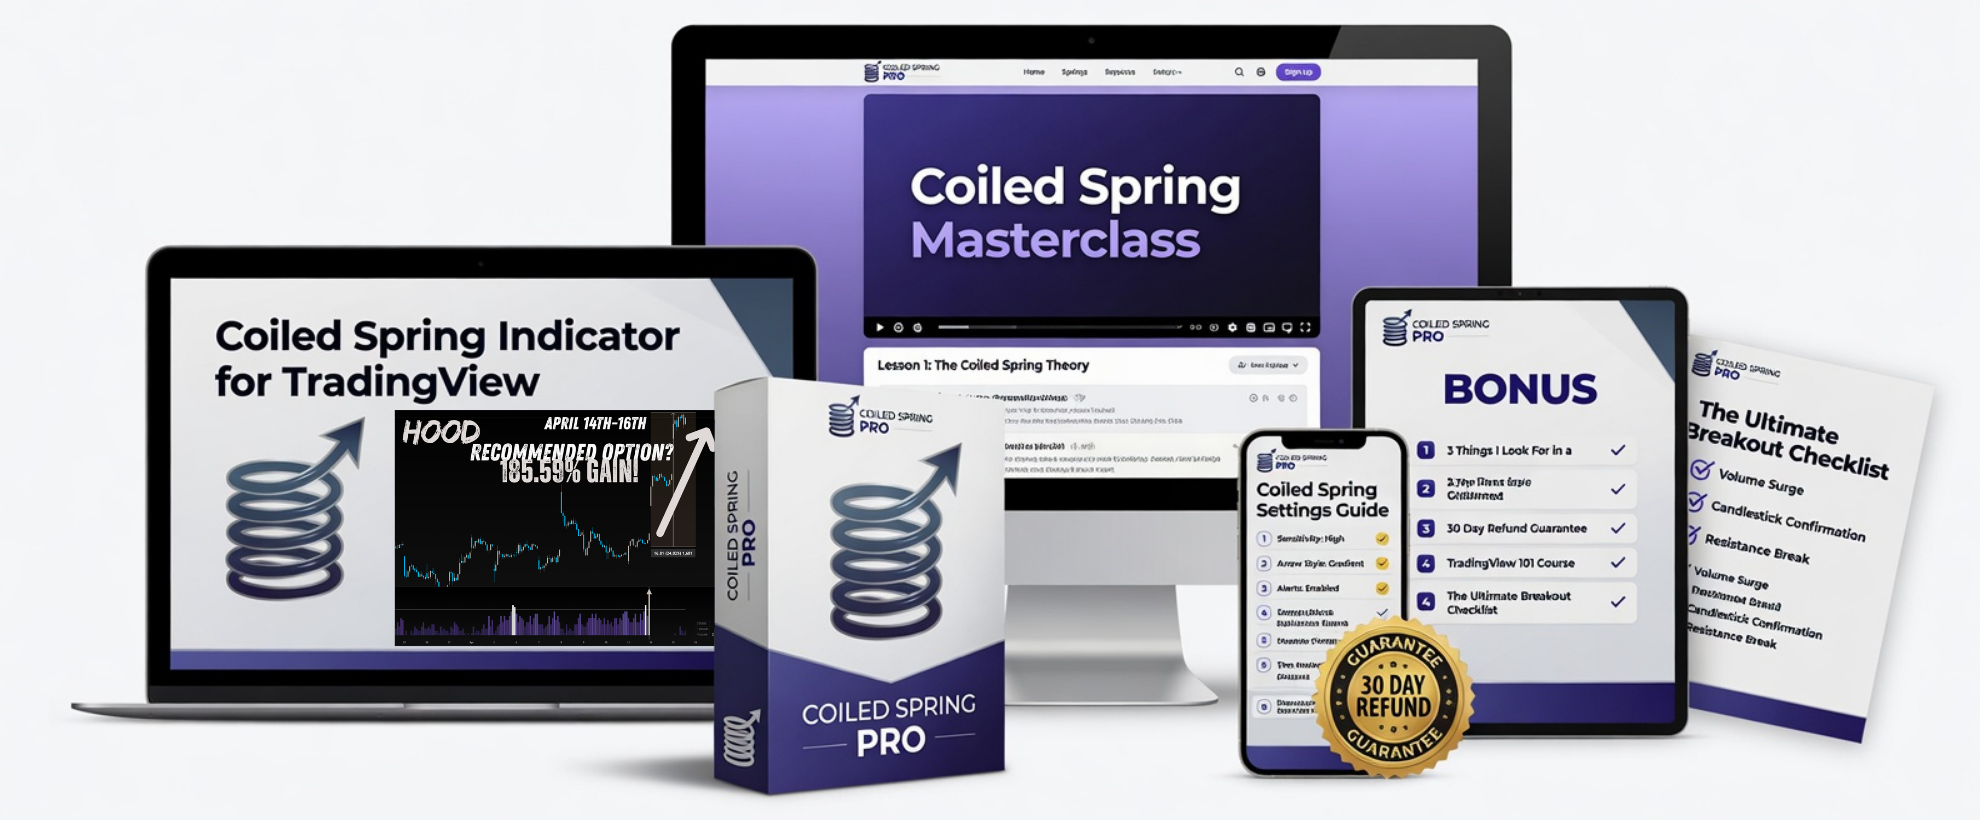
Everything included in the Coiled Spring Pro package — the full arsenal
The complete Coiled Spring Pro system — indicator + education + resources
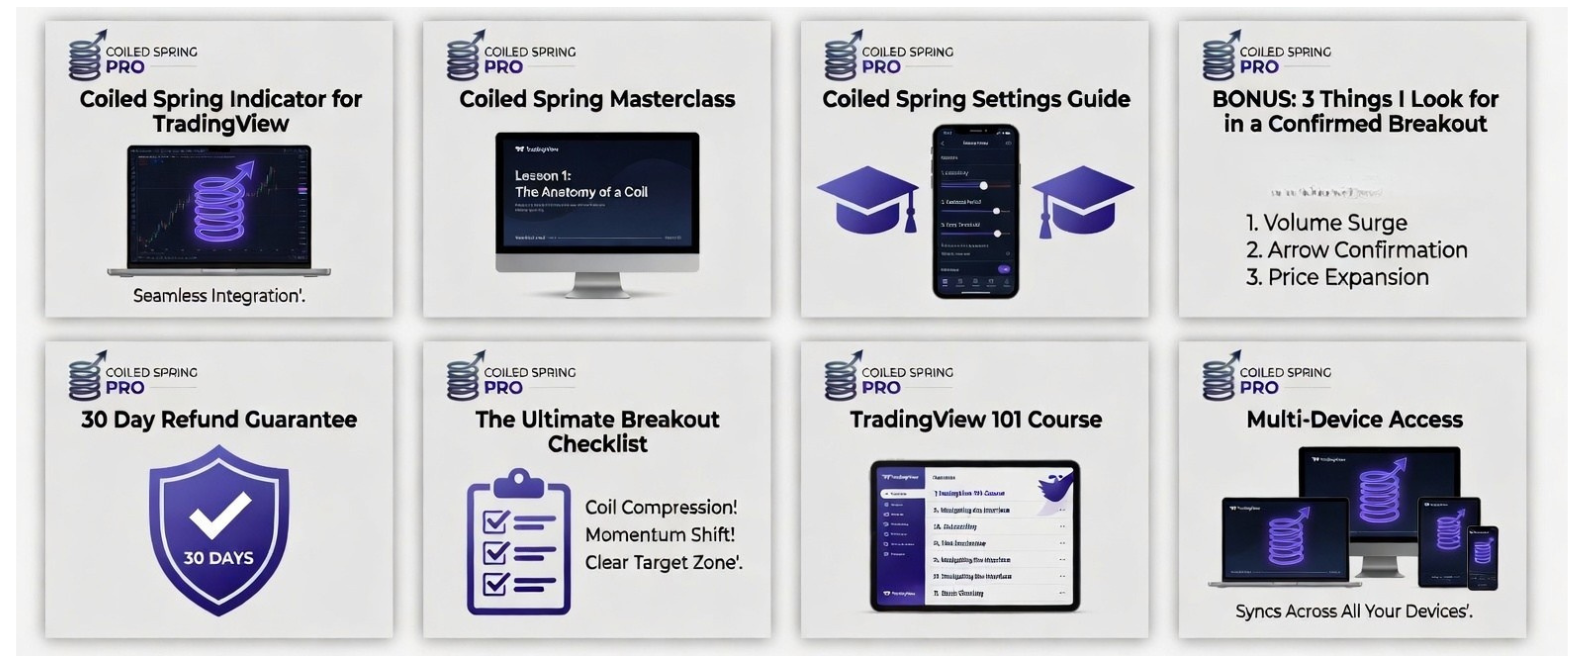
- Coiled Spring Pro TradingView Indicator — The core tool. Works on any ticker, any timeframe, any asset class. Real-time tension scoring, live HUD dashboard, star-rated signals, and auto-calculated profit targets.
- Coiled Spring Pro Masterclass — In-depth video training on how to use the indicator, how to read the signals, and how to build a full trading plan around the strategy.
- Settings Guide — A complete breakdown of every setting in the indicator and how to customize it for different timeframes and markets.
- Ultimate Breakout Checklist — The three-part checklist for confirming a high-probability breakout before you enter the trade.
- TradingView 101 Course — A beginner-friendly orientation to TradingView for members who are new to the platform.
- 30-Day Money-Back Guarantee — Full refund, no questions asked, within 30 days if you decide it’s not for you.
The Coiled Spring Pro Masterclass — in-depth video training on how to use the full system
The Settings Guide — every parameter explained with recommended values for different trading styles
The Ultimate Breakout Checklist — three conditions to verify before entering any trade
Works on any device — desktop, tablet, or mobile through TradingView
Backed by a 30-day, no-questions-asked money-back guarantee
Coiled Spring Pro: Pros and Cons
✅ What We Like
- Automates a genuinely difficult analysis process
- Works on any asset class and any timeframe
- Star rating system helps you prioritize the best signals
- Live profit target displayed on-screen — no manual calculation
- Signals fire at bar close — no mid-candle noise or fakeouts
- Catches both long and short setups
- Comes with full education (not just a tool)
- Strong documented track record across multiple markets
- 30-day money-back guarantee — zero risk to try it
- One-time price, not a subscription
✗ Things to Keep in Mind
- Requires a TradingView account to use
- No strategy guarantees results — losses are always possible
- 2-star signals are lower quality and are best skipped
- Best results come from 3-star setups and above
Our Verdict
Bottom Line: A Legitimate Edge for Breakout Traders
Coiled Spring Pro solves a real problem. Finding high-quality coiled spring setups manually is time-consuming, subjective, and easy to get wrong. This indicator systematizes the entire process — 20 technical conditions measured simultaneously, a clear signal fired at bar close, and a projected target displayed immediately. The documented trade results across multiple asset classes are compelling, and the inclusion of a full education package and 30-day guarantee makes it a very low-risk way to see if the strategy fits your trading style. At $297 one-time with no subscription fees, the value proposition is strong.
Ready to Start Finding Coiled Spring Setups?
Get full access to the Coiled Spring Pro indicator, the masterclass, all bonus materials, and the 30-day money-back guarantee. One-time price, no subscription.
Get Coiled Spring Pro →$297 one-time · 30-Day Money-Back Guarantee · Instant access
Disclaimer: This article contains affiliate links. Results shown are from documented trades using the Coiled Spring Pro indicator. Past performance is not indicative of future results. Trading options and other financial instruments involves substantial risk of loss and is not appropriate for all investors. Never trade with money you cannot afford to lose. This article is for educational and informational purposes only and does not constitute financial advice.
Source link