Early Trend Detection Index (ETDI) as a Confirmation Indicator – Stonehill Forex






Well, Hello…
Whether you came here from a digital stroll through the internet, a recommendation from a friend, or you’re a known friend…we welcome you. Here, you’ll find an abundance of resources, and specifically in this blog a very special product worth reading into. If you’re not familiar with our way of trading or what the system is, then we suggest you have a look around at our website www.stonehillforex.com or the VP’s website which is www.nonsensefore.com
It’s Happening
It took awhile to reach this point, but we think it was worth the wait. Over the last few years, we have been profiling indicators developed by others. A couple of years ago, we created and profiled an indicator based on community contribution named, “ATR Based EMA Variant 1”. This indicator is a baseline and found in our on-line library, and will also be available in the on-line shop. Then, we created and profiled a confirmation indicator called “Crossroads” back in March of 2025, also available in the library (and in the shop). Both were met with approval by our fellow traders and general public, and we were quite happy with the results. We’ve upped our game, and we’re now ready to share something a bit *extra*. However, there is one caveat. We wanted to let you know that this indicator is not free; however, it will be available at a very reasonable price — but we’ll address more on that later in the blog.
Bigger and Better
Just a quick note. This blog will be a bit longer than our usual profile as we want to communicate additional, necessary information surrounding this indicator. Using the indicator is really easy because we’ve done all the background work and by spending a little extra time explaining it will help you use it effectively. Believe us, it’s worth the read and of course, you’ll want to watch the video associated with this indicator.
Deep Dive
After researching and testing many (literally thousands of) indicators since we began the profile series, we pondered on what really defines a trend. We also wrestled with two “big ideas”;
- How to identify it when it meets certain criteria and…
- Ignoring it when it doesn’t.
So, after long bouts of debating, collaborating, brainstorming, and a lot of chart work, we drilled down on the components which we believe define the fundamentals of a trend. We decided on these three as major contributors;
Rate of Change
*
Momentum
*
Volatility
In No Specific Order — ROC
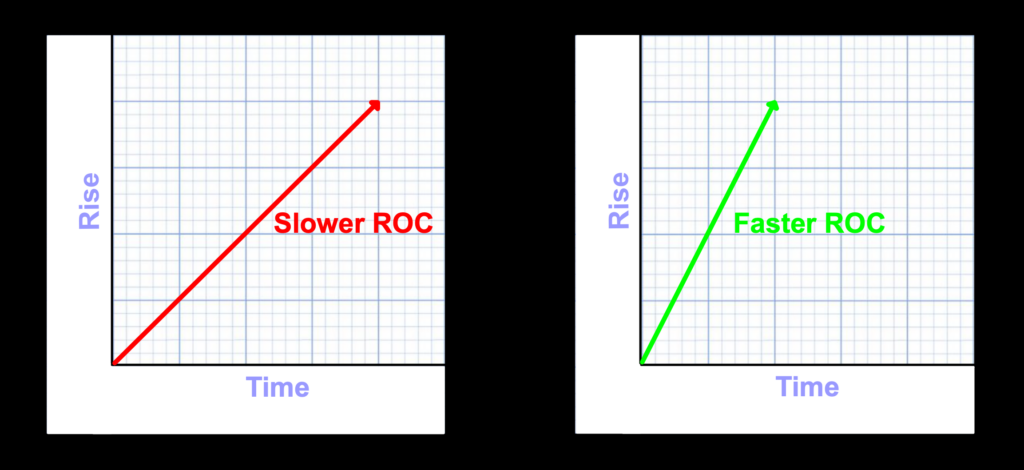
Let’s start with the first one; Rate of Change. By definition, ROC is the “rise over run”, meaning how fast does the slope (the angle) change based on how much time has elapsed. The quicker the rise, the faster the rate of change. For us, this means; how fast is price rising (or falling) over a specified number of periods; i.e., time.
Momentum
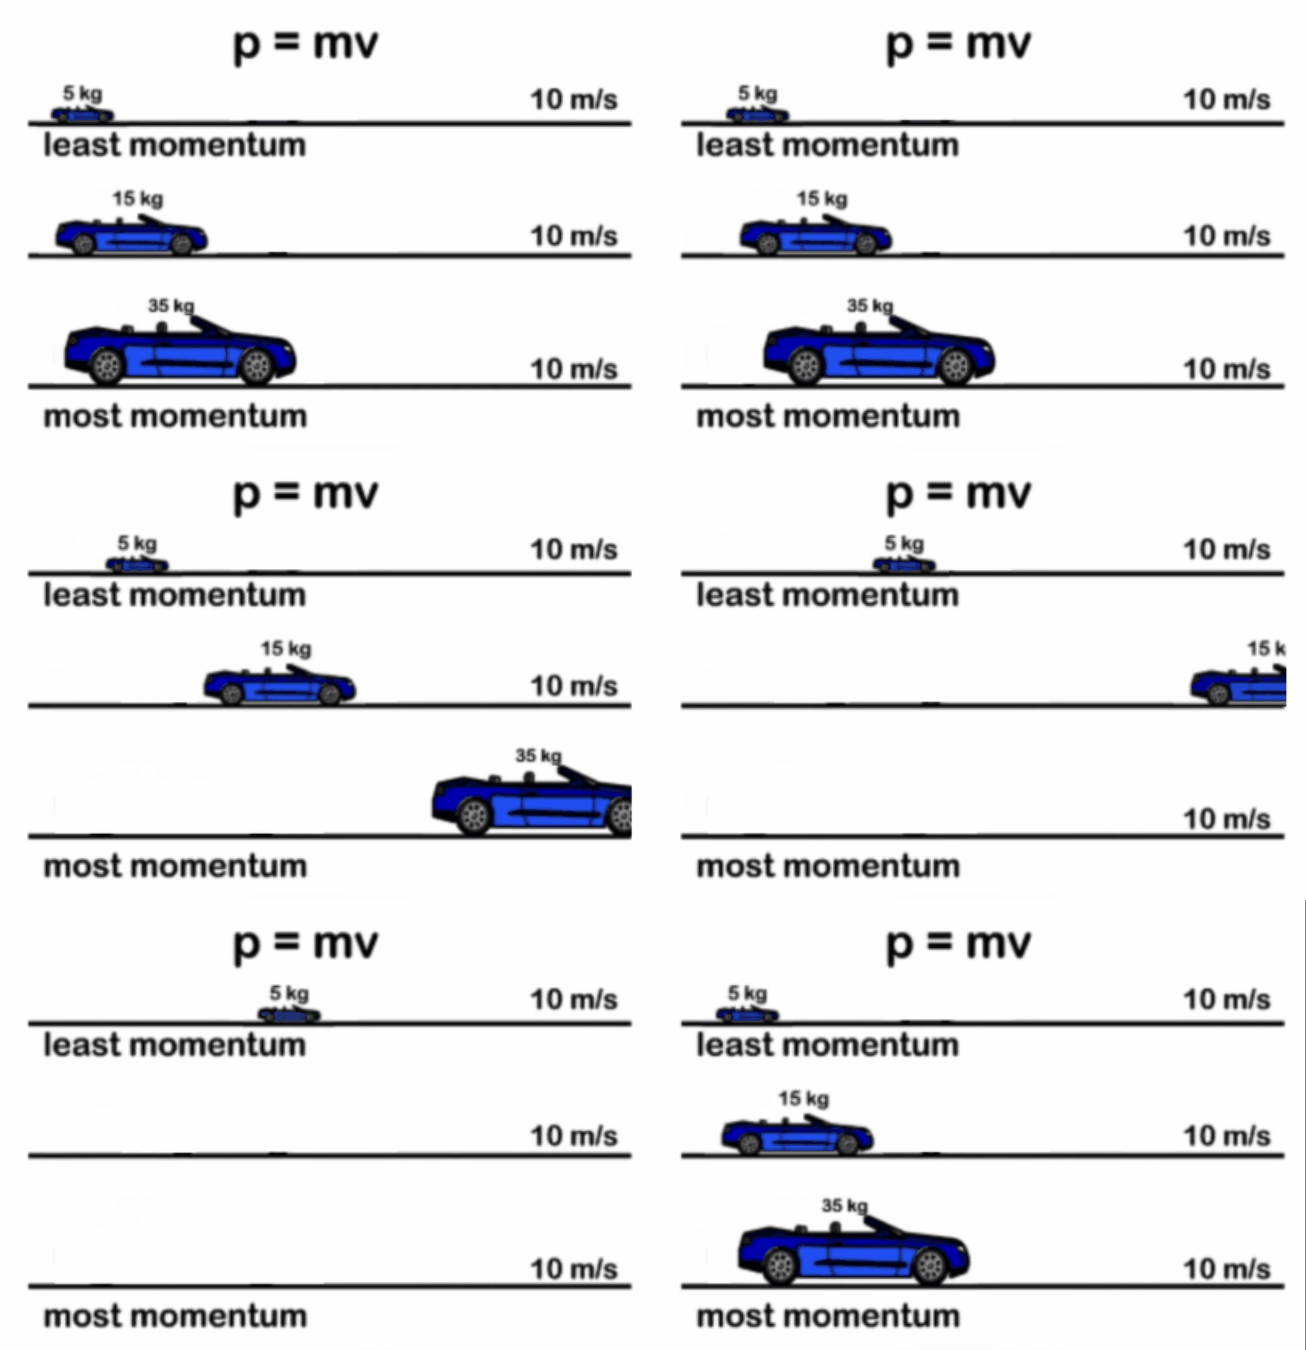
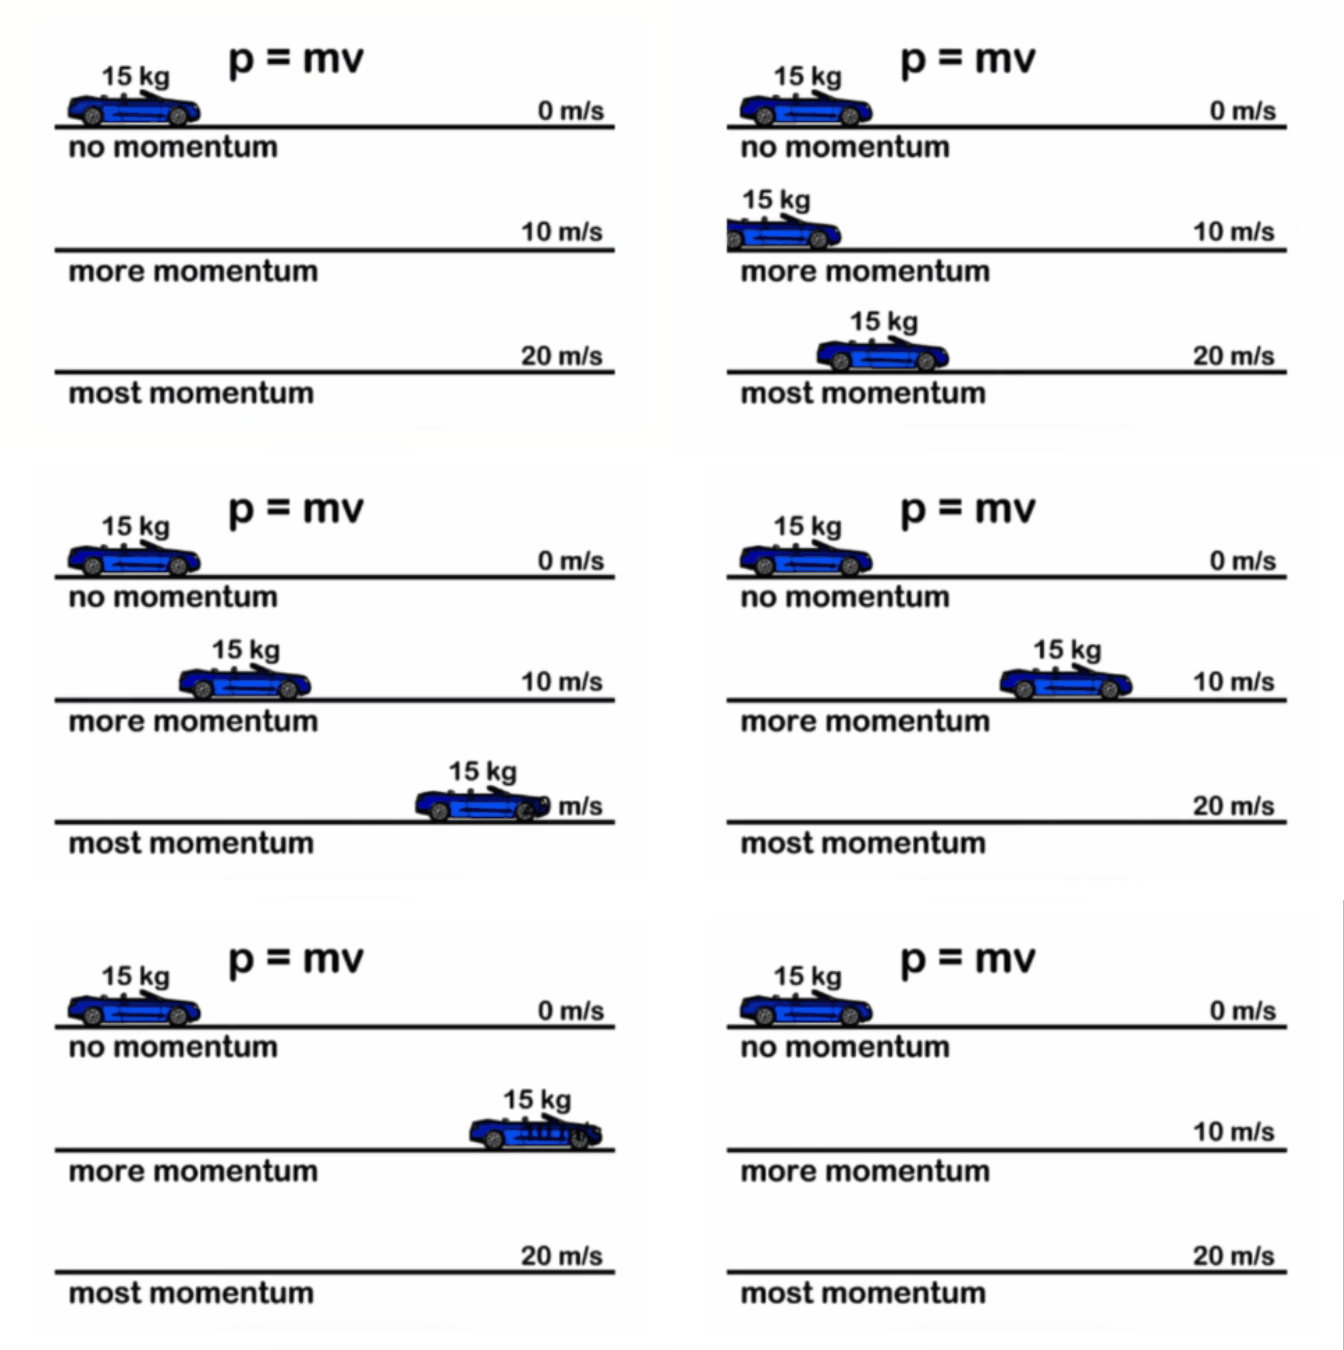
The next component, momentum; it describes how much force is behind the price move up or down. Momentum can either be a function of mass (weight) or velocity (speed)…or a combination of both. So, a quick moving, high ATR price should (in theory) move faster and farther.
Visual Examples For Fun and Profit
Momentum (same speed), different weight. The heaviest car will go further.
Momentum (same weight), different speed. The fastest car will go further.
Volatility
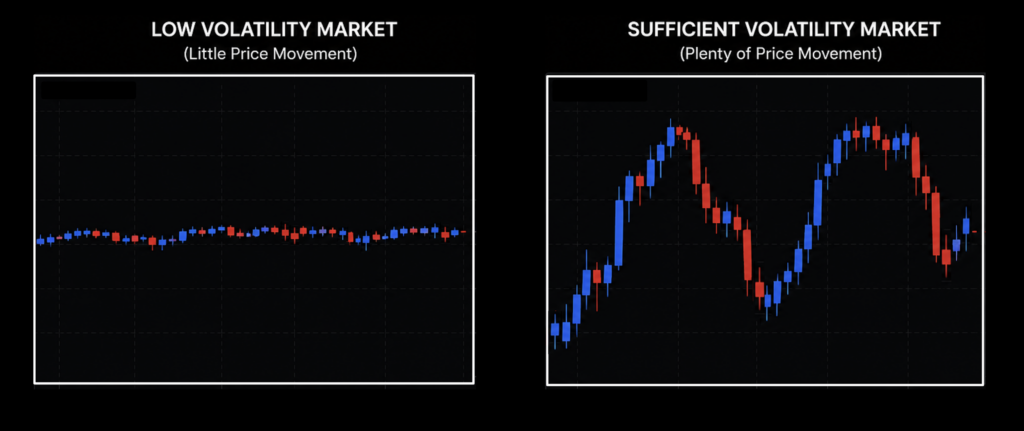
Simply stated, it comes down to how much change occurs over a specified period of time. We need volatility in the market. Lack of volatility creates stagnant, range bound price action, and is naturally difficult to trade – no matter what kind of trader you are. See what we mean below.
À La Carte
Most indicators have one or the other characteristics. Some may have a blend of two of them but grouping all three together might prove to be worth looking into.
Visual Cues
We had multiple iterations of what the indicator looked like. It had multiple lines, bands, colors, arrows, and histograms (not all at the same time of course)…pretty much everything possible to indicate long and short signals. We finally settled on using a colored histogram due to its visual simplicity. Indicators that overlay price can sometimes become distracting, especially when there are more than one given that candle colors can sometimes get in the way.
Voilà
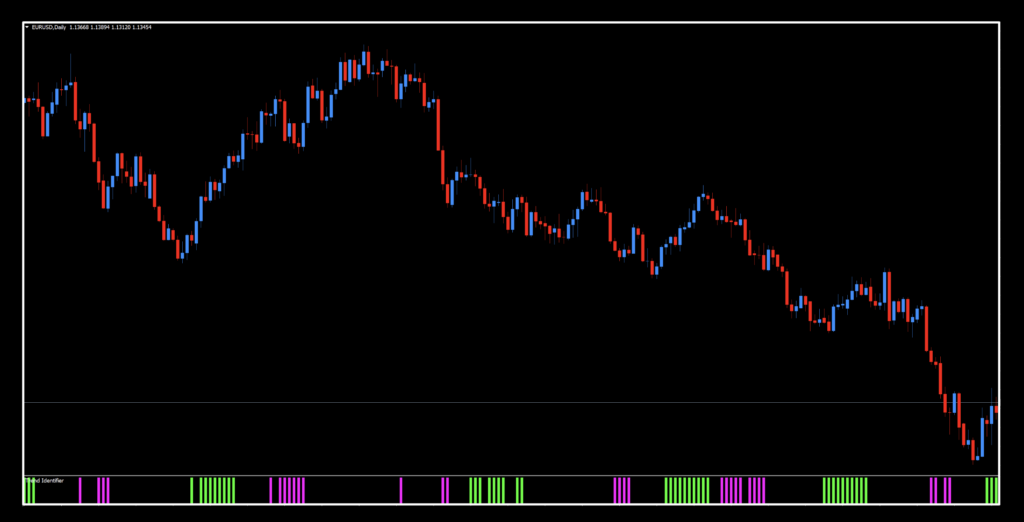
Now that we’ve defined the existence of our indicator, let’s see what it looks like in its default form.
Number Sense
If you’d like to learn more about our testing process or simply refresh your memory, click HERE to visit the Cross Roads indicator study – which happends to be an indicator that we developed and shared…for free! In that profile, we explain in detail how we developed our testing parameters and how they align with the NNFX methodology.
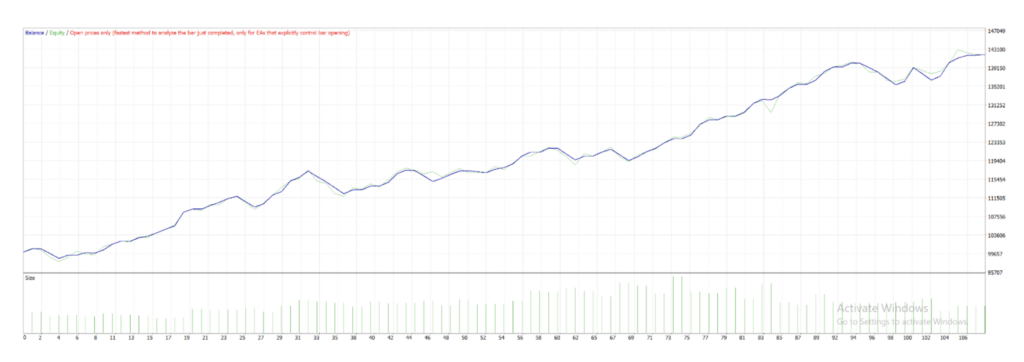
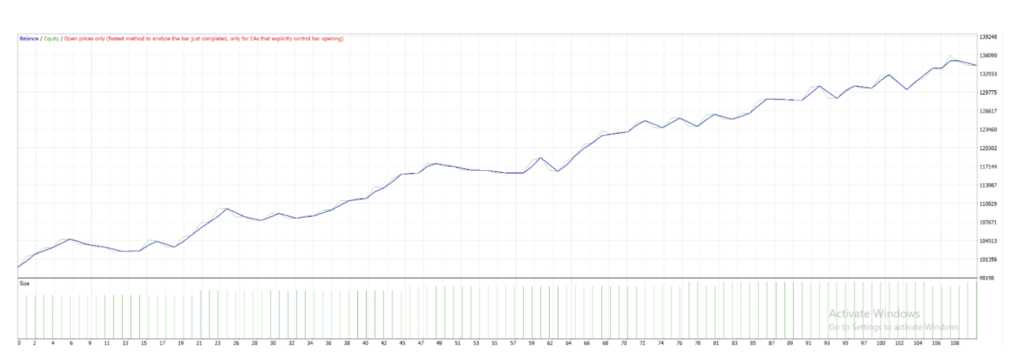
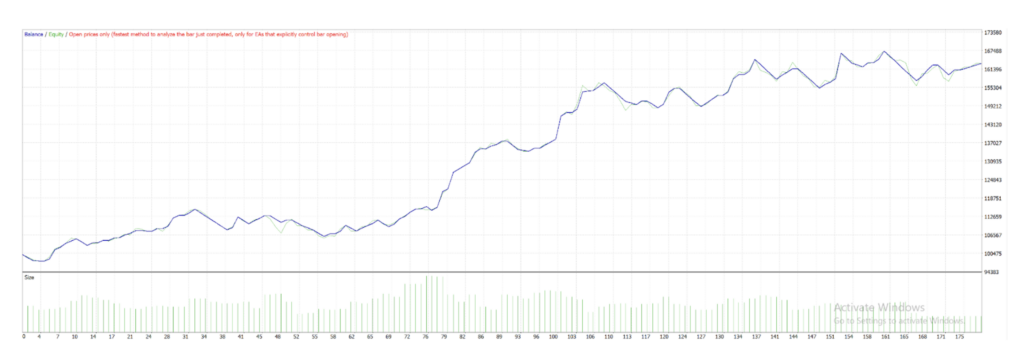
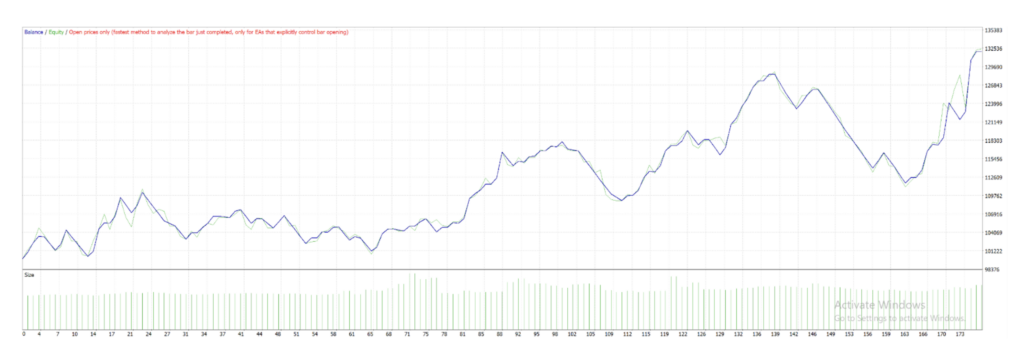
Below, you’ll find the standard performance metrics we use when evaluating indicators. We’ve also included graphs showing trade wins and losses so you can get an idea of what the potential equity curve may look like over time.
Just a quick note: the graphs are based on the recommended tweaked settings, not the default settings.
Hot Stuff
We were very happy with the results, and it’s clear that the adjusted settings resulted in the indicator performing well across the markets we tested. Of course, we still encourage you to test the indicator for yourself to see how it fits your own trading style.
These are recent results collected over a three-year period. During that time, the markets experienced many different conditions, including slow markets, high volatility, ranging markets, and strong trends — all of which we mentioned earlier. Remember, we don’t cherry pick.
Fun Stuff
Just for fun, we also tested the indicator over different time periods to see how it would perform. We were happy to find that the results remained fairly consistent across the different tests. Of course, we can’t guarantee future results. We don’t have a crystal ball, we’re not magicians, and we don’t try to predict the market before signals appear. The best approach is simple: trade based on what you see, not on what you think might happen.
Settings
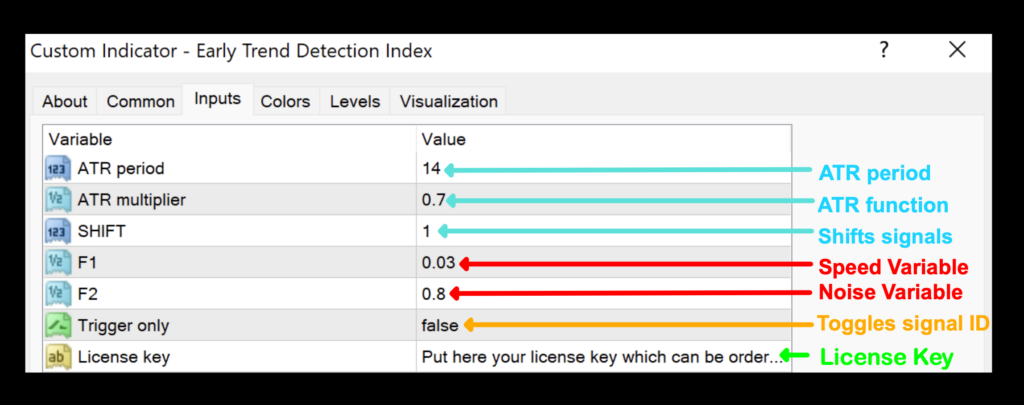
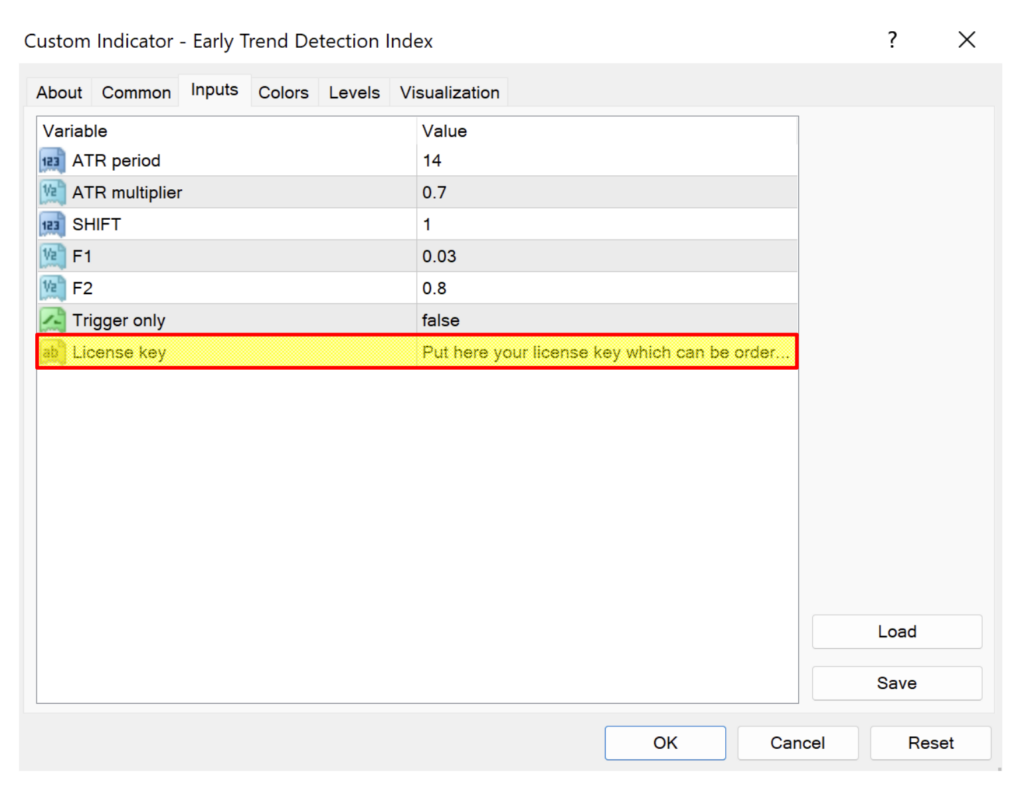
In our custom indicator, we’ve got a few settings which we’ll discuss and one that even helps you identify cleaner signals.
ATR period: This sets the number of periods used for internal calculations. The default value is 14.
ATR multiplier: Optimizes internal calculations for focused signals. The default value is 0.7.
SHIFT: Shift signals further along price (must be greater or equal to 0). The default value is 1.
F1: Noise variable used to help filter out false signals. The default value is 0.8.
F2: Speed variable used in setting the price/indicator reactivity. The default value is 0.03.
Trigger only: Displays signals two different ways. The default setting is “false”.
License key: Where your individual alphanumerical license key is entered.
Trigger Only
Before we continue, we’d like to explain the “Trigger Only” setting in the indicator’s settings menu.
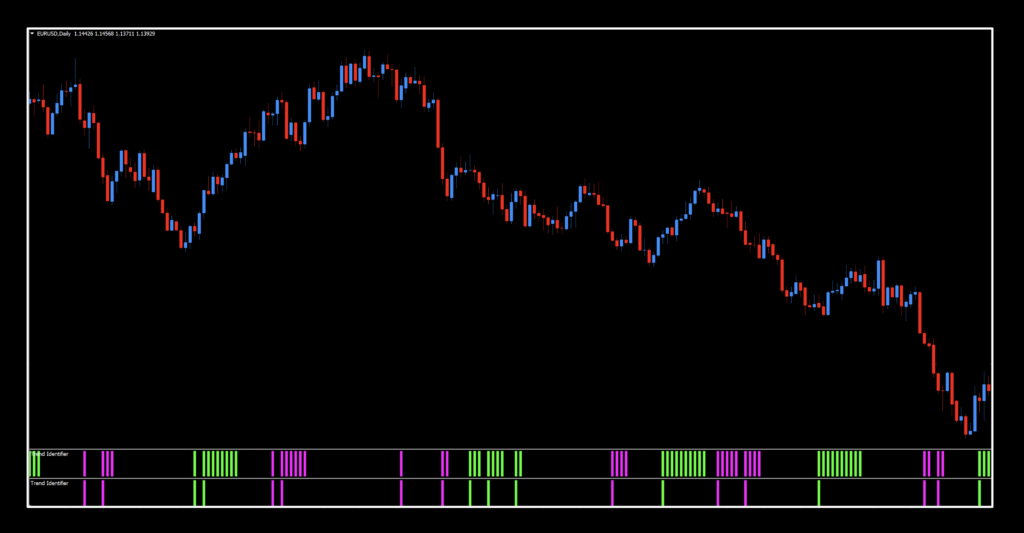
By default, this setting is set to FALSE. In this mode, the indicator will continue showing signals for as long as the trading condition remains active. In simple terms, if the relationship between the price and the indicator continues to meet the required condition, the histogram bars will keep printing. Like this:
If you change the “Trigger Only” setting to TRUE, the indicator will display only the very first signal when the condition is met. Another signal will not appear until the condition turns false and then becomes true again. Like this:
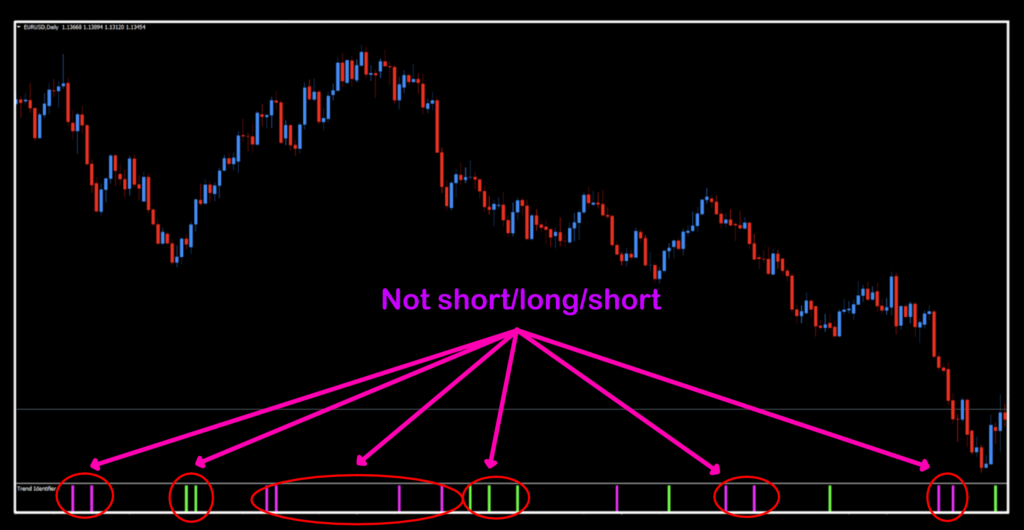
Because of this, the signals will not always switch back and forth between long and short trades. You may see several long signals in a row or several short signals in a row, depending on market conditions as noted in the image below.
The FALSE setting can be especially useful for traders looking for continuation trades because the signal can appear again while the trend is still active.
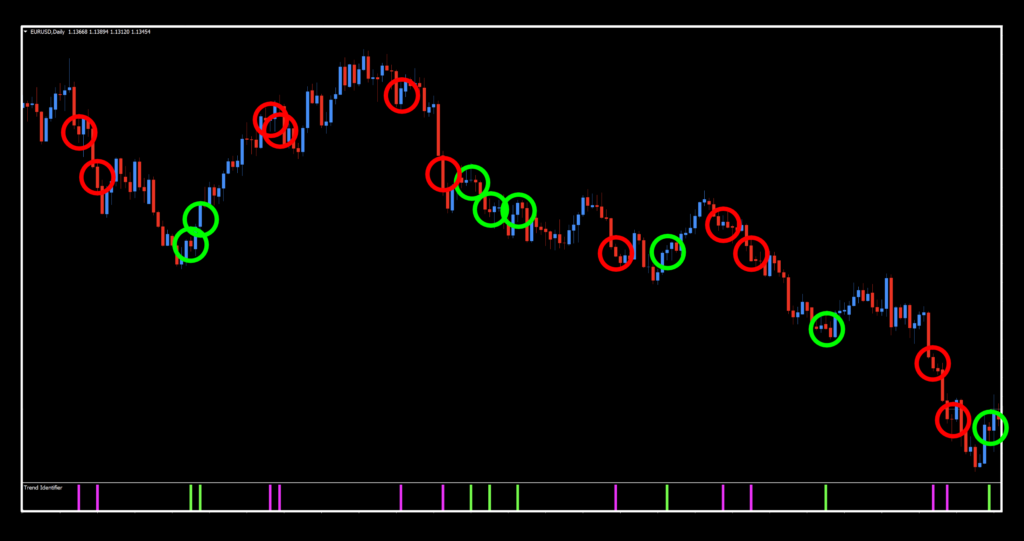
Below is a screenshot showing the indicator in both modes, followed by another example identifying the signals using only the “Trigger Only” setting with identified signals.
Romancing the O’s
We’ll be looking at the chart with the “Trigger Only” setting turned to TRUE. Since we don’t test for continuation trades, this is the setting we use with our indicator.
One of the first things we noticed was that some signals repeated multiple times. Does that mean you should take every single signal? Not at all. Remember, this indicator — like any other — is only one part of a complete trading system.
Once your algorithm gives you the green light, you’ll enter your initial trade or possibly a continuation trade. From there, you stay in the trade until something tells you to exit, such as a trailing stop or an exit signal – which happens to lead us to the next paragraph.
Exit or No Exit
One of the things we talk about is if a confirmation indicator can double as an exit tool. We put out a video series a couple of years ago on the YouTube channel where you can find them in their own playlist. When we spoke with VP about this indicator he stated that it would do quite well. This is great news to everybody who uses this indicator in their algorithm. In all honesty, we thought it might because of the inerent logic of the internal math.
Resources — READ THIS
This is where things are a little different. Unlike our other tools, this indicator is not free. Our goal was to create something that could genuinely help traders work toward strong long-term results. Since many traders aim for annual returns similar to the S&P 500 — around 12% per year — this indicator could become a valuable tool in helping you reach and even exceed that goal.
In other words, an investment in this indicator could quickly pay for itself many times over. As we often say, your time has value too. We intentionally kept the price reasonable so serious retail traders would still have access to a high-quality trading tool.
Whistle While You Work
A great deal of time, effort, and resources went into researching, developing, coding, and testing this indicator over several months. Our goal was to create something better not only for ourselves, but also for our community of traders.
We provide a large amount of free content, and creating that content also takes a lot of work and dedication. However, from time to time, we will develop products that are not free because of the (extra) value they provide. Examples include the NNFX Advanced Course (created by us here at Stonehill Forex under the wachful eye of VP) and the NNFX Strategy Tester, which was created by one of our friends, and affiliates.
Where Art Thou
If it’s not in the indicator library, then where is it? You’ll be able to find it in our “store”, which is also located on the website, where you’ll find the price. We are concentrating on the MT4 version and we’ll explore the demand for MT5 and possibly TradingView as it comes to light. Price will be the same for all versions of this indicator.
Getting It
Getting and using this indicator is relatively easy. Here are the steps…
- Go to the online store (HERE!).
- Purchase the indicator.
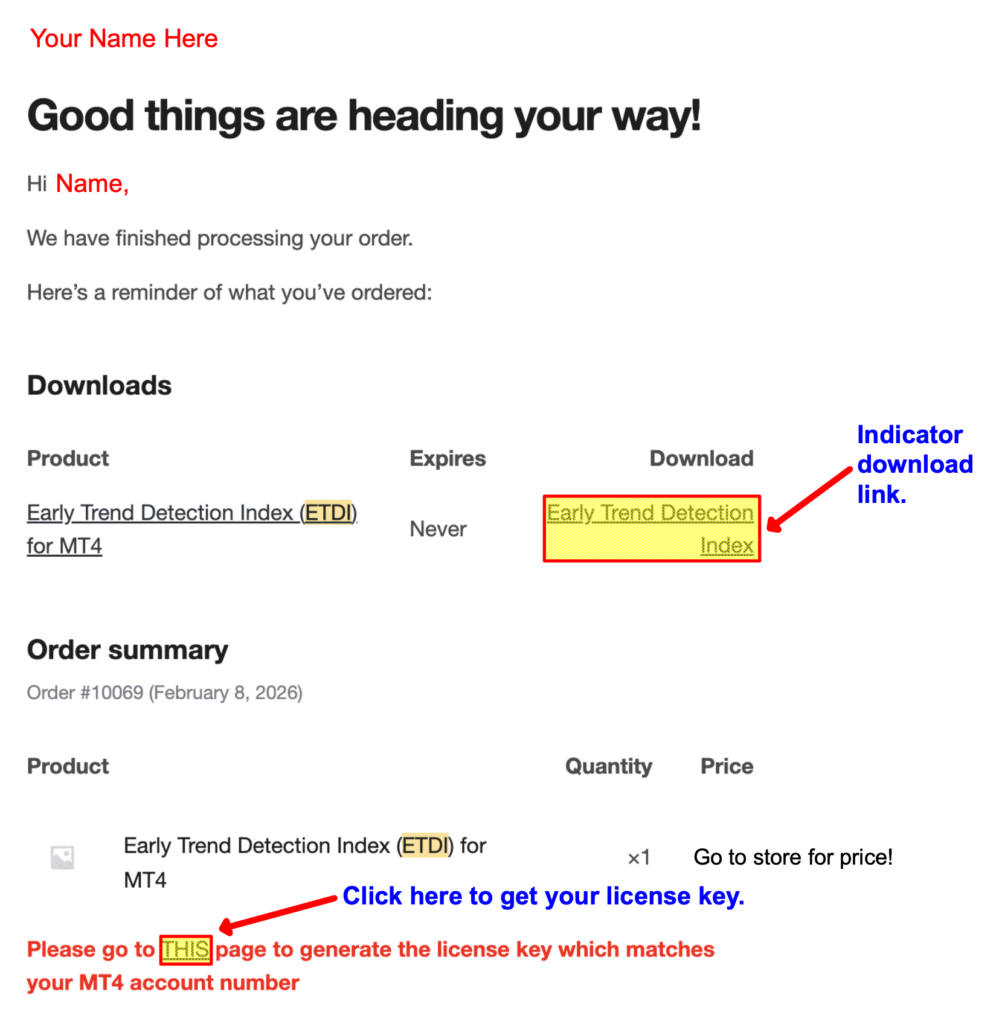
- Then check your email for the following:
- First, download the indicator and place it where it needs to be
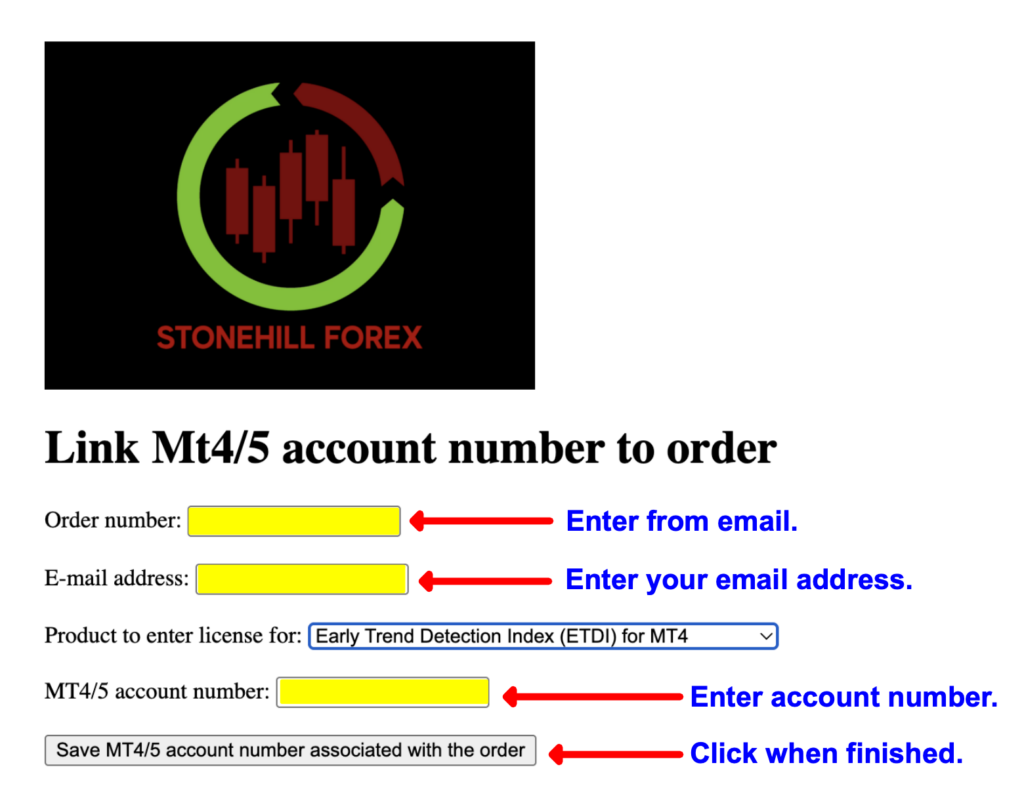
- Then click “THIS” to get your license key.
- Enter the order number, your email address, MT4 account number (MT5 and TV versions may come later) and then click “Save”.
- Be sure you click on MT4 otherwise you’ll get “Product not found”.
- At that point, you’ll receive your license number, good for three accounts.
- When you attach the indicator to your chart, you need to enter the license key where it indicates in the input menu.
- Then it’s off to the races!
Daily Maintenance
Remember, once you’re ready to perform daily maintenance on your trades during the last 20–30 minutes of the trading day (1700 New York time), you’ll be presented with one of four options.
- Opening a trade.
- Closing a trade
- Maintaining a trade; i.e.
- Moving a stop loss level.
- Exiting a trade.
- Taking a pass (nothing to do).
Long: When the histogram line turns green.
Short: When the histogram line turns red.
REQUIRED DISCLAIMER
Last Word
We have other projects in varying states of completion which will be rolled out in the future. Most free, a handful not. But the bottom line is that our efforts are always pointed in the same direction. And that direction is…
Our only goal is to make you a better trader.
*Our published testing results are based on money management strategies employed by the NNFX system and depend on varying external factors, which may be different between individuals and their specific broker conditions. No guarantee, trading recommendations, or other market suggestions are implied. Your results and subsequent trading activities are solely your own responsibility.
BTW — Any information communicated by Stonehill Forex Limited is solely for educational purposes. The information contained within the courses and on the website neither constitutes investment advice nor a general recommendation on investments. It is not intended to be and should not be interpreted as investment advice or a general recommendation on investment. Any person who places trades, orders or makes other types of trades and investments etc. is responsible for their own investment decisions and does so at their own risk. It is recommended that any person taking investment decisions consults with an independent financial advisor. Stonehill Forex Limited training courses and blogs are for educational purposes only, not a financial advisory service, and does not give financial advice or make general recommendations on investment.
Source link