Dell, NetApp help S&P 500 aim for seventh straight up day | FXStreet
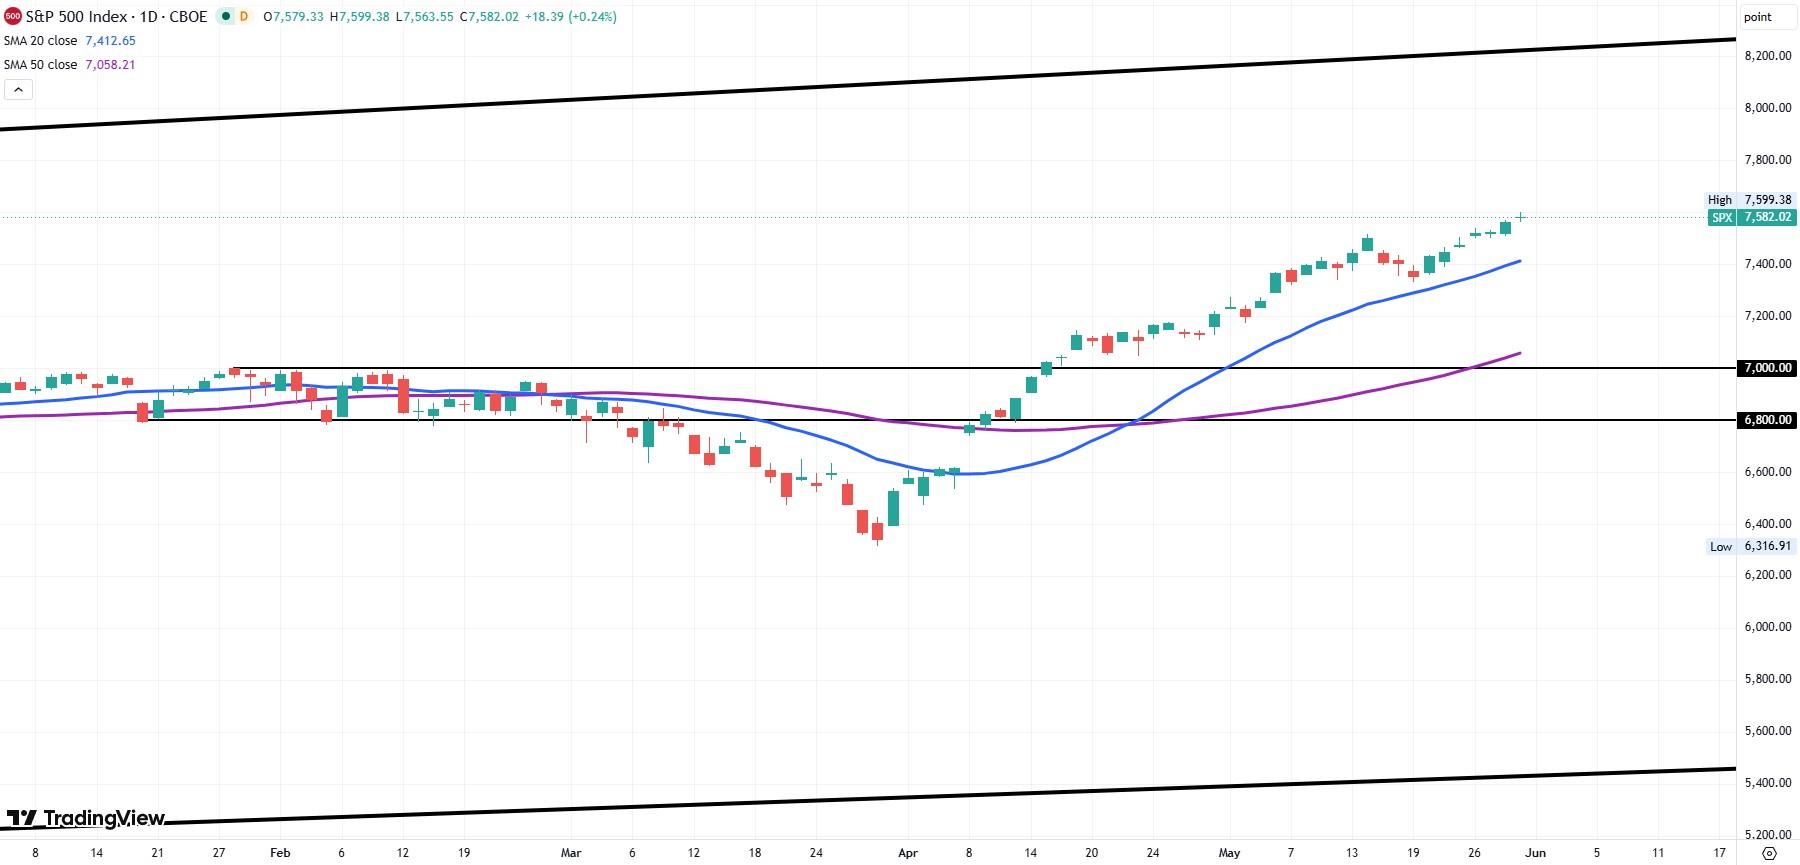
As Friday’s US stock market session rounds the corner in its final hour, the S&P 500 index is clinging onto what might be its seventh straight day of gains. Since Wednesday, May 20, the index has climbed from 7,353 to an all-time high of 7,599 on Friday.
But after gapping up on the open on Friday, the S&P 500 has been clinging onto a green sliver and is up just 0.1% at the time of writing. While the market has been upbeat about prospects for peace between the US and Iran all week, the index gave up some steam after reports emerged on Friday afternoon that Russia had fired a drone at a Romanian apartment building. As a member of NATO, the event threatens to trigger a broadening of the war to other European allies.
Dell, NetApp soar upwards of 25% on guidance
Friday’s performance in the broad index was aided by 20%-plus gains by Dell Technologies (DELL) and NetApp (NTAP). The tech giants both rallied on impressive headlines.
NetApp beat the earnings consensus for the fiscal fourth quarter and raised its revenue outlook.
“The strong growth across the board was driven by the increasing overall enterprise spending and strong demand momentum from customers moving towards AI adoption and use cases, with likely a benefit from higher ASPs,” Tim Long of Barclays wrote in a note to clients.
Long raised his price target on NTAP from $134 to $199 after NetApp offered fiscal year 2027 revenue midpoint guidance of $7.45 billion. Fiscal 2026 revenue was $6.93 billion.
For its part, Dell stock surged more than 30% on Friday after also hiking its fiscal year guidance. The computer hardware maker now expects $60 billion in fiscal 2027 AI server revenue on $167 billion in total revenue at the midpoint of guidance.
For the first quarter of 2027, Dell reported revenue of $43.8 billion, up 88% YoY.
S&P 500 chart
The daily chart shows the S&P 500 continuing on its long arc higher since March 30. Despite many false starts in negotiations between the US and Iran, as well as global Oil production remaining constrained due to Iran’s closure of the Strait of Hormuz, investors have chosen to believe that the war will get solved sooner or later.
The strength of the rally can be seen in the fact that the index hasn’t touched its 20-day Simple Moving Average (SMA) since April 7. The distance between the 20-day SMA and the 50-day also remains wide, as the pullbacks have all been bought up rapidly over the past two months.
The index looks destined to reach its long-term topline trendline above 8,200 sometime later this year if nothing gets in its way. But if the S&P 500 index does somehow break the 20-day average, then expect a harsh pullback to the 50-day SMA near 7,060 or the prior resistance from the start of the year at 7,000.