Bitcoin mining data points to new rally: Will BTC bulls follow through?

Bitcoin mining data points to new rally: Will BTC bulls follow through?


  • Bitcoin mining may help bulls start another major rally, according to this analysis.
  • Miner reserves soared to 6-week highs despite recent market FUD.

Now that Bitcoin [BTC] is trading below $60,000 once more, many might be wondering whether it is an ideal time to buy, especially now that it has demonstrated some weakness above that key price point.

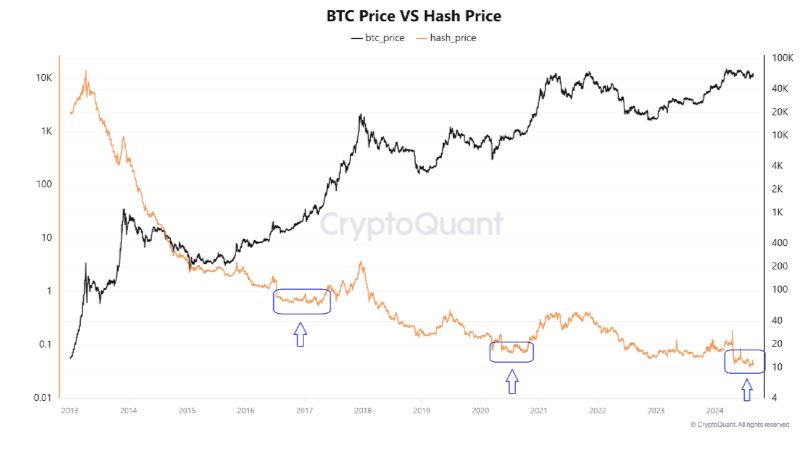
Bitcoin is currently in a buy opportunity, according to CryptoQuant analyst Woominkyu. The analyst made a bullish case for the cryptocurrency using the Bitcoin hash price, which showcased miner profitability.

Woominkyu’s analysis suggested that the hash price can be used as a bullish signal. A comparison with Bitcoin lows suggested that the hash price, at the bottom of its trend, could signal bullish opportunities ahead.

BitcoinBitcoin

Source: CryptoQuant

The Bitcoin hash price recently dropped to its lowest historic levels. This coincided with BTC’s recent downside, especially at the start of August.

If this analysis holds true, then it suggests that Bitcoin may already be in the beginning stages of its next major rally. It also suggests that the recent pullbacks might be the best accumulation opportunities at discounted levels.

Meanwhile, decentralized mining pool operator Loka Mining plans to introduce new measures that could prevent or ease miner capitulation.

According to its CEO Andy Fajar Handika, the company will finance growth and short-term needs using forward mining contracts.

The goal is reportedly to offset some of the pressures that miners face due to declining block rewards and high operating costs.

How Bitcoin mining affects demand

Bitcoin has so far demonstrated healthy demand below the $60,000 price level. Other miner related stats also point to a favorable sentiment for a potentially bullish outcome.

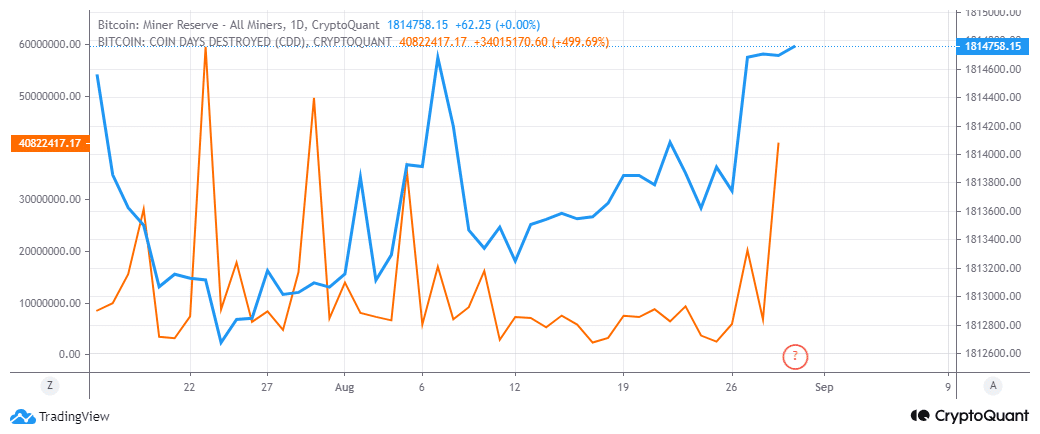
For example, miner reserves were at their highest levels in the last six weeks.

BitcoinBitcoin

Source: CryptoQuant

The surging miner reserves suggests that miners have been HODLing their coins in anticipation of higher prices. We also observed the highest spike in coin days destroyed in August.

The second-highest spike during the month was at the peak of the dip that occurred at the start of the month.


Read Bitcoin’s [BTC] Price Prediction 2024–2025


Previous spikes in the coin days destroyed indicator were observed before a major price move. This suggests that Bitcoin could be on the verge of another highly volatile move, either to the upside or downside.

However, the above observations suggest that a higher probability of a bullish outcome. Nevertheless, traders should move cautiously considering that there is still a decent level of uncertainty in the market.

Next: Bitcoin DeFi protocol Threshold proposes merger ‘before Justin Sun takes control of WBTC’

Source: https://ambcrypto.com/bitcoin-mining-data-points-to-new-rally-will-btc-bulls-follow-through/


Source link

Similar Posts

  • Why is Crypto Market Down Today (April 12)? | CoinGape

    The crypto market has seen renewed pressure on Sunday after escalating geopolitical tensions rattled global financial markets. The total capitalization went down 1.72 per cent in less than 24 hours, falling to $2.42 trillion. The recession was after the breakdown of diplomatic negotiations between the United States and Iran. Crypto Market Slides 1.72% as U.S.–Iran…

  • XRP Lawyer Reveals Crypto Mount Rushmore List: Ripple Executives Join Satoshi Nakamoto

    Pro-XRP lawyer John Deaton has tapped two Ripple executives to join an exclusive list of crypto all-time greats. The XRP supporter argues that Ripple’s co-founder, Jed McCaleb, and company CTO, David Schwartz, can sit alongside Satoshi Nakamoto on Crypto Mount Rushmore. Ripple Executives To Rank Alongside Satoshi and Buterin On Crypto Mount Rushmore In an…

  • Crypto Headlines Of The Week: Meme Coins, Meme Stocks, & Ripple Seize Attention

    Another week ends within the crypto realm with a plethora of attention-nabbing developments unfolding. Among these developments, meme coins, meme stocks, and Ripple have emerged as some of the hot topics, nabbing global attention. Here’s a collection of some of the top headlines for this week: Meme Coins Echo Buzz Notably, the meme coin sector emerged…

  • Keyrock hits $1.1B valuation on SC Ventures-led Series C

    Keyrock’s SC Ventures-led Series C values the crypto market maker at $1.1B as it expands from market making into M&A-driven asset and wealth management. Summary Keyrock’s new Series C round, led by Standard Chartered’s SC Ventures, values the crypto market maker at $1.1 billion. Ripple joined as an existing investor, as Keyrock eyes up to…

  • Crypto News: Floki, Flare, Crypto.com, Bybit, and CPI Updates

    Get the latest news with StealthEX and CryptoDaily! This week, we’re bringing you the top stories in the crypto market. Want to know what’s popular right now? Our digest gives you simple insights, new ideas, and the latest updates in cryptocurrency. Stay informed with our easy-to-read coverage, so you don’t miss out on what’s happening…

  • 如何识别和驾驭加密货币交易中的市场极端:井喷式顶部和抛售高潮 | BitMEX Blog

    在交易世界中,识别关键市场模式可以决定盈亏。这在加密货币这种波动性市场中尤为重要。 特别是,有些市场模式有助于预示市场极端,例如井喷式顶部和抛售高潮。它们是至关重要的指标,可以帮助指导人们在特定时间点的交易决策,例如何时买入或卖出。 本文深入探讨了每种模式,如何识别它们,以及有效交易这些指标的方法。 什么是井喷式顶部? 井喷式顶部——通常被认为是“最后的疯狂”——是发生在显著上升趋势结束时的一种现象。井喷式顶部指的是价格突然而急剧上涨之后,紧接着大幅下跌的情景。 你可以将其视为一个危险信号,试图警告你重新考虑你的头寸和交易策略。这种模式通常由投机性交易引起,可以预示资产价格的顶峰(通常先于市场下跌),因此对于交易者来说,识别它至关重要。 在期货交易中,使井喷式顶部特别有趣的是未平仓合约的行为。 井喷式顶部的特征: 价格急剧上涨: 在价格长期上涨之后,市场突然经历价格更加迅速的加速。 成交量激增: 这种急剧上涨伴随着交易量的显著增加,表明市场活动和参与度提高。 未平仓合约下降: 尽管成交量激增,但未平仓合约通常会出现明显下降。这表明交易者正在平仓,可能是在市场达到狂热水平时获利或减少敞口。 井喷式顶部示例 为了更好地描述这种情况,你可以在交易图表中找到井喷式顶部出现的示例,由红色箭头表示。 如何有效交易井喷式顶部 “入市时机先于把握市场时机”这句格言是正确的,因为试图把握市场时机(尤其是在使用杠杆时)很容易适得其反。 然而,成功交易井喷式顶部需要精心设计的策略和对市场动态的深入理解。 第一步是使用上述技术指标和图表模式识别井喷式顶部。一旦识别,交易者应通过趋势分析和交易量等其他工具寻找确认。 交易井喷式顶部的风险管理和注意事项 虽然交易井喷式顶部可以盈利,但它也有其自身的风险,因为它们通常是投机性交易的结果,这使得它们高度波动且不可预测。 这就是为什么在交易此类模式时,设置止损订单等风险管理策略至关重要。 此外,井喷式顶部可能受到一系列因素的影响,包括市场新闻和经济指标。因此,交易者应始终进行尽职调查,不要仅仅依赖图表模式。 什么是抛售高潮? 另一方面,抛售高潮发生在长期下跌趋势的末期。抛售高潮指的是价格急剧而迅速下跌,并伴随着大量的交易活动。 抛售高潮的特征: 价格急剧下跌: 在长期下跌趋势之后,价格突然进一步迅速下跌。 成交量巨大: 下跌伴随着交易量的显著增加,表明交易者的恐慌性抛售和投降。 迅速反弹: 在急剧下跌之后,随着恐慌消退和买盘兴趣回归,价格通常会迅速反弹。 抛售高潮示例 为了更好地描述这种情况,你可以在交易图表中找到抛售高潮出现的示例,如下所示。 如何有效交易抛售高潮 当市场瀑布式下跌时,在没有任何确认反转信号的情况下,重要的是不要试图“接住下跌的刀子”。 抛售高潮的普遍策略是等到“聪明钱”以扩大买入量进入市场并打印出高成交量看涨烛台。 第一步是使用指标和图表模式识别上述前提条件。特定看涨烛台模式的出现,尤其是在伴随高买入量时,可以确认上升趋势: 锤子线: 带有小实体和长下影线的烛台,表明可能反转。 吞噬模式: 看涨吞噬模式,其中一个小看跌烛台之后是一个完全吞噬前一个烛台的较大看涨烛台。 镊子底部: 两个或多个具有相似低价的烛台,表明可能反转。 蜻蜓Doji: 带有长下影线且没有上影线的烛台,表明可能看涨反转。 抛开理论,如果您希望在 BitMEX 上开始交易加密货币衍生品或现货,您可以在此处找到我们所有现有产品。有关交易的更多教育资源,请访问此页面。 想第一时间了解我们的新上架、产品发布、豪礼大放送等信息,我们邀请您加入我们的在线社区并与其他交易者联系。如需了解最新信息,您还可以关注我们的Twitter,或阅读我们的博客和网站公告。 Related Source link

Leave a Reply

Your email address will not be published. Required fields are marked *