Inverted Hammer Candlestick Pattern – Bullish Reversal Signal

Explanation of Inverted Hammer Candlestick Pattern
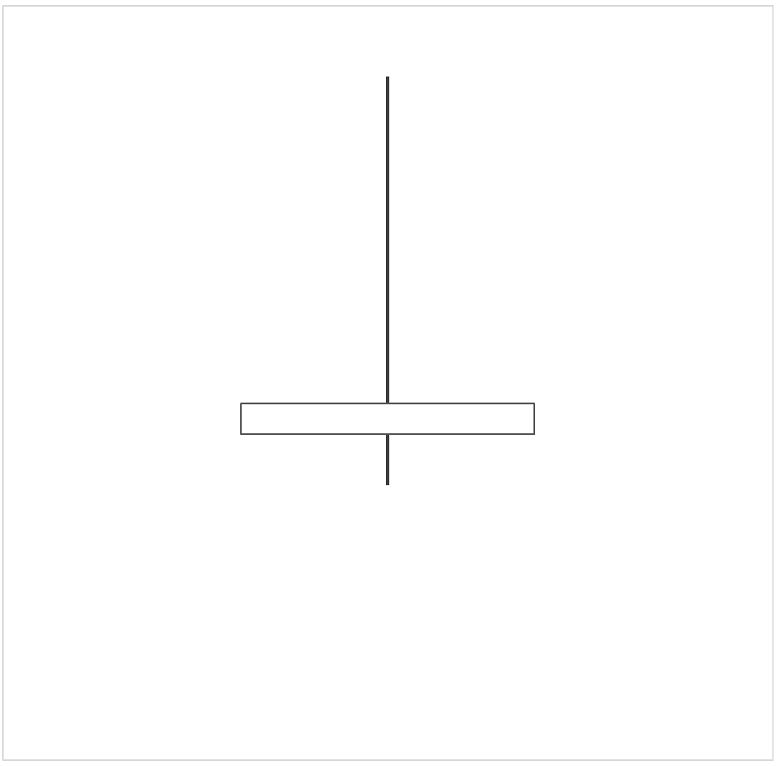
The Inverted Hammer candlestick pattern is a bullish reversal signal that typically forms at the bottom of a downtrend. It features a small real body at the bottom, with a long upper shadow that is at least twice the length of the body. This pattern indicates that, although sellers initially pushed the price lower, buyers stepped in later in the session to drive the price up. This shift from selling to buying pressure signals a potential reversal, where the downward momentum may be weakening, and an upward trend could emerge.
Illustration of Inverted Hammer Candlestick Pattern
The Inverted Hammer candlestick pattern is illustrated below:
Image Metadescription Output
An Inverted Hammer candlestick pattern is characterized by a small real body near the bottom with a long upper shadow, indicating a potential bullish reversal. See more about candlestick patterns at Candlestick Patterns Guide.
Key Pattern Features of the Inverted Hammer Candlestick Pattern
- Small real body near the bottom of the candlestick.
- Long upper shadow, at least twice the size of the real body.
- Appears after a downtrend.
- Signals potential bullish reversal.
Trading Psychology of the Inverted Hammer Candlestick Pattern
The psychology behind the Inverted Hammer reflects an initial attempt by sellers to drive the price lower. However, as the session progresses, buyers gain control and push the price back up, but not enough to surpass the open. This shift suggests that sellers may be losing strength, and buyers are testing the waters for a potential reversal. If confirmed by subsequent bullish price action, the Inverted Hammer indicates that the downtrend could be over, and buyers are ready to take control.
Conventional Approach to Using the Inverted Hammer Candlestick Pattern
In theory, the Inverted Hammer pattern is more likely to signal a bullish reversal in trending down markets. Traders should look for confirmation in the form of a higher close on the next trading session to validate the reversal signal. In low-volatility environments, the pattern can signal more reliable reversals, while high-volatility markets may present false signals. The Inverted Hammer performs better in markets where the downtrend has been strong, as it signals a potential shift in sentiment.
Risk Management Suggestions for the Inverted Hammer Candlestick Pattern
A typical stop-loss for traders using the Inverted Hammer pattern could be placed below the low of the candlestick. This minimizes risk if the reversal does not materialize, as a break below this level would indicate continued downward pressure. Some traders might also consider volatility-based stop-losses, like those derived from ATR, to account for market fluctuations.
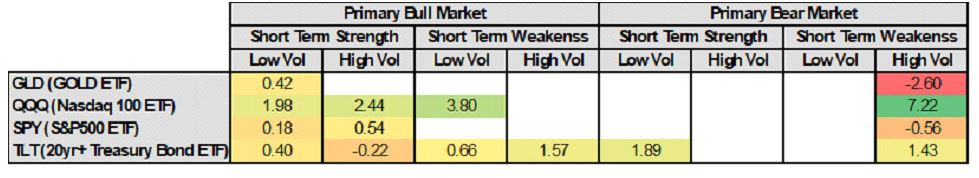
Backtest Performance of Inverted Hammer Candlestick Pattern
The following backtest results show the performance of the Inverted Hammer pattern across different assets:
Pattern Failure Conditions for Inverted Hammer Candlestick Pattern
The Inverted Hammer pattern may fail when it appears during a consolidation phase rather than after a clear downtrend. Additionally, in high-volatility markets, the price might continue to fall even after the Inverted Hammer forms. Without confirmation from subsequent price action (such as a higher close in the following session), the pattern may give false signals.
Systematic Trading Application for Inverted Hammer Candlestick Pattern
The Inverted Hammer can be incorporated into systematic trading strategies as a signal for entering long positions. A common rule could be to enter a long trade after a confirmation candle closes above the Inverted Hammer’s high. Exit rules might include a target based on a moving average or a specific profit level. As with all strategies, traders should thoroughly backtest this setup to ensure it aligns with their trading goals and risk tolerance.
Amibroker Code for Inverted Hammer Candlestick Pattern
// Inverted Hammer Candlestick Pattern AFL Code
InvertedHammer = ((Open = 2 * (Close – Open)) AND ((Close – Low)
Links to Articles About Other Candlestick Patterns
Explore more candlestick patterns and enhance your trading strategy! Visit our Ultimate Candlestick Pattern Guide or explore individual patterns below:
- Doji
- Hammer
- Inverted Hammer
- Bullish Engulfing
- Bearish Engulfing
- Morning Star
- Evening Star
- Shooting Star
- Hanging Man
- Piercing Pattern
- Dark Cloud Cover
- Three White Soldiers
- Three Black Crows
- Dragonfly Doji
- Gravestone Doji
- Spinning Top
- Marubozu
- Tweezer Top
- Tweezer Bottom
- Bullish Harami
- Bearish Harami
- Rising Three Methods
- Falling Three Methods
- Bullish Abandoned Baby
- Bearish Abandoned Baby
- Bullish Kicker
- Bearish Kicker
- Three Inside Up
- Three Inside Down
- Upside Gap Two Crows
- Mat Hold
- Upside Tasuki Gap
- Downside Tasuki Gap
Source link