META stock screams potential! With the stochastic rebounding, the bulls might roar louder than ever! 🐂
Meta Platforms (META) experienced a notable stock price increase on December 24, 2024, driven by multiple factors ranging from overall market sentiment to strong financial performance. This growth cements Meta’s position as a leading player in the tech sector, making it an essential company for investors to follow.
Positive Market Sentiment Drives Growth
On Christmas Eve, the broader market saw a rally, with the Magnificent Seven big tech stocks, including Meta, leading the charge. This collective momentum reflected heightened investor optimism, boosting Meta’s stock price along with its peers. The broader rally demonstrates Meta’s standing within the tech elite, which directly benefits from bullish market trends.
Impressive Financial Performance Boosts Confidence
Meta’s robust financial results have played a key role in its recent stock surge. For the third quarter ending September 30, 2024, Meta reported a remarkable 18.9% year-over-year revenue increase to $40.59 billion. Even more impressive, its net income rose by 35.4% to $15.68 billion. These figures not only underscore Meta’s operational efficiency but also enhance investor confidence in the company’s growth trajectory.
Optimistic Projections for Future Earnings
Investor optimism is further fueled by positive forecasts for Meta’s upcoming earnings. Analysts predict a 26.5% year-over-year increase in earnings per shareEarnings per share (EPS) is a fundamental financial metric that provides valuable insights into a company’s profitability. This widely used indicator helps investors and analysts g… (EPS) and a 17.2% revenue growth for the quarter ending December 31, 2024. These expectations highlight Meta’s continued ability to outperform, reinforcing its appeal to investors.
Industry-Leading Financial Metrics
Meta’s financial ratios significantly outshine industry averages. With a trailing-12-month EBIT margin of 41.61%—318.9% higher than the industry average—and a net income margin of 35.55%—an extraordinary 844.1% above the industry benchmark—Meta showcases exceptional profitability. Such metrics make it a standout investment in the competitive tech sector.
AI Leadership as a Catalyst
Meta’s leadership in artificial intelligence (AI) development has been a critical driver of its stock performance in 2024. As AI technologies revolutionize industries, Meta’s innovative approach and substantial investments in AI keep it at the forefront of this transformative trend, offering significant long-term growth potential.
Strong Year-to-Date Performance
Meta’s stock has risen 72.36% year-to-date as of December 24, 2024, significantly outperforming the S&P 500 index, which has gained 27.70% over the same period. This sustained performance showcases Meta’s ability to deliver consistent returns, reinforcing its position as a reliable and lucrative investment.
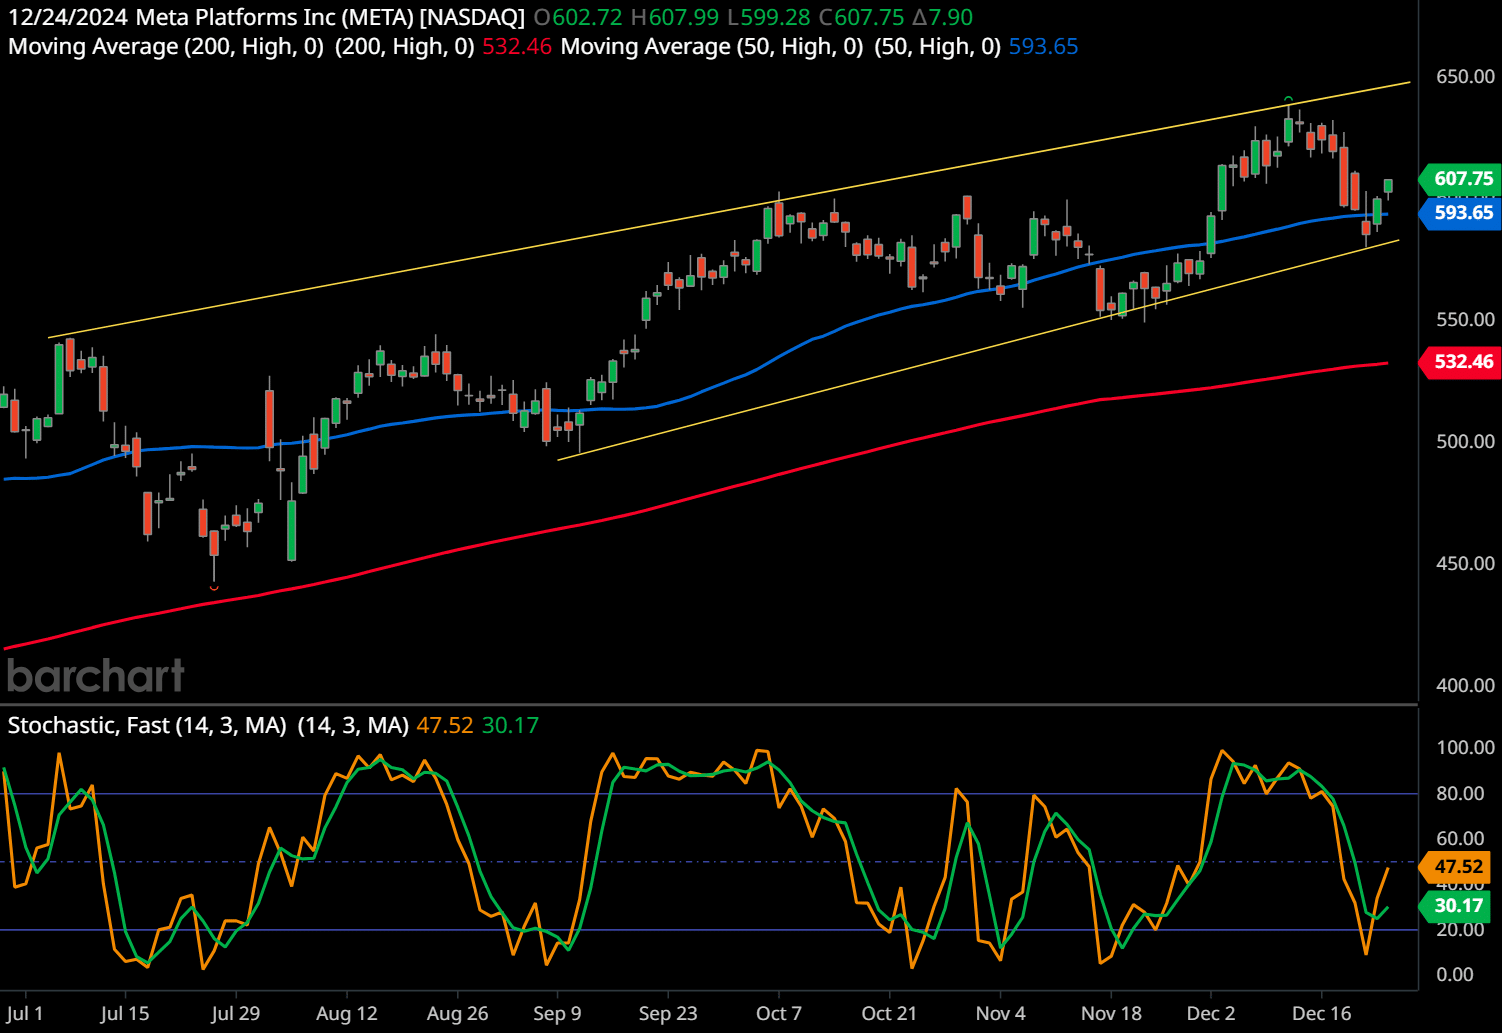
This is a daily chart for Meta Platforms (META) as of December 24, 2024. Below is a comprehensive technical analysis based on the visual elements in the chart:
- Support and Resistance Levels:
- Support: The 200-day moving averageThe concept of moving averages dates back to the early 20th century. While it is challenging to attribute the invention of moving averages to a single individual, W. P. Hamilton, a… (red line) at approximately $532.46 serves as a strong long-term support level.
- Resistance: The upper boundary of the yellow uptrend channelUptrend and downtrend channel patterns are technical analysis tools used to identify potential future price movements. They are formed by two parallel lines on a chart and can be u…, around $650, is acting as resistance.
- Additional short-term support is visible near the 50-day moving averageThe concept of moving averages dates back to the early 20th century. While it is challenging to attribute the invention of moving averages to a single individual, W. P. Hamilton, a… (blue line) at $593.65.
- Trend Analysis and Uptrend ChannelUptrend and downtrend channel patterns are technical analysis tools used to identify potential future price movements. They are formed by two parallel lines on a chart and can be u…:
- The yellow lines highlight a well-defined ascending channel. This indicates that the stock is in a consistent uptrend, with higher highs and higher lows.
- The channel suggests strong bullish momentum as traders repeatedly push the price higher within this range.
- Psychology: The channel reflects optimism among investors. Buyers are stepping in during pullbacks near the lower boundary, while profit-taking occurs near the upper boundary.
- Indicators (Stochastic OscillatorThe Stochastic Oscillator is a momentum indicator used in technical analysis to determine the relationship between an asset’s closing price and its price range over a specific peri…):
- The Stochastic OscillatorThe Stochastic Oscillator is a momentum indicator used in technical analysis to determine the relationship between an asset’s closing price and its price range over a specific peri… shows a recent rebound from oversold levels (below 20). Currently, the %K line (orange) is crossing above the %D line (green), suggesting a potential bullish reversal.
- With the oscillator in the 30 range, the price might begin another upward move, though confirmation is needed.
- Stock Price Forecast:
- Short-term: The recent bounce near the 50-day moving averageThe concept of moving averages dates back to the early 20th century. While it is challenging to attribute the invention of moving averages to a single individual, W. P. Hamilton, a… suggests a possible retest of the upper channel boundary ($650). If the price breaks above $650, it could signify accelerated bullish momentum.
- Medium- to Long-term: The consistent uptrend and supportive 200-day moving averageThe concept of moving averages dates back to the early 20th century. While it is challenging to attribute the invention of moving averages to a single individual, W. P. Hamilton, a… suggest the trend remains upward, barring any significant macroeconomic changes.
- Chart PatternsChart patterns are visual formations on price charts that occur due to the behavior of buyers and sellers in the market. These patterns often signal potential future price movement…:
- Ascending Channel: This is the dominant pattern. It indicates a strong and stable uptrend with periodic pullbacks. The pattern suggests continued strength unless the price decisively breaks below the lower boundary.
- No significant reversal patterns, such as head-and-shoulders or double tops, are visible within this chart.
- Trading Plans:
- Swing Trading Plan:
- Entry: Near the 50-day moving averageThe concept of moving averages dates back to the early 20th century. While it is challenging to attribute the invention of moving averages to a single individual, W. P. Hamilton, a… ($593) or during a stochasticThe Stochastic Oscillator is a momentum indicator used in technical analysis to determine the relationship between an asset’s closing price and its price range over a specific peri… pullback towards the oversold zone.
- Target: $645–$650 (upper channel boundary).
- Stop-loss: $580 (below the 50-day moving averageThe concept of moving averages dates back to the early 20th century. While it is challenging to attribute the invention of moving averages to a single individual, W. P. Hamilton, a… and recent lows).
- Long-term Trading Plan:
- Entry: On dips near the 200-day moving averageThe concept of moving averages dates back to the early 20th century. While it is challenging to attribute the invention of moving averages to a single individual, W. P. Hamilton, a… ($532–$550).
- Target: $700+ over the next 12 months, assuming the channel and broader trend continue.
- Stop-loss: A decisive break below $520, signaling a trend reversal.
- Swing Trading Plan:
The chart indicates continued bullish momentum in the medium to long term. However, traders should monitor key support levels and respect the channel boundaries for swing opportunities. The stochasticThe Stochastic Oscillator is a momentum indicator used in technical analysis to determine the relationship between an asset’s closing price and its price range over a specific peri… suggests short-term strength is building.
Past performance is not an indication of future results. This analysis should not be considered investment advice. Always conduct your own research and consider consulting with a financial advisor before making any investment decisions. 🧡
Why Meta is Important for Investors
Meta Platforms represents a blend of strong financial performance, market leadership in AI, and industry-leading metrics. Its consistent ability to outperform both peers and benchmarks highlights its value as a cornerstone in any tech-focused investment strategy. As AI and digital innovation continue to drive the future, Meta remains a key player to watch.
Do you have a news tip for GuerillaStockTrading? Please email us at
[email protected]
🗨️ JOIN OUR COMMUNITY OF STOCK TRADERS AND INVESTORS ON SOCIAL MEDIA
💥 GET OUR LATEST CONTENT IN YOUR RSS FEED READER
We are entirely supported by readers like you. Thank you.🧡
At GuerillaStockTrading, we maintain full transparency and impartiality; we never blog about stocks or crypto in which we hold a personal position unless explicitly stated in the article. Additionally, we do not accept paid promotions presented as content. All information shared is for informational purposes only and should not be construed as financial, investment, tax, or legal advice, nor as a recommendation to buy any security or financial asset. The content is general in nature and does not account for individual circumstances. It may not be suitable for your particular situation. Before making financial decisions, you are encouraged to seek guidance from your own financial or investment advisor.