Inauguration Effect? Bitcoin Whales Start Accumulating As Trump Era Begins

Inauguration Effect? Bitcoin Whales Start Accumulating As Trump Era Begins


Este artículo también está disponible en español.

Following Donald Trump’s inauguration on January 20th, Bitcoin (BTC) has remained range-bound, trading between $101,000 to $110,000. However, a new report by CryptoQuant states that behind this routine price action, Bitcoin ‘whales’ are quietly back to accumulating the premier cryptocurrency.

Bitcoin Whales Back In Accumulation Mode

According to the report, large BTC holders – commonly referred to as Bitcoin ‘whales’ – have re-entered the accumulation phase. Recent data shows a significant uptick in the monthly percentage growth of BTC holdings among these large investors.

Related Reading

Notably, Bitcoin whale holdings increased from a decline of -0.25% on January 14 to a growth of 2% by January 17, marking the highest monthly growth rate since mid-December. In absolute terms, these investors’ BTC holdings rose from 16.2 million on November 4 to 16.4 million as of January 24.

The surge in whale accumulation appears to be driven by several bullish developments early in Trump’s administration. For example, the US president has already signed an executive order establishing a Working Group on Digital Asset Markets.

This Working Group has been tasked with proposing a federal regulatory framework for cryptocurrencies – including stablecoins – within six months. Additionally, the group will evaluate the potential creation of a national digital asset stockpile, fueling speculation about a potential US strategic Bitcoin reserve.

Besides growth in whale holdings, selling pressure for BTC has declined sharply since major profit-taking in December. This aligns with a recent report which found that BTC profit-taking has dropped by 93% from its December peak. The report reads:

Bitcoin holders realized daily profits as high as $10 billion as Bitcoin approached $100K in December. However, daily realized profits have fallen to levels around $2-$3 billion in January, which indicates market participants may have finished selling Bitcoin for the most part. Moreover, the traders’ unrealized profit margins have declined near zero, a level which typically marks a price floor during bull markets.

However, the report also highlights that overall Bitcoin spot demand has weakened over the past month, raising concerns about the likelihood of another bullish rally. Specifically, the rate of demand growth for Bitcoin has fallen from 279,000 BTC in early December to just 75,000 BTC at the time of writing.

Analysts Confident Of Another BTC Rally

Despite the cooling of on-chain demand, crypto analysts remain optimistic about another major price rally for Bitcoin. For instance, a recent report suggested that BTC could target a price as high as $249,000 during Trump’s presidency.

Related Reading

Another report by Bitfinex predicted that BTC is likely headed to $200,000 by mid-year amid mild price pullbacks. However, a lot depends on how the US Federal Reserve handles interest rate adjustments this year.

From a technical standpoint, BTC’s cup-and-handle pattern projects a price target of as high as $275,000. At press time, BTC trades at $106,074, up 0.1% in the past 24 hours.

bitcoin
BTC trades at $106,074 on the daily chart | Source: BTCUSDT on TradingView.com

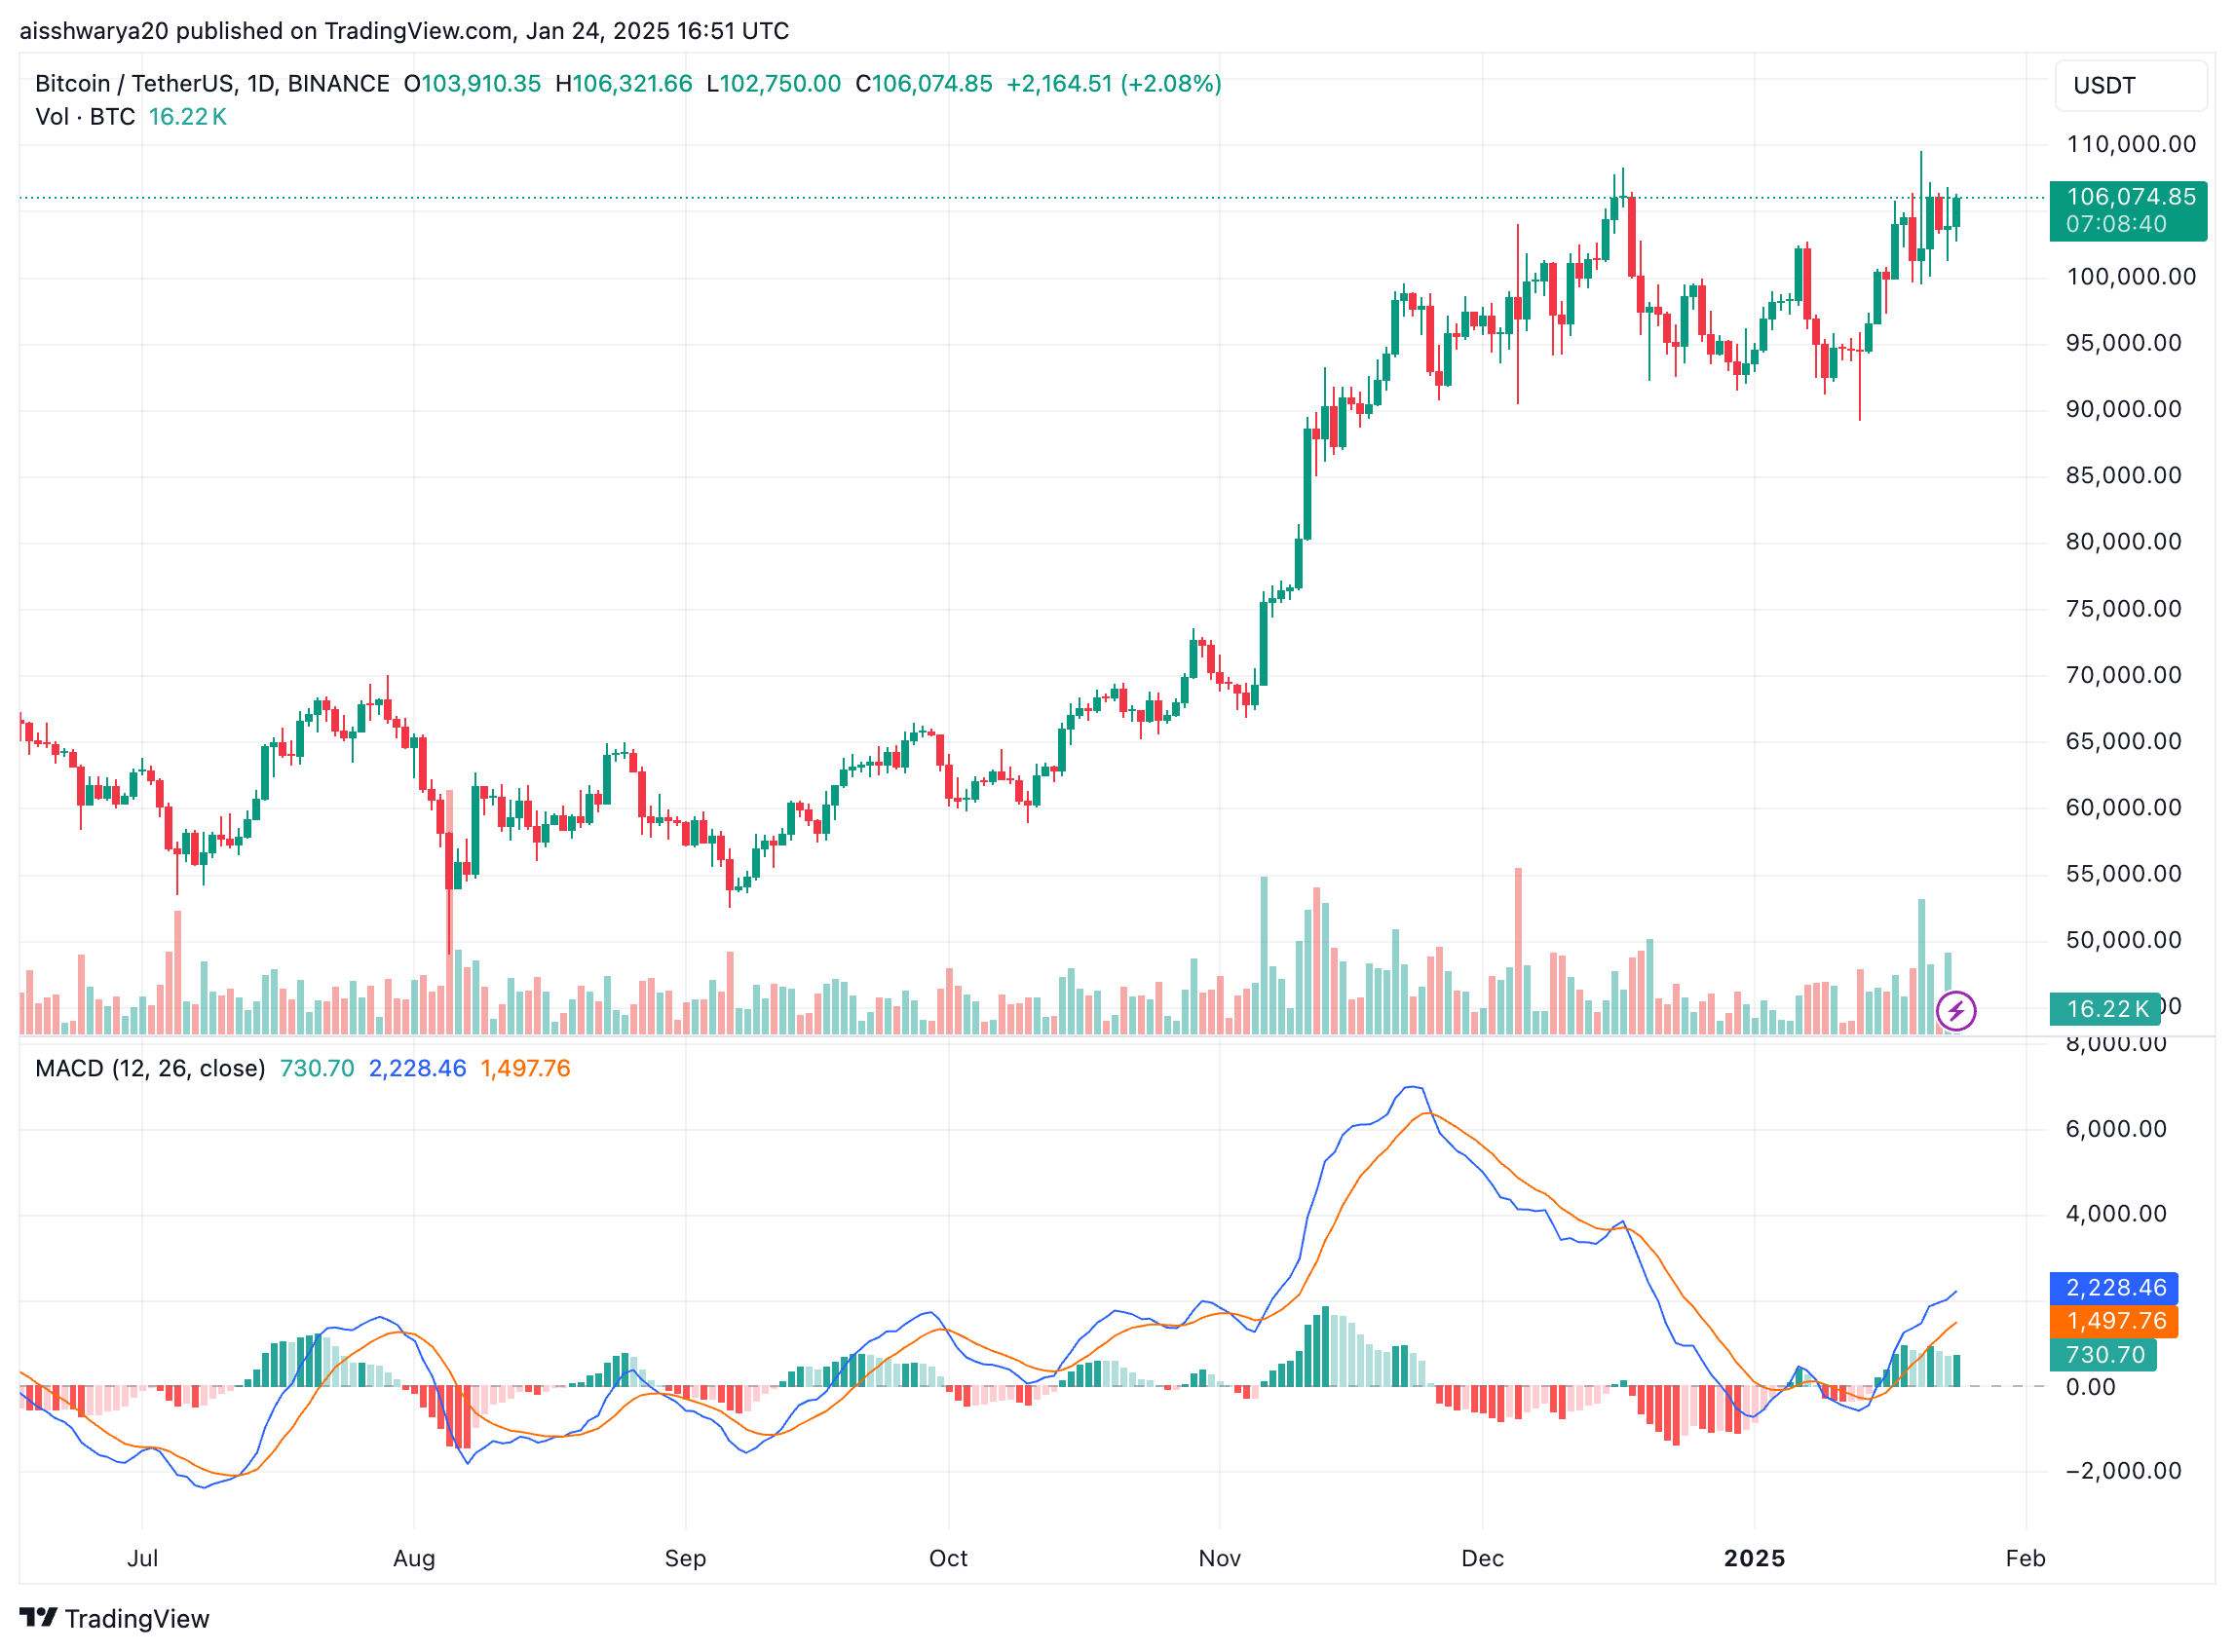
Featured image from Unsplash, Chart from TradingView.com

Source: https://www.newsbtc.com/bitcoin-news/inauguration-effect-bitcoin-whales-start-accumulating-as-trump-era-begins/


Source link

Similar Posts

  • Proton Wallet — Now Available To Everyone — Is A Great Starter Self-Custodial Bitcoin Wallet

    Follow Frank on X. In July of last year, Swiss privacy tech company Proton (makers of Proton Mail) announced it would be launching its own bitcoin wallet — Proton Wallet. I (along with about 100,000 other users) was given early access to the wallet to test it out and was impressed with the wallet’s user…

  • CoinDesk 20 Performance Update: Index Plunges 6.2% as All Constituents Trade Lower

    CoinDesk Indices presents its daily market update, highlighting the performance of leaders and laggards in the CoinDesk 20 Index. The CoinDesk 20 is currently trading at 3683.7, down 6.2% (-241.91) since 4 p.m. ET on Monday. None of the 20 assets are trading higher. Leaders: BTC (-3.9%) and BCH (-5.6%) lead. Laggards: NEAR (-9.9%) and…

  • LayerZero’s ZRO crypto gets a rough start: Can it recover soon?

    Layer Zero’s ZRO listed on Binance amongst other exchanges. Price plummeted, community unhappy with the airdrop. LayerZero[ZRO] recently began distributing its ZRO tokens via an airdrop, with major crypto exchanges announcing their listings. However, the excitement surrounding these listings was tempered by frustration over the airdrop rewards, which many participants found disappointing. New airdrop in…

  • 第二部分:三角形的作用 | BitMEX Blog

    本文将深入探讨三角延续模式,以及它们的角度如何帮助您将交易提升到新的水平。它延续了之前对图表模式及其不同类型(旗形、尖旗形和楔形)基础知识的探讨。 当价格的最高点和最低点逐渐收敛形成三角形图案时,就会观察到三角形模式。 什么是三角模式? 当价格的最高点和最低点逐渐收敛形成三角形图案时,就会观察到三角形模式。 三角形模式可分为三大类:上升三角形、下降三角形和对称三角形。 什么是上升三角形模式? 上升三角形是交易中的看涨模式。它由一条水平阻力线和一条上升的下趋势线组成,形成三角形形状。 上升三角形模式的指标有哪些? **趋势线:**上升三角形由两条趋势线组成。顶部趋势线是水平的,连接摆动高点,底部趋势线是垂直的,连接更高的低点。 **收敛线:**随着模式的进展,两条趋势线的收敛形成三角形形状。这表明买盘动能增加,卖方积极围绕支撑位交易。 **成交量:**通常,随着价格接近顶点(两条趋势线的交点),成交量趋于下降。成交量上升的突破被认为比成交量低的突破更重要。 如何确认上升三角形模式? 突破确认:交易者通常在价格突破上升趋势线时寻求上升三角形模式的确认。突破表明卖压已解除,可能引发上涨走势。 成交量确认:为了使突破被视为有效,与模式盘整阶段的成交量相比,应观察到成交量显著增加。 什么是下降三角形模式? 下降三角形表明价格在突破前很可能发生盘整。 下降三角形模式是最常见的看跌延续模式之一。它由一系列较低的高点(价格从未突破下降阻力线)和一系列水平支撑线(连接相对相等的一系列低点)组成。 该模式表明看跌趋势可能延续,因为卖压依然存在,买方难以推动价格上涨。 下降三角形模式的指标有哪些? 趋势线:下降三角形的特征是两条趋势线在顶部连接(较低的高点),在底部连接(水平或较低的低点)。这表明顶部有下降阻力线,底部有明确的支撑位。 收敛趋势线:水平支撑线和下降阻力线相交,形成三角形形状。突破通常发生在接近交点时。 成交量:随着价格接近三角形的最右角,交易量下降,并在突破时突然飙升。 如何确认下降三角形模式: 突破确认:当图表突破水平支撑线时,就会发生突破。突破然后通过价格向下移动来测试明确的支撑位。 成交量确认:伴随交易量增加的突破确认了该模式,并增加了显著价格变动的可能性。 价格目标:三角形的垂直高度通常在最宽点(最高点和水平支撑线之间)测量。从该点到突破点的距离被预测为潜在价格目标。 什么是对称三角形模式? 对称三角形由收敛趋势线组成,它们在一点处相交形成三角形形状。该模式表示不确定时期和潜在的价格突破。 该模式的明确性质也可以反映市场动态,可以利用其形成更复杂的交易策略,例如分析看涨或看跌情景。 对称三角形模式的指标有哪些? 价格行为和趋势线:对称三角形模式由两条线组成——第一条上升的低点线和第二条连接一系列下降高点的线。然后趋势线收敛形成一个完美的对称三角形。当价格两次与每条趋势线相交,导致多个接触点时,该模式得到确认。 成交量分析:在对称三角形形成过程中观察交易量至关重要。随着价格接近三角形的最右角,交易量趋于下降,这表明市场活动和信心低下。 持续时间:对称三角形模式通常是短期模式。 突破确认:交易者通常寻求明确的突破,这通常伴随着交易量增加和突破方向的显著价格变动。模式稳健性的确认是未来交易决策的基础。 测量目标:交易者通常采用测量技术来确定突破后的潜在价格目标。该技术涉及确定三角形在最宽点的高度(趋势线之间的垂直距离),并将从该点到突破方向的距离投射。这可以用来估计粗略的价格变动目标。 如何使用延续模式进行交易: 1. 识别趋势线 检查图表上已有的模式——延续模式之前价格是否有任何差异? 如果是,它是增加还是减少?这在确定潜在突破中起着作用。 2. 找到突破点 交易者只能根据突破点和趋势方向获利。一些人可能在反转期间获利。 3. 交易 进行您的交易。 本系列的第四部分将涵盖延续模式中的颈线模式,例如杯柄形、头肩形以及如何识别它们。 除了理论,如果您希望开始在 BitMEX 上交易加密衍生品或现货,您可以在此处找到我们所有现有产品。有关 BitMEX 交易的更多教育资源,特别是衍生品,请访问此页面。要第一时间了解我们的新上架、产品发布、豪礼大放送等,我们邀请您加入我们的在线社区之一,并与其他交易者联系。要了解最新信息,您还可以关注我们的 Twitter,或阅读我们的博客和网站公告。 Related Source…

  • Frost Drops by BGaming at MetaWin: Win $80K in Prizes! | BitcoinChaser

    Dynamic Frost Drops Festival by BGaming is here to heat up your winter with an $80,000 prize pool! Hosted on the decentralized gambling platform MetaWin, this event features over 2,800 random cash drops. Players can enjoy thrilling gameplay on BGaming’s top slots while standing a chance to win big. The festival runs until January 31,…

Leave a Reply

Your email address will not be published. Required fields are marked *