
JavaScript Disabled

by Chad Shoop
Chad is a Chartered Market Technician (CMT) who specializes in stock and options trading. For over 12 years, he’s led some of the largest trading research firms on the planet.
Every trader has been there.
You spot what looks like the perfect setup. The price is moving just right, the indicators line up, and everything about it screams opportunity.
You jump in, expecting a smooth ride to profit. Then the market does what it always does.
It tests your patience.
It pulls back, maybe it even dips below your entry, making you second-guess everything.
This moment – when emotions take over and doubt creeps in – is where most traders go wrong.
Not because they picked a bad trade, but because they didn’t have a plan for managing it. Trade management isn’t about finding the perfect entry.
It’s about knowing exactly where your trade is valid, where it isn’t, and when to take your profits.
The Biggest Trading Mistake (That’s Totally Avoidable)
Most traders make one of two critical mistakes. Either they exit too early, locking in a small gain but leaving the bigger move behind, or they hold on too long, watching a profitable trade turn into a loser.
Both mistakes stem from the same problem: not having predefined take-profit and stop-loss levels.
When you set these levels before entering a trade, you take emotion out of the equation.
You already know where the trade is expected to go and, just as importantly, where it no longer makes sense to hold on. Without this plan in place, every trade becomes a guessing game.
What if a Tool Could Tell You Exactly Where to Exit?
Some traders spend years refining their ability to find turning points in the market.
Others rely on structured price movements, such as patterns that naturally occur over and over again.
Right now, one of these patterns is playing out on a major stock. It has already reached a critical level, and traders who recognize what’s happening are preparing for the next move.
The pattern has mapped out expected profit targets and the exact level where the trade would no longer be valid.
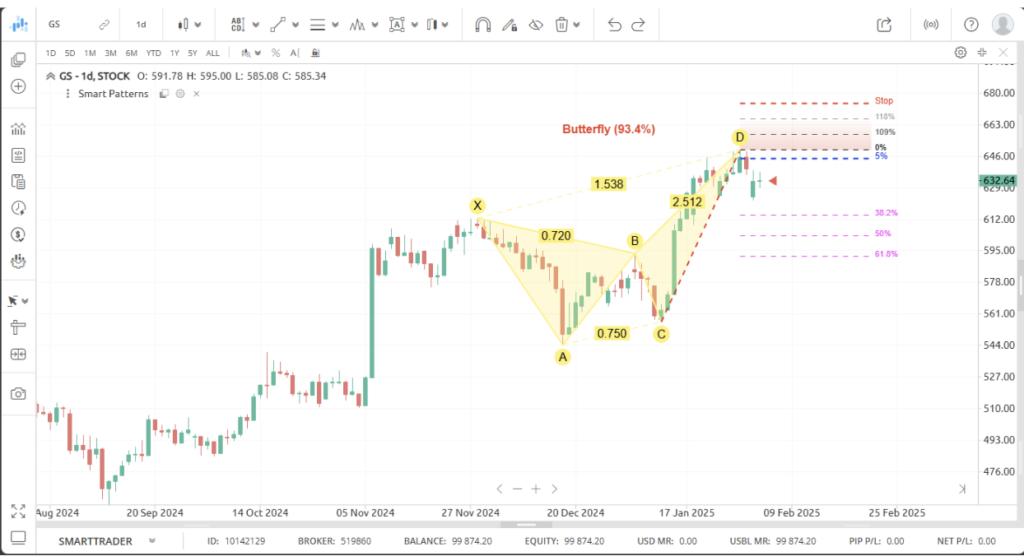
Goldman Sachs has More Room to Falling Harmonic Trading
The stock in question is investment banking giant, Goldman Sachs (GS).
Financials in general are seeing robust growth. This may mean longer-term profits for those who are patient.
For traders, we are eying the short-term moves, for entry and exit points.
Based on the Harmonic Butterfly Pattern, we know the expectation is for GS to dip from here.
This chart depicts two things.
And it’s the confirmation of a Butterfly Pattern that is telling us this.
First, we have a clear stop-loss levels, ranging from $650-$680 to exit a bearish trade. And, just as important, we have clear take profit levels from $612-$590 to the downside.
Knowing these expected moves and key levels, you can use stock and options to strategize around this move for profits.
Signs are pointing to a sharp downward move, indicating a potential for a bearish strategy at this moment.
All thanks to this smart tool, a harmonic butterfly pattern, you know exactly what to watch for when entering a trade – or maybe holding off on that bullish trade for now.
Smart Patterns: The Trade Management Shortcut
Most traders spend too much time trying to find the next trade when they should be focused on managing the ones they already have.
That’s what makes structured trade management so powerful. Instead of reacting to the market in real time, you’re following a pre-set plan that removes second-guessing.
SmartTrader’s Smart Patterns tool, which automatically highlighted the butterfly pattern on GS, identifies these trade setups in real time, instantly marking the expected move, take-profit zones, and stop-loss levels.
There’s no need for guesswork or complicated analysis. It’s all laid out the moment a pattern forms.
The move is already in motion. The question is, do you have a plan for what comes next?
To explore these patterns in detail and see how they can fit into your own trading strategy, check out our free ebook on Harmonic Trading.
Click here to get your free copy today.
#StockMarket #TradingStrategies #HarmonicPatterns #AMZN #TechnicalAnalysis #ButterflyPattern #FibonacciTrading #InvestingTips
The post Struggling with Trade Management? Try This Smart Tool appeared first on Market Traders Institute.
Source link