Rocket Lab’s Stock Soars Amid Successful Satellite Deployment and Growth Momentum

Rocket Lab USA (NASDAQ: RKLB) witnessed a significant stock surge of 11.6% on February 10, 2025, closing at $30.54. The rally was largely fueled by the company’s latest successful satellite launch and its continued operational momentumMomentum in stock trading refers to the rate of acceleration of a stock’s price or trading volume. It indicates the strength of a trend and measures how quickly prices are rising o…. The increase in stock price reflects investor confidence in Rocket Lab’s ability to execute complex missions and expand its market presence in the rapidly growing space industry.
Rocket Lab Strengthens Market Position with Successful Satellite Launch
A major catalystIn stock trading, a catalyst refers to an event, news, or announcement that causes a significant and often rapid price movement in a stock or the broader market. Catalysts can be p… behind the stock’s rise was Rocket Lab’s successful deployment of five satellites for Kinéis, a French IoT operator, as part of the company’s 59th Electron mission. This launch marked the fourth of five planned missions aimed at completing Kinéis’ 25-satellite constellation. With the final deployment expected in the near future, Rocket Lab has demonstrated its efficiency in executing multi-launch contracts.
CEO Peter Beck underscored the significance of the project’s rapid timeline, noting that the Kinéis constellation will be fully operational in under a year, a pace that is notably faster than industry norms. The ability to execute a satellite networkIn the context of cryptocurrency, a network refers to the interconnected system of computers, nodes, and software that work together to support and maintain the functioning of a sp… deployment in such a short time frame highlights Rocket Lab’s competitive edge in the small satellite launch market.
The company’s stock showed strong intraday performance, climbing nearly 10% to a peak of $31.08 before settling at its closing price. This surge continues a remarkable 12-month rally of nearly 600%, underscoring growing investor enthusiasm for Rocket Lab’s technological capabilities and market expansion strategy.
Financial Performance and Strategic Growth
Rocket Lab’s impressive stock performance has been supported by robust financial growth. The company’s revenue increased 55% year-over-year in Q3 2024, driven by heightened demand for both its launch services and spacecraft components. The company’s backlog has also expanded significantly, reaching $1.05 billion, an 80% year-over-year increase, reinforcing strong demand for its services.
A key component of Rocket Lab’s growth strategy is the development of its Neutron rocket, a medium-lift vehicle designed to carry payloads of up to 13,000 kilograms to orbit. The Neutron rocket, set for its first launch in late 2025, positions Rocket Lab as a strong competitor to SpaceX’s Falcon 9, potentially allowing the company to secure a larger share of the commercial and government space launch market.
In addition to launch services, Rocket Lab has secured a multi-launch agreement with BlackSky, a company specializing in high-resolution Earth imagery. The agreement will see Rocket Lab deploy Gen-3 satellites, which feature 35-centimeter resolution imaging, making them particularly valuable for defense and intelligence applications. This partnership reinforces Rocket Lab’s growing role in national security and geospatial intelligence, a sector experiencing increasing demand.
With the global space economy projected to reach $1.8 trillion by 2035, Rocket Lab is well-positioned to benefit from expanding commercial satellite and defense-related space operations. Its combination of frequent launches, in-house manufacturing, and end-to-end satellite deployment solutions provides the company with a strategic advantage in a rapidly evolving industry.
Analyst Sentiment and Investment Outlook
Despite Rocket Lab’s negative P/E ratioThe price-to-earnings ratio, often abbreviated as P/E ratio, is a fundamental metric used by investors and analysts to evaluate the relative value of a company’s shares in the stoc… of -80.53, analysts remain optimistic about the company’s long-term growth potential. The stock currently holds a “Buy” rating with a median price target of $29, reflecting expectations for sustained revenue expansion and increased market penetration. Analysts have pointed to Rocket Lab’s vertical integration, which includes in-house development of separation systems and other key spacecraft components, as a critical factor in its operational efficiency.
Rocket Lab’s consistent launch cadence and ability to execute complex missions set it apart in the space sector, an industry that has historically been dominated by a few major players. The company’s demonstrated ability to secure multi-launch contracts, expand its technology portfolio, and develop new rocket capabilities positions it as a formidable competitor in the rapidly growing space economy.
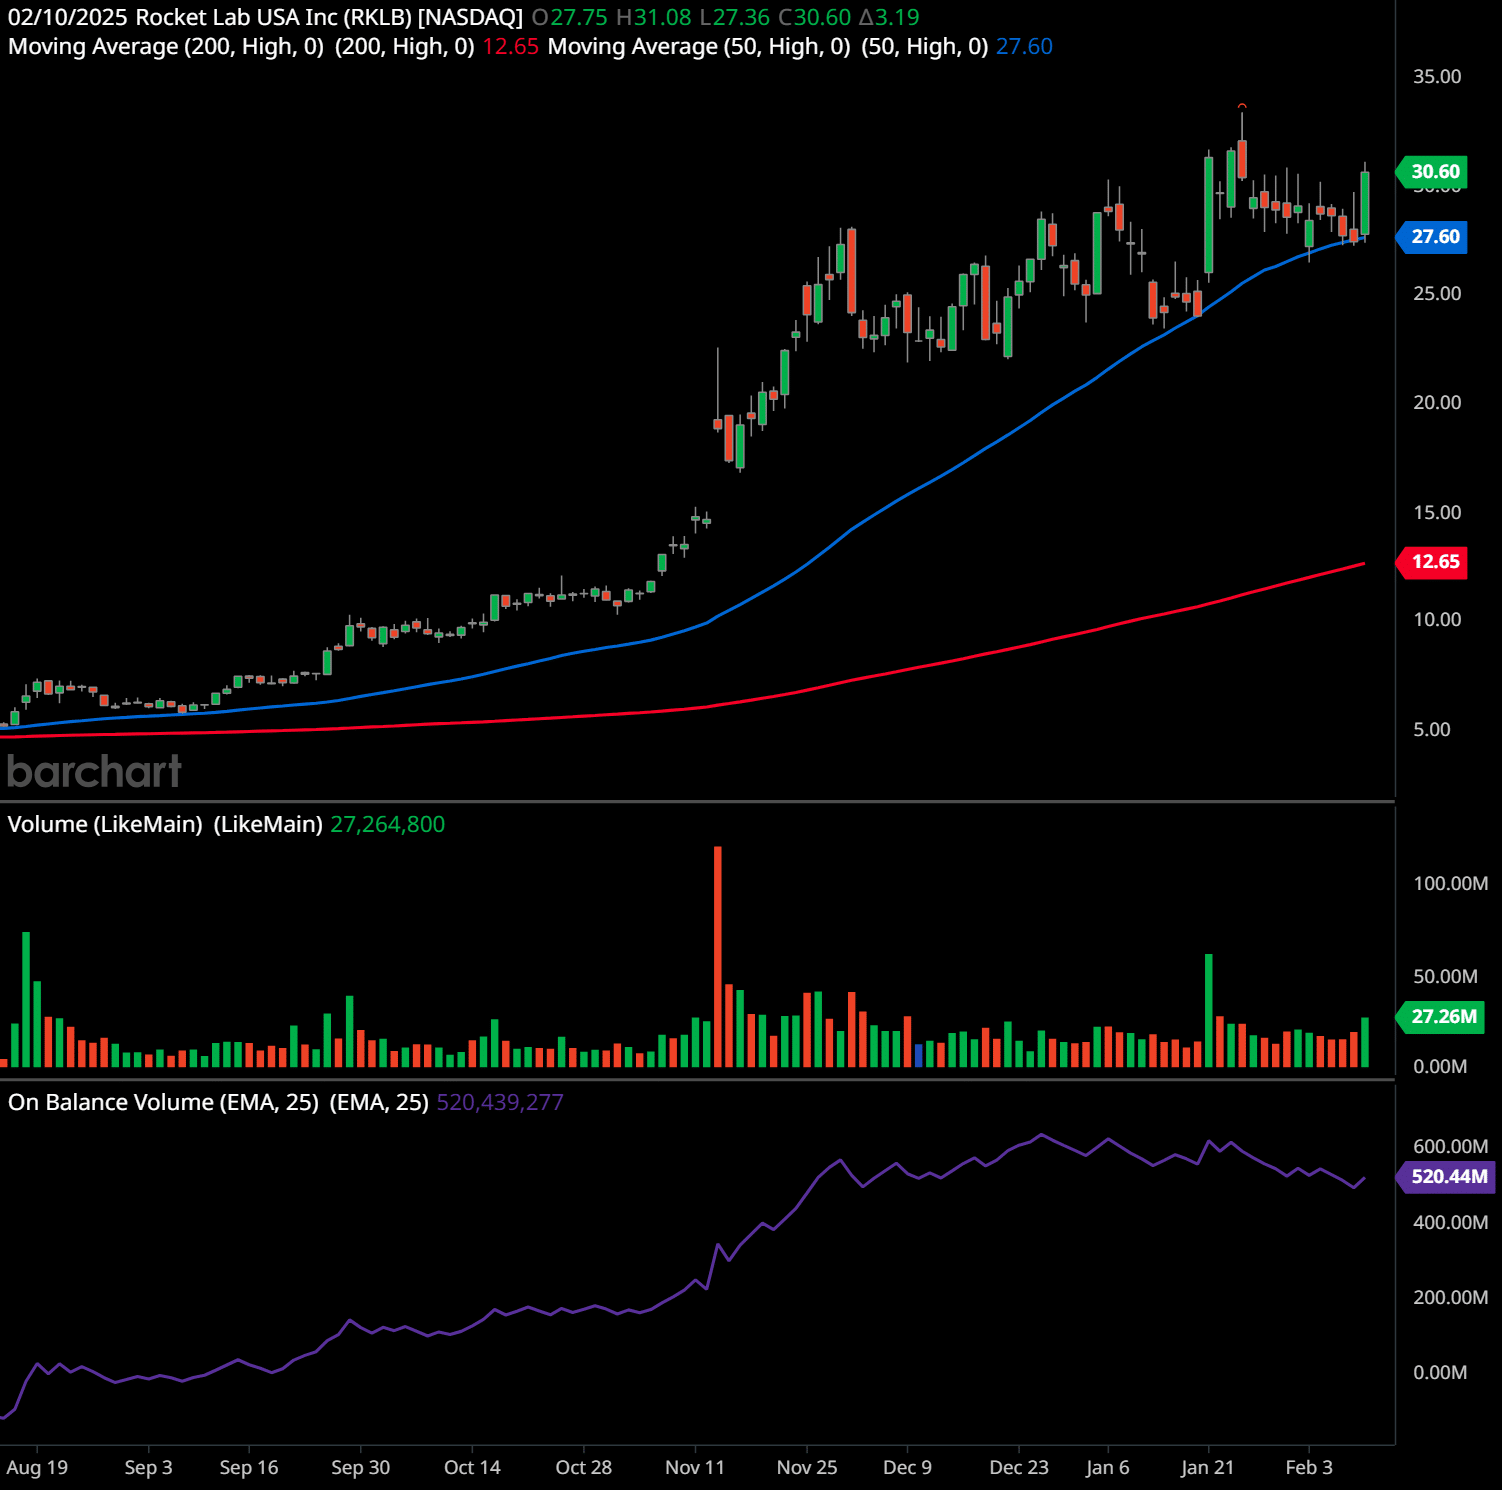
RKLB Trading Plan
The daily chart of Rocket Lab USA Inc. (RKLB) shows a strong uptrend with the stock currently trading at 30.60, up 3.19 points. The price is above both the 50-day moving averageThe concept of moving averages dates back to the early 20th century. While it is challenging to attribute the invention of moving averages to a single individual, W. P. Hamilton, a… (27.60) and the 200-day moving averageThe concept of moving averages dates back to the early 20th century. While it is challenging to attribute the invention of moving averages to a single individual, W. P. Hamilton, a… (12.65), indicating a sustained bullish trend.
Support and resistance levels:
Key support is around 27.60, which aligns with the 50-day moving averageThe concept of moving averages dates back to the early 20th century. While it is challenging to attribute the invention of moving averages to a single individual, W. P. Hamilton, a…. A break below this level could indicate a short-term pullback. The 200-day moving averageThe concept of moving averages dates back to the early 20th century. While it is challenging to attribute the invention of moving averages to a single individual, W. P. Hamilton, a… at 12.65 is a major long-term support level.
Resistance appears around the 35.00 level, where previous price action has seen selling pressure. If RKLB breaks above this level with strong volume, it could indicate another leg up.
Future trend indication:
The stock remains in a strong uptrend, showing a series of higher highs and higher lows. The upward-sloping 50-day and 200-day moving averagesThe concept of moving averages dates back to the early 20th century. While it is challenging to attribute the invention of moving averages to a single individual, W. P. Hamilton, a… confirm bullish momentumMomentum in stock trading refers to the rate of acceleration of a stock’s price or trading volume. It indicates the strength of a trend and measures how quickly prices are rising o…. However, some consolidation is happening near current levels, suggesting a possible continuation pattern or a temporary pause before further upside.
Chart patternsChart patterns are visual formations on price charts that occur due to the behavior of buyers and sellers in the market. These patterns often signal potential future price movement… and psychology:
The chart suggests a possible bullish continuation pattern such as a flag or a consolidation range. The recent price action shows buyers stepping in at the 50-day moving averageThe concept of moving averages dates back to the early 20th century. While it is challenging to attribute the invention of moving averages to a single individual, W. P. Hamilton, a…, reinforcing this level as support. The overall trend is driven by strong demand, as seen in the on-balance volumeThe On Balance Volume indicator (OBV) is a technical analysis tool used to measure the flow of money into and out of a security over a specified period of time. It is a cumulative … (OBVThe On Balance Volume indicator (OBV) is a technical analysis tool used to measure the flow of money into and out of a security over a specified period of time. It is a cumulative …), which remains elevated. This suggests that institutional accumulation is likely occurring.
Indicators and trader psychologyTrader psychology refers to the emotions and mental states that influence a trader’s decision-making process in financial markets. Emotions such as fear, greed, hope, and regret …:
- The moving averagesThe concept of moving averages dates back to the early 20th century. While it is challenging to attribute the invention of moving averages to a single individual, W. P. Hamilton, a… indicate strong bullish momentumMomentum in stock trading refers to the rate of acceleration of a stock’s price or trading volume. It indicates the strength of a trend and measures how quickly prices are rising o….
- Volume spikes on upward moves suggest buyers are stepping in aggressively.
- The OBVThe On Balance Volume indicator (OBV) is a technical analysis tool used to measure the flow of money into and out of a security over a specified period of time. It is a cumulative … trend suggests sustained buying pressure.
- The overall price action reflects strong investor confidence, with minor pullbacks being bought up quickly.
Stock price forecast:
In the short term, the stock may consolidate between 27.60 and 35.00 before attempting a breakoutBreakout patterns occur when a stock price moves beyond a defined level of support or resistance with increased volume, signaling the potential start of a new trend. A breakout ind…. A move above 35.00 could signal continuation toward 40.00 or higher. In the medium to long term, as long as the stock holds above the 50-day moving averageThe concept of moving averages dates back to the early 20th century. While it is challenging to attribute the invention of moving averages to a single individual, W. P. Hamilton, a…, the uptrend remains intact. A break below 27.60 could indicate a deeper pullback toward 25.00.
Trading plans:
Swing tradingSwing trading is a popular trading strategy aimed at capturing short- to medium-term gains by taking advantage of price swings in financial markets. Unlike day trading, which invol… plan: Look for entries near the 50-day moving averageThe concept of moving averages dates back to the early 20th century. While it is challenging to attribute the invention of moving averages to a single individual, W. P. Hamilton, a… (27.60) with a stop loss below 26.00. Target a move toward 35.00, with a potential extension to 40.00 if momentumMomentum in stock trading refers to the rate of acceleration of a stock’s price or trading volume. It indicates the strength of a trend and measures how quickly prices are rising o… continues.
Long-term trading plan: Maintain a position as long as the price remains above the 200-day moving averageThe concept of moving averages dates back to the early 20th century. While it is challenging to attribute the invention of moving averages to a single individual, W. P. Hamilton, a… (12.65) and the broader uptrend remains intact. Accumulate on pullbacks toward 25.00-27.60. Potential long-term target could be 50.00+ if the stock continues its strong growth trajectory.
Past performance is not an indication of future results. This article should not be considered as investment advice. Always conduct your own research and consider consulting with a financial advisor before making any investment decisions. 🧡
Rocket Lab’s latest stock surge reflects growing investor confidence in its execution of high-profile satellite deployments and its strategic initiatives aimed at long-term growth. With expanding revenue, a growing backlog, and ambitious plans for its Neutron rocket, the company is well-positioned to capitalize on increasing demand for commercial satellite launches and national security applications. As the space industry continues to evolve, Rocket Lab remains a key company for investors to follow, with the potential to become a leading force in the next generation of space exploration and commercialization.
Lance Jepsen is the senior personal finance writer for Guerilla Stock Trading who has spent more than 25 years covering the stock market and economics. In addition, Lance has worked as a private stock analyst for a number of high worth individuals.
Do you have a news tip for GuerillaStockTrading? Please email us at [email protected]
🗨️ JOIN OUR COMMUNITY OF STOCK TRADERS AND INVESTORS ON SOCIAL MEDIA
💥 GET OUR LATEST CONTENT IN YOUR RSS FEED READER
We are entirely supported by readers like you. Thank you.🧡
At GuerillaStockTrading, we maintain full transparency and impartiality; we never blog about stocks or crypto in which we hold a personal position unless explicitly stated in the article. Additionally, we do not accept paid promotions presented as content. All information shared is for informational purposes only and should not be construed as financial, investment, tax, or legal advice, nor as a recommendation to buy any security or financial asset. The content is general in nature and does not account for individual circumstances. It may not be suitable for your particular situation. Before making financial decisions, you are encouraged to seek guidance from your own financial or investment advisor.
Trading and Investment Ideas:
Source link