Intel’s Stock Surges on Strong Chip Performance and Market Optimism

Intel’s stock experienced a significant surge today, driven by a series of positive developments that have reignited investor enthusiasm. The company’s latest processor advancements, leadership shifts, and ongoing improvements in its data center and AI strategy have contributed to the stock’s impressive gains. As Intel strives to reclaim its competitive edge in the semiconductor market, investors are closely monitoring its progress, particularly in high-performance computing and AI-driven applications.
Strong Performance of Intel’s Latest Chip
A key catalystIn stock trading, a catalyst refers to an event, news, or announcement that causes a significant and often rapid price movement in a stock or the broader market. Catalysts can be p… behind Intel’s stock rally is the performance of its newly released Core Ultra 9 275HX processor. Recent benchmark results indicate that the chip outperforms AMD’s Ryzen 9 7945HX3D by 7% in PassMark’s CPU Mark test and surpasses Intel’s previous-generation i9-14900HX by an impressive 34%. These results underscore Intel’s ability to improve performance significantly and regain lost ground in the high-performance processor market.
For investors, this development signals meaningful progress in addressing competition from AMD, which has been gaining market share in recent years due to its efficient and powerful processors. A return to dominance in this sector could strengthen Intel’s revenue stream and reinforce its market position, making the company a more attractive long-term investment. The semiconductor industry is highly competitive, and sustained innovation is critical for maintaining leadership. Intel’s latest chip success suggests it is moving in the right direction, fueling today’s bullish sentiment around the stock.
Market Reaction and Stock Performance
Intel’s stock opened at $19.87 and reached a high of $21.61, reflecting a strong rally of over 10% in intraday trading. This level of movementThe Movement altcoin is a pioneering cryptocurrency designed to facilitate and promote social and environmental initiatives through blockchain technology. Unlike traditional crypto… is significant for a company of Intel’s size and indicates renewed investor confidence in its ability to execute its turnaround strategy.
Over the past few years, Intel has faced pressure from competitors such as AMD and NVIDIA, particularly in AI and data center markets. However, the strong response to its latest processors suggests that it is capable of delivering products that compete effectively in high-performance computing. A resurgence in stock price following positive product performance demonstrates how closely Intel’s valuation is tied to its ability to execute its technological roadmap. Investors are watching to see if this momentumMomentum in stock trading refers to the rate of acceleration of a stock’s price or trading volume. It indicates the strength of a trend and measures how quickly prices are rising o… can be sustained as Intel continues to roll out new products and refine its AI and data center strategy.
AI and Data Center Strategy: Leadership Changes and Future Prospects
Beyond product performance, recent leadership changes within Intel’s AI and data center division are drawing attention from investors. The departure of Justin Hotard, who served as the company’s AI and data center chief, to become the CEO of Nokia marks a transition period for Intel. While leadership turnover can sometimes raise concerns, this change may also provide an opportunity for fresh leadership to reshape Intel’s AI and data center strategy.
AI and data center markets are critical growth drivers for semiconductor companies, and Intel has faced stiff competition from NVIDIA and AMD in these areas. However, with AI adoption accelerating globally, Intel has the potential to carve out a stronger position if it successfully innovates and enhances its product offerings. Investors are closely watching how the company navigates these changes and whether it can improve its competitiveness in AI workloads, cloud computing, and enterprise data center solutions.
Meanwhile, the reception of Intel’s Core Ultra 200 series has been overwhelmingly positive. The Core 285H model, in particular, has been described as “the most powerful mainstream laptop processor” Intel has ever produced. Such strong endorsements suggest that Intel is making meaningful strides in the laptop processor market, which remains a significant revenue driver for the company.
Intel Trading Plan
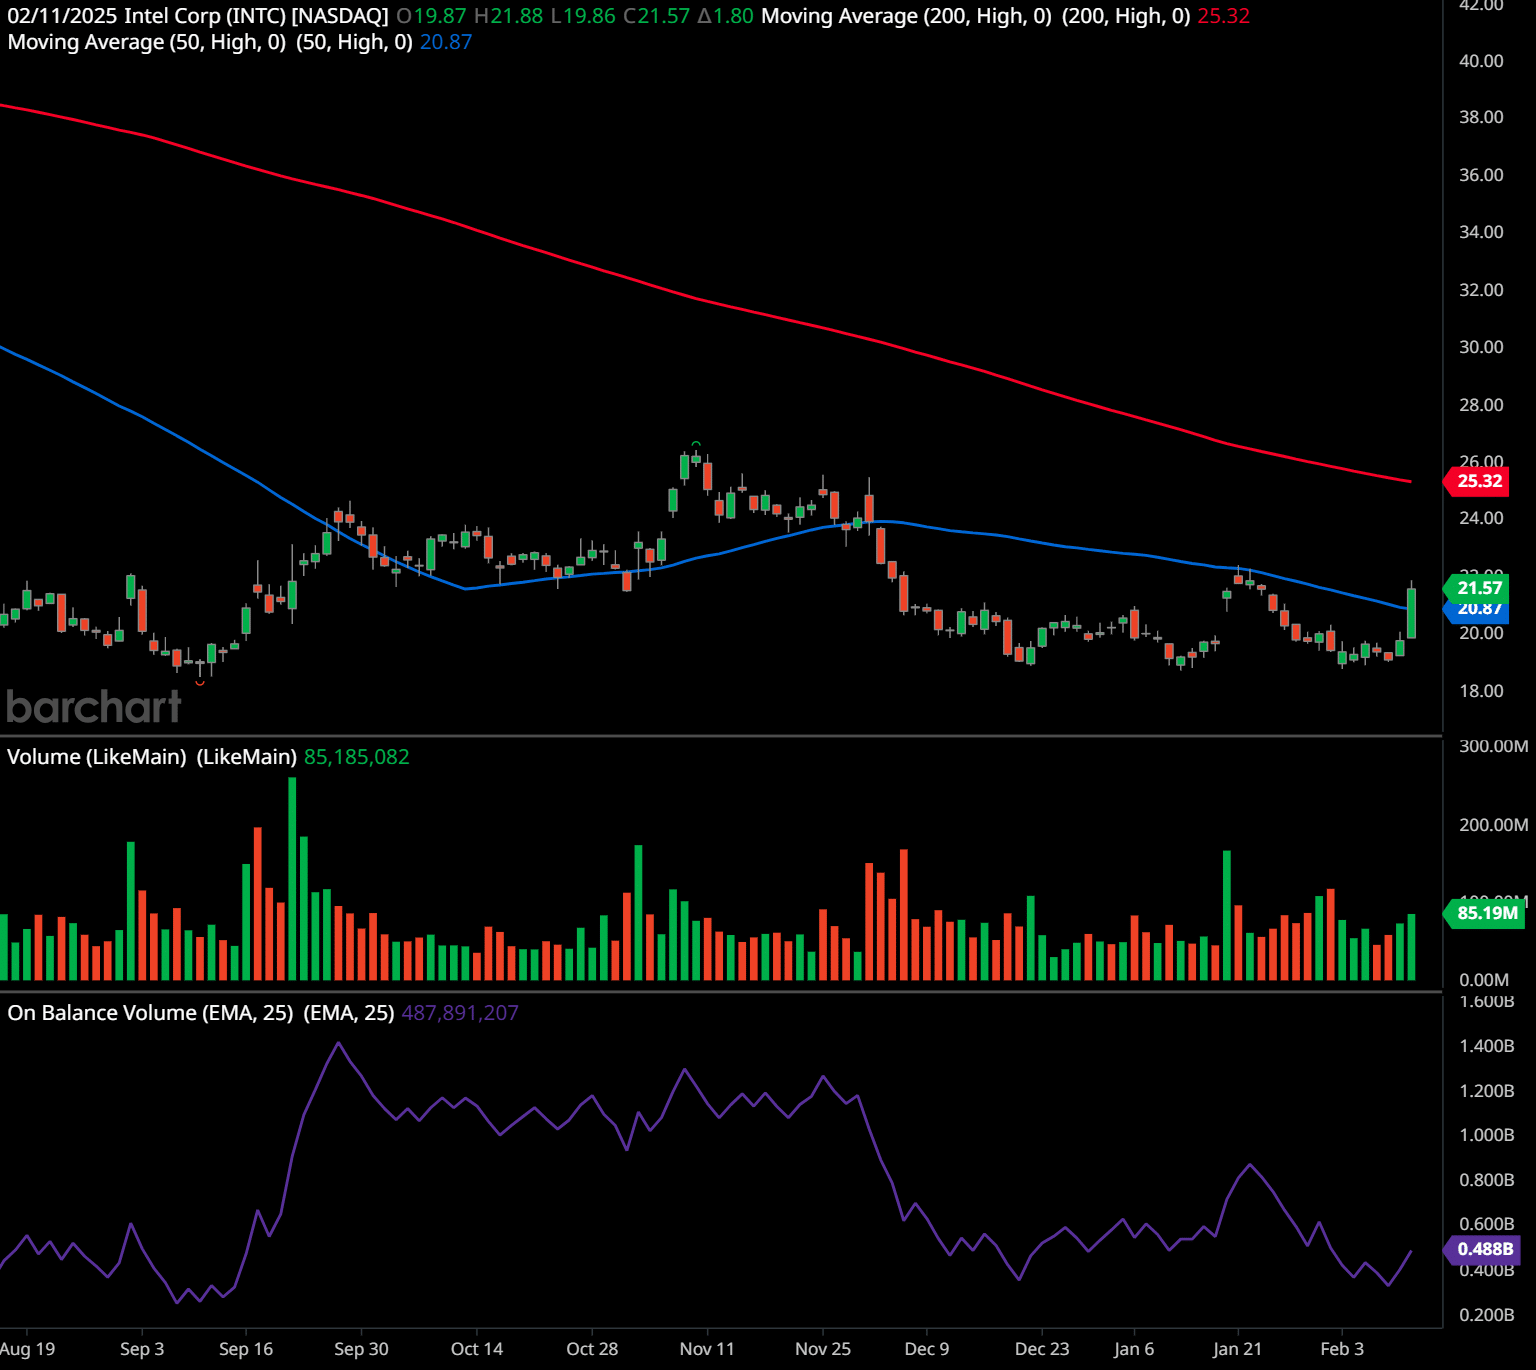
This chart shows Intel Corp (INTC) on the daily timeframe with a recent price movementThe Movement altcoin is a pioneering cryptocurrency designed to facilitate and promote social and environmental initiatives through blockchain technology. Unlike traditional crypto… of 21.57, up 1.80 points. The chart includes the 50-day moving averageThe concept of moving averages dates back to the early 20th century. While it is challenging to attribute the invention of moving averages to a single individual, W. P. Hamilton, a… (blue) at 20.87 and the 200-day moving averageThe concept of moving averages dates back to the early 20th century. While it is challenging to attribute the invention of moving averages to a single individual, W. P. Hamilton, a… (red) at 25.32. Volume is significantly higher than previous sessions at 85.19 million shares, indicating strong buying interest. The On-Balance VolumeThe On Balance Volume indicator (OBV) is a technical analysis tool used to measure the flow of money into and out of a security over a specified period of time. It is a cumulative … (OBVThe On Balance Volume indicator (OBV) is a technical analysis tool used to measure the flow of money into and out of a security over a specified period of time. It is a cumulative …) is at 487.89 million, suggesting some accumulation after a prior decline.
Support and Resistance Levels
- Support: The stock has bounced off a recent low near $19.00, which serves as a key support level. Below this, the next major support is around $17.50, where the price previously consolidated.
- Resistance: Immediate resistance is around $22.50-$23.00, a previous area where the stock struggled to break higher. A more significant resistance level is the 200-day moving averageThe concept of moving averages dates back to the early 20th century. While it is challenging to attribute the invention of moving averages to a single individual, W. P. Hamilton, a… at $25.32, which aligns with a psychological round number resistance.
Trend and Future Outlook
The stock has been in a downtrend since peaking around $37-$38 months ago. Recently, it attempted a base formation around $19 before bouncing higher. The current price action suggests a potential reversal attempt, as seen in today’s strong green candlestickCandlestick chart patterns are visual representations of price movements in financial markets, typically stocks, commodities, or currencies, during a specific time period. Each “ca… and increased volume. However, the 200-day moving averageThe concept of moving averages dates back to the early 20th century. While it is challenging to attribute the invention of moving averages to a single individual, W. P. Hamilton, a… still acts as a major resistance, and the stock remains below it, which means the longer-term trend is still bearish until proven otherwise.
Chart Patterns and Psychology
- Potential Double BottomThe double bottom chart pattern is a reversal pattern that indicates the exhaustion of a downward trend and the potential for an upward trend. Formation: If the stock can hold above $19 and break above $22.50 with volume, it would confirm a double bottomThe double bottom chart pattern is a reversal pattern that indicates the exhaustion of a downward trend and the potential for an upward trend. pattern, signaling a trend reversal.
- BreakoutBreakout patterns occur when a stock price moves beyond a defined level of support or resistance with increased volume, signaling the potential start of a new trend. A breakout ind… Attempt: Today’s strong bullish candle suggests renewed buyer interest, likely fueled by short-covering and fresh buying. The volume increase is significant, indicating strong participation.
- Moving AveragesThe concept of moving averages dates back to the early 20th century. While it is challenging to attribute the invention of moving averages to a single individual, W. P. Hamilton, a… Insight: The 50-day MA at $20.87 is slightly below the price, meaning short-term momentumMomentum in stock trading refers to the rate of acceleration of a stock’s price or trading volume. It indicates the strength of a trend and measures how quickly prices are rising o… is shifting bullish, but the 200-day MA at $25.32 is still a major hurdle. Traders often wait for a break above the 200-day MA before confirming a long-term trend reversal.
Stock Price Forecast
- Bullish Case: If the stock sustains above $21 and pushes past $22.50 with volume, it could target the $25-$26 zone, where the 200-day MA resides. Breaking above $26 could confirm a medium-term trend shift toward $28-$30.
- Bearish Case: If the stock fails to hold above $21, it could retest $19, and a breakdown below this level may lead to further downside toward $17.50-$16.00.
Trading Plans
Swing TradingSwing trading is a popular trading strategy aimed at capturing short- to medium-term gains by taking advantage of price swings in financial markets. Unlike day trading, which invol… Plan:
- Entry: Buy if price breaks above $22.50 with high volume.
- Stop-Loss: Place a stop below $20.50 to protect against downside riskIn stock and crypto trading, risk refers to the possibility of losing some or all of the capital invested in a trade. It represents the uncertainty about the future performance of ….
- Target: Take profits near $25-$26 (200-day MA) and reevaluate.
Long-Term Trading Plan:
- Entry: Accumulate in the $19-$21 range if the price holds above recent lows.
- Stop-Loss: Below $17.50 to avoid deeper drawdowns.
- Target: Hold for a potential recovery to $30+ if Intel’s fundamentals improve over time.
The stock is showing early signs of a reversal but has not confirmed a trend change yet. Volume is encouraging, but resistance at $22.50 and the 200-day MA must be broken to shift the trend fully bullish. Until then, cautious optimism is warranted.
Past performance is not an indication of future results. This article should not be considered investment advice. Always conduct your own research and consider consulting with a financial advisor before making any investment decisions. 🧡
Intel’s stock surge today reflects investor optimism surrounding its latest technological advancements and strategic shifts. The strong benchmark performance of the Core Ultra 9 275HX indicates that Intel is regaining competitiveness in high-performance computing. At the same time, leadership changes in its AI and data center division present both challenges and opportunities. With the Core Ultra 200 series receiving positive reviews, Intel appears to be on a stronger footing than in recent years.
For investors, Intel remains an important company to follow due to its role in the broader semiconductor industry, which is vital to computing, AI, and data infrastructure. While challenges remain, today’s developments highlight Intel’s ongoing efforts to strengthen its market position. If the company can sustain this momentumMomentum in stock trading refers to the rate of acceleration of a stock’s price or trading volume. It indicates the strength of a trend and measures how quickly prices are rising o… and continue delivering innovative products, it could present a compelling investment opportunity for those looking to capitalize on the semiconductor sector’s long-term growth potential.
Lance Jepsen is the senior personal finance writer for Guerilla Stock Trading who has spent more than 25 years covering the stock market and economics. In addition, Lance has worked as a private stock analyst for a number of high worth individuals.
Do you have a news tip for GuerillaStockTrading? Please email us at [email protected]
🗨️ JOIN OUR COMMUNITY OF STOCK TRADERS AND INVESTORS ON SOCIAL MEDIA
💥 GET OUR LATEST CONTENT IN YOUR RSS FEED READER
We are entirely supported by readers like you. Thank you.🧡
At GuerillaStockTrading, we maintain full transparency and impartiality; we never blog about stocks or crypto in which we hold a personal position unless explicitly stated in the article. Additionally, we do not accept paid promotions presented as content. All information shared is for informational purposes only and should not be construed as financial, investment, tax, or legal advice, nor as a recommendation to buy any security or financial asset. The content is general in nature and does not account for individual circumstances. It may not be suitable for your particular situation. Before making financial decisions, you are encouraged to seek guidance from your own financial or investment advisor.
Trading and Investment Ideas:
Source link