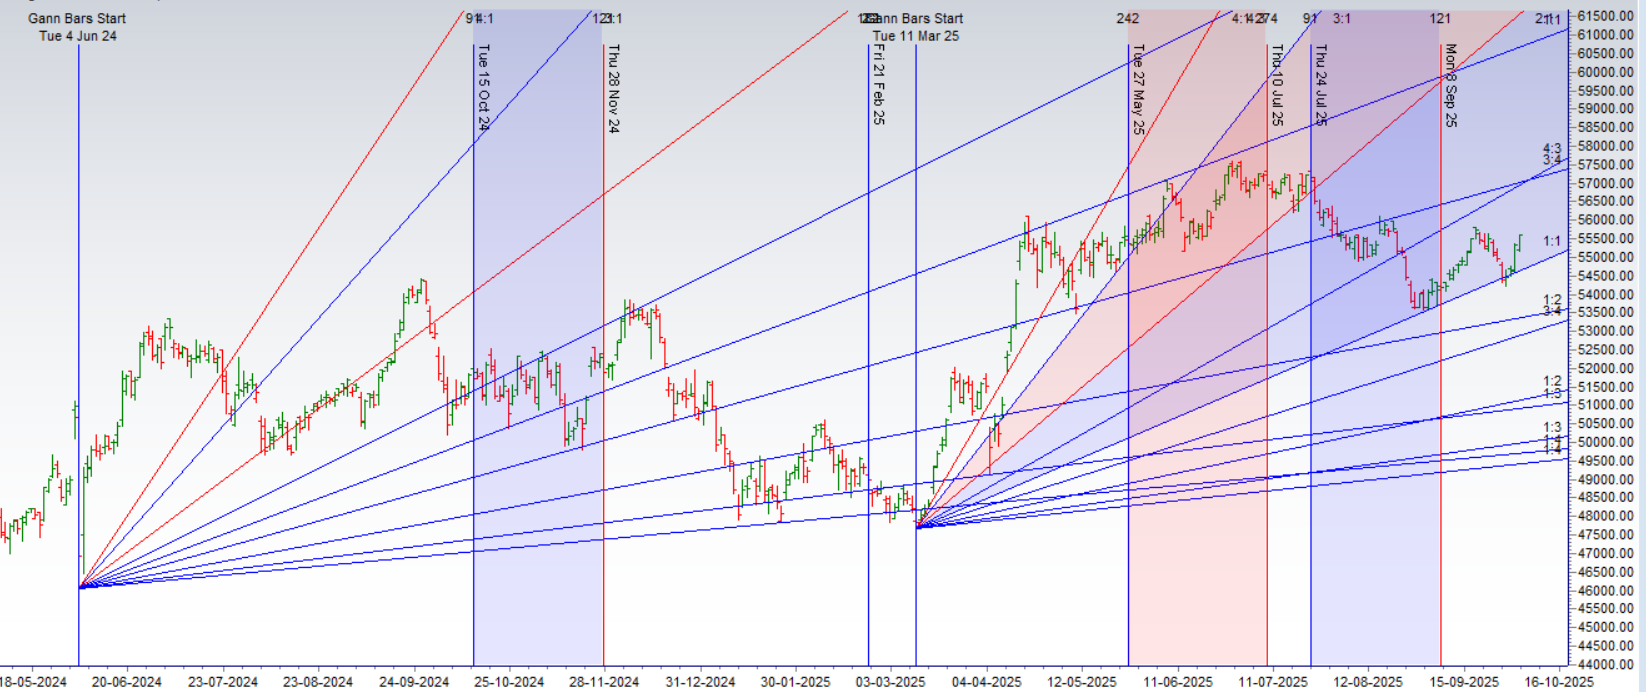
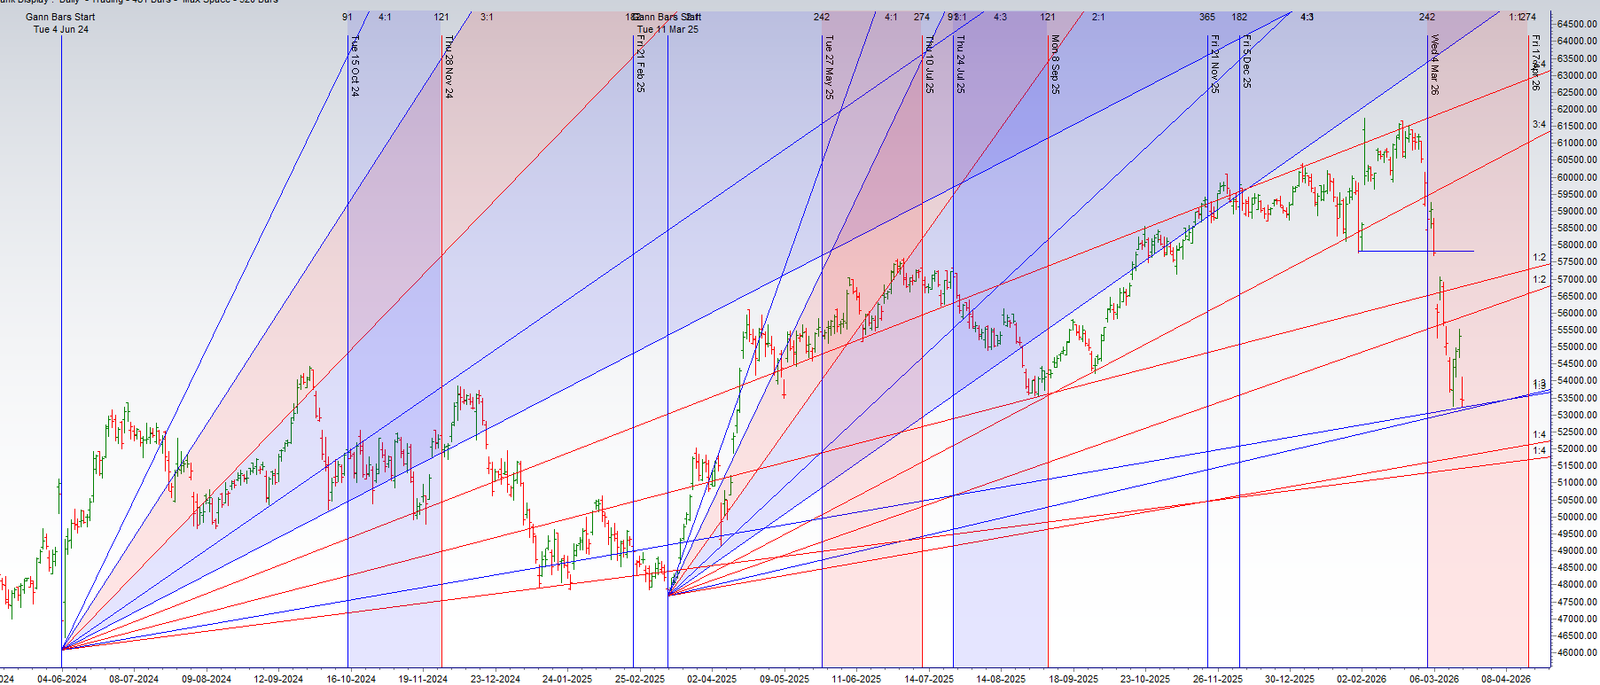
A Historic Reversal Setup: A “Perfect” Gann Bottom Forms as a Trio of Bullish Cycles Converges – Bramesh’s Technical Analysis
A Battle of Conviction: FIIs Aggressively Buy into a Market Meltdown
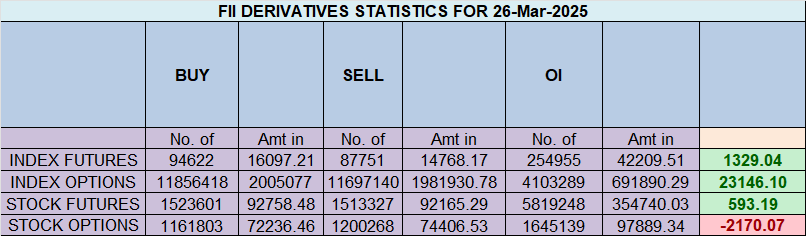
On March 19, 2026, the Bank Nifty market became a historic battlefield. The price action was a picture of utter capitulation, with the index closing down by a catastrophic 1,812 points within a violently volatile 1,007-point range (implying a massive gap down). Logically, one would expect the institutional data to show a multi-thousand-crore FII shorting campaign.
Instead, the data revealed a profound and stunning paradox: Foreign Institutional Investors (FIIs) were aggressive net buyers, accumulating 2,278 contracts against the tide of panic. This was confirmed by the day’s most critical and revealing signal: a solid increase in net Open Interest (OI) of 1,760 contracts.
This is not the data of a simple capitulation. This is the definitive signature of a full-scale war being waged at the market’s lows.
Decoding the Data: The Panic Sellers vs. The Conviction Buyers
This is the story of two powerful, opposing forces colliding with maximum force.
-
The Panic-Sellers (The Rest of the Market): The 1,812-point decline was driven by a wave of indiscriminate, panic-driven selling. This was a classic liquidation cascade, likely fueled by margin calls and the capitulation of long-time bulls. Critically, as shown by the rising OI, a huge number of new, aggressive short-sellers also entered the fray, chasing the panic downwards and adding fuel to the fire. They saw a breakdown and attacked it with force.
-
The FIIs (The Conviction Buyers): The FIIs did not participate in this panic. They did the exact opposite. They looked at the 1,812-point plunge and saw not a reason to sell, but a historic buying opportunity. By aggressively buying over 2,200 contracts, they were not just tentatively “bottom-fishing.” They were actively absorbing the panic selling with immense size and conviction. This is the classic footprint of “smart money” stepping in to draw a “line in the sand,” believing that the sell-off is emotional, overdone, and represents deep value.
-
The Rising OI (The Proof of War): The fact that Open Interest rose is the irrefutable proof that this was a two-sided battle, not a one-sided surrender. The massive new short positions created by the panic-sellers were met and absorbed by the massive new long positions created by the FIIs. The market is not hollow; it is now packed with new, high-conviction positions on opposite sides of a historic battle line.
Key Implications for the Market
-
A Major Bottoming Process has Begun: The FIIs’ action of absorbing a market crash with new long positions is one of the most powerful signals that a major market bottom is being forged.
-
A Volatility Explosion is Imminent: A battle this fierce does not resolve quietly. The market is a coiled spring at its absolute maximum tension. The next move, in either direction, is poised to be extremely powerful and violent.
-
The Day’s Low is Now the Most Important Level on the Chart: The price level where the FIIs drew their “line in the sand” has now become a fortress of institutional support. Their capital is now committed to defending this zone.
-
The Two Scenarios are Clear:
-
IF the day’s low holds, it confirms the FIIs’ bet was correct. This is poised to trap the massive number of new shorts and ignite a ferocious relief rally or “short squeeze.”
-
IF the day’s low breaks, it means the FIIs’ massive buying effort has failed, a catastrophic signal that could lead to an even more severe market collapse.
-
Conclusion
Disregard the price action in isolation. The dominant story is the historic battle between panic-sellers and institutional conviction buyers, confirmed by the massive surge in Open Interest. A major bottoming attempt has been made. The market is now at a point of maximum tension. The next directional move that resolves this conflict is poised to be exceptionally powerful. The war has begun, and its outcome will be decided by the market’s ability to hold the lows of this session.
Bank Nifty Dec Futures Open Interest Volume stood at 19.9 lakh, with liquidation of 1.38 Lakh contracts. Additionally, the Increase in Cost of Carry implies that there was a closeuer of SHORT positions.
Bank Nifty Advance Decline Ratio at 00:14 and Bank Nifty Rollover Cost is @61486 closed below it.
The Bank Nifty options market is radiating signals of intense bearish pressure and a market firmly in the grip of sellers. A profoundly negative Put-Call Ratio (PCR) of just 0.79 indicates a market overwhelmed by aggressive call writers. This reflects a high degree of confidence among sellers that any recovery attempt will be met with a formidable wall of supply, severely capping the market’s upside potential.
The market has been driven down so aggressively that it is now trading far below what was likely its initial structural range. The distant Max Pain at 56,000 now represents a former battleground, a sign of how far and fast the market has fallen, leaving a trail of worthless call options in its wake. The spot price at 53,451 is in a state of extreme technical weakness.
The options chain has forged a clear and daunting battlefield for the bulls:
-
Resistance: A massive “Great Wall of Calls” is located at the 53,500 strike, which acts as the immediate and most formidable ceiling. This is the primary line of defense for the bears.
-
Support: On the downside, a huge support floor and the ultimate line of defense for the bulls has been built by put writers at the 53,000 strike. The next major support below this is at 52,500.
In conclusion, the Bank Nifty is in a powerful bear grip, dominated by negative sentiment and overwhelming overhead supply. The path of least resistance is firmly to the downside. The market is trapped in a well-defined range between the massive support at 53,000 and the immense resistance at 53,500. A major catalyst will be required to break this deadlock.
Bank Nifty Spot – Intraday Technical Setup
Market Observation: The index is currently trading within a defined range. Traders should watch the following pivot zones for potential directional moves:
-
Strength (Upside): If the index sustains above 53610 , it indicates bullish momentum. The immediate resistance levels to watch are 53729 53864 54000.
-
Weakness (Downside): Selling pressure is likely to intensify if the index breaks below 53400 . In this scenario, the next support zones are 53300 53166 53000.
Wishing you good health and trading success as always.As always, prioritize your health and trade with caution.
As always, it’s essential to closely monitor market movements and make informed decisions based on a well-thought-out trading plan and risk management strategy. Market conditions can change rapidly, and it’s crucial to be adaptable and cautious in your approach.
► Join Youtube channel : Click here
► Check out Gann Course Details: W.D. Gann Trading Strategies
► Check out Financial Astrology Course Details: Trading Using Financial Astrology
► Check out Gann Astro Indicators Details: Gann Astro Indicators