
From Hundreds to Just 20? AST SpaceMobile’s Profitability Shortcut Shocks the Market!

AST SpaceMobile (NASDAQ:ASTS) experienced a significant surge in its stock price, climbing 8.84% to reach $30.05. The rally can be attributed to several strategic developments, increased institutional interest, and growing optimism about the company’s future in space-based cellular broadband.
One of the most critical drivers of this upward momentumMomentum in stock trading refers to the rate of acceleration of a stock’s price or trading volume. It indicates the strength of a trend and measures how quickly prices are rising o… is AST SpaceMobile’s recent announcement regarding its satellite fleet optimization. Initially, the company projected that it would require a substantial number of satellites to achieve profitability. However, AST SpaceMobile has revised its strategy and now asserts that it can reach break-even cash flowThe cash flow statement provides a detailed overview of the cash inflows and outflows of a company over a specified period of time. It includes cash received from operations, inves… with just 20 satellites. Furthermore, the company believes it will be in a dominant competitive position with 40 to 50 satellites. This shift in strategy indicates a more cost-effective approach that could accelerate profitability, a factor that is likely boosting investor confidence. Reducing capital expenditureIn the realm of corporate finance, Capital Expenditure (CapEx) play a crucial role in shaping the future trajectory of a company. From acquiring new assets to upgrading existing in… while maintaining strong revenue potential is a compelling reason for investors to keep a close watch on the company.
Additionally, bullish analyst coverage has played a key role in the stock’s latest surge. Cantor Fitzgerald recently initiated coverage on AST SpaceMobile with an “Overweight” rating and set a price target of $30.00. This endorsement from a respected financial institution is influencing market sentiment, as investors often take cues from such firms when evaluating growth stocks. The company’s strong backing from analysts suggests confidence in its long-term viability and reinforces the perception that AST SpaceMobile is well-positioned in the rapidly evolving space-based communications sector.
Beyond strategic and financial factors, AST SpaceMobile has also been increasing its brand visibility. A notable effort in this regard was the company’s advertisement during the Super Bowl on February 9th. This high-profile marketing move significantly expanded public awareness of the company’s mission and capabilities, likely attracting both retail and institutional investors. Super Bowl advertisements are among the most watched commercials in the world, and this level of exposure can be instrumental in enhancing investor enthusiasm and attracting new capital to the stock.
The broader market sentiment around AST SpaceMobile has also turned increasingly positive. The stock currently holds an average rating of “Buy,” with a consensus price target of $40.04. Institutional investors, including hedge funds, have recently adjusted their positions in the company, reflecting sustained interest from professional money managers. The presence of institutional investors is often seen as a sign of stability, as these entities conduct thorough due diligence before investing.
ASTS Trading Plan
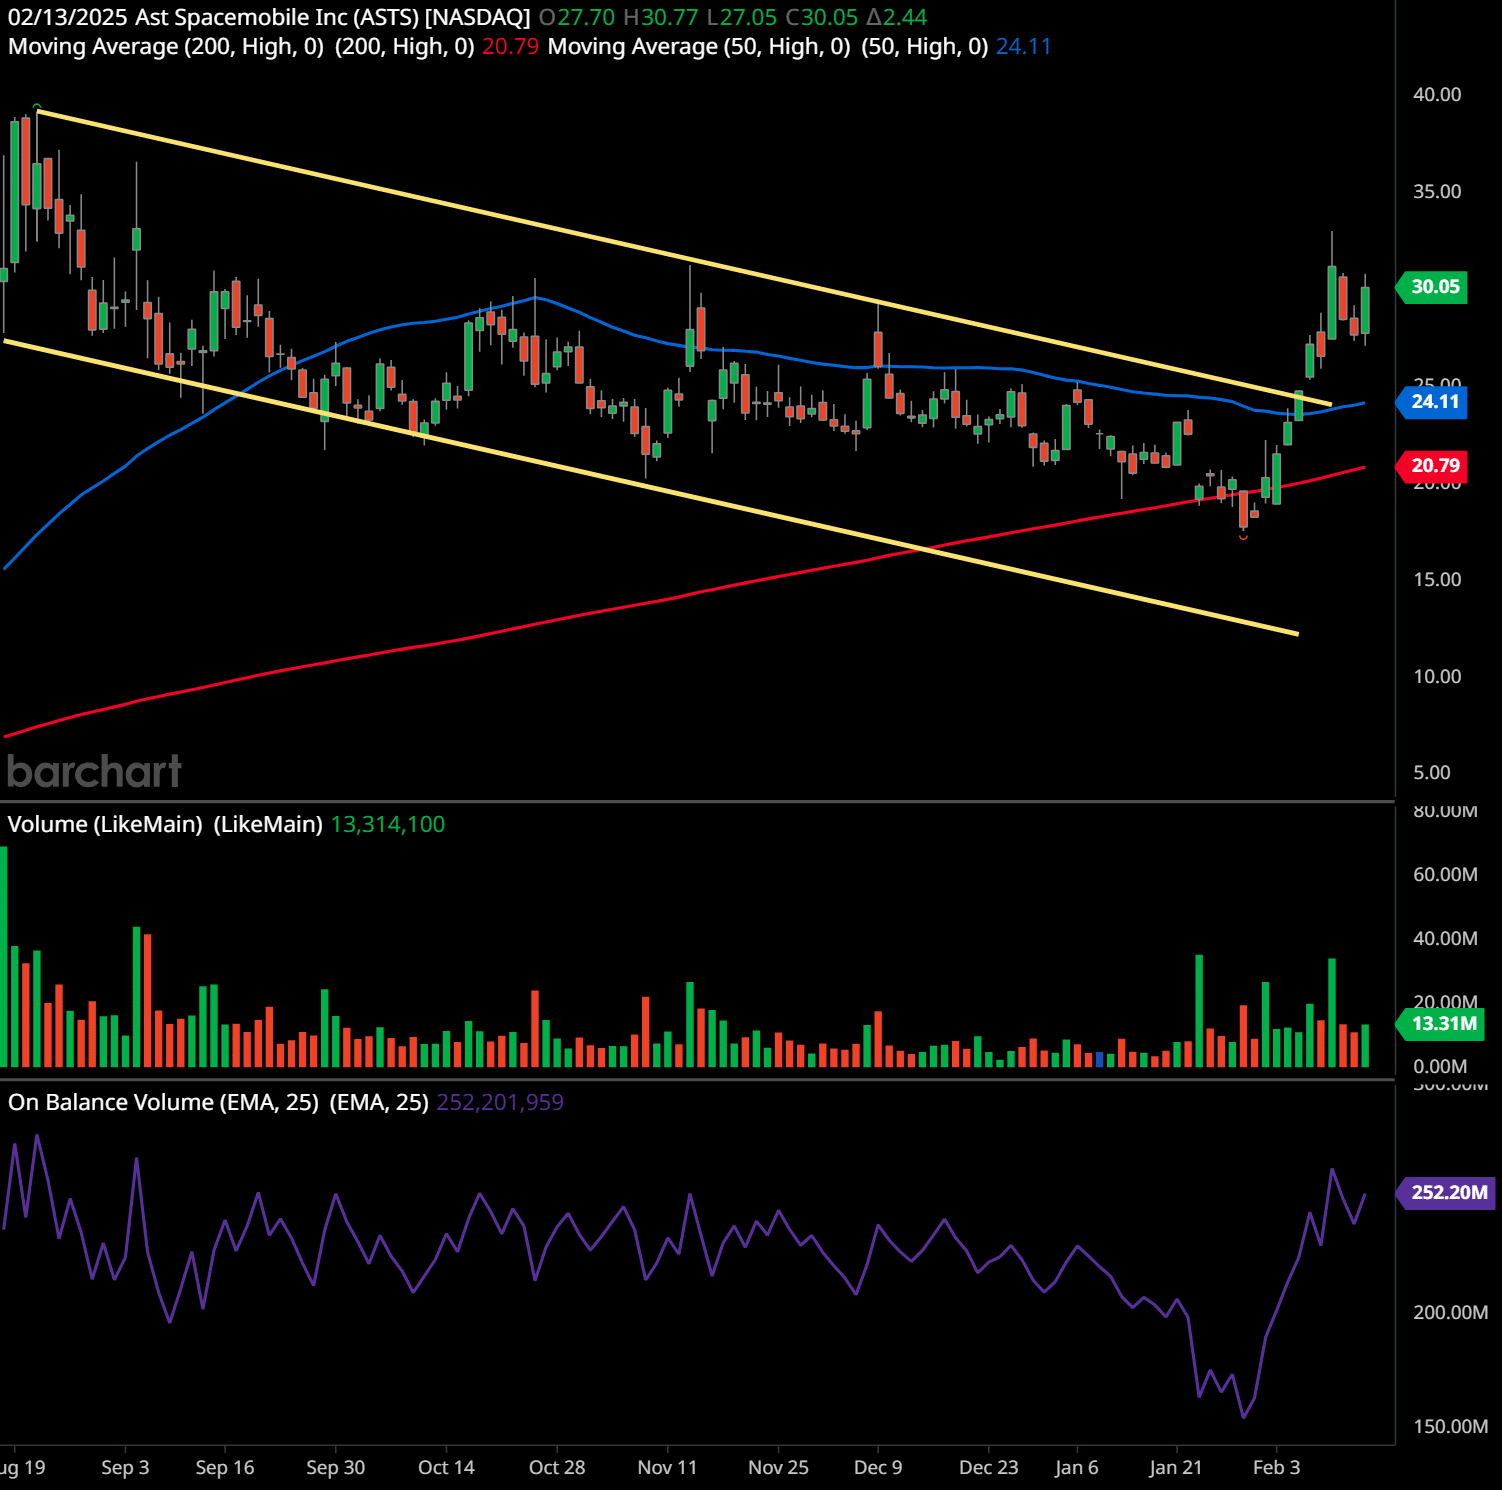
This is a daily chart of AST SpaceMobile Inc. (ASTS) with notable technical indicators, volume data, and price movements that provide insights into potential future trends. Below is a comprehensive technical analysis.
Support and Resistance Levels
- Support: Around $20.79 (200-day moving averageThe concept of moving averages dates back to the early 20th century. While it is challenging to attribute the invention of moving averages to a single individual, W. P. Hamilton, a…), with additional support in the $24.00 range (50-day moving averageThe concept of moving averages dates back to the early 20th century. While it is challenging to attribute the invention of moving averages to a single individual, W. P. Hamilton, a…). The $15-$17 zone also acted as a long-term support during the downtrend.
- Resistance: The $30.00-$35.00 range appears to be a key resistance level. A previous rejection occurred around this level, making it a critical price point to watch.
Chart Patterns and Psychology
The chart shows a falling wedgeThe wedge chart pattern is a technical analysis tool used by traders to identify potential buying or selling opportunities. It consists of three converging trend lines, which meet … breakoutBreakout patterns occur when a stock price moves beyond a defined level of support or resistance with increased volume, signaling the potential start of a new trend. A breakout ind…, which is typically a bullish reversal pattern. The falling wedgeThe wedge chart pattern is a technical analysis tool used by traders to identify potential buying or selling opportunities. It consists of three converging trend lines, which meet … is characterized by downward-sloping trendlines converging, leading to an eventual breakoutBreakout patterns occur when a stock price moves beyond a defined level of support or resistance with increased volume, signaling the potential start of a new trend. A breakout ind… to the upside. This breakoutBreakout patterns occur when a stock price moves beyond a defined level of support or resistance with increased volume, signaling the potential start of a new trend. A breakout ind… is confirmed with strong bullish volume, signaling a shift in momentumMomentum in stock trading refers to the rate of acceleration of a stock’s price or trading volume. It indicates the strength of a trend and measures how quickly prices are rising o….
The psychology behind this pattern suggests that during the wedgeThe wedge chart pattern is a technical analysis tool used by traders to identify potential buying or selling opportunities. It consists of three converging trend lines, which meet … formation, selling pressure was gradually weakening while buyers started accumulating shares at lower levels. Once price broke above the upper trendline of the wedgeThe wedge chart pattern is a technical analysis tool used by traders to identify potential buying or selling opportunities. It consists of three converging trend lines, which meet …, traders rushed to enter long positions, triggering a price rally.
Trend Analysis
- The stock has broken out of a long-term downtrend channelUptrend and downtrend channel patterns are technical analysis tools used to identify potential future price movements. They are formed by two parallel lines on a chart and can be u… marked by the yellow lines. This suggests a trend reversal.
- The 50-day moving averageThe concept of moving averages dates back to the early 20th century. While it is challenging to attribute the invention of moving averages to a single individual, W. P. Hamilton, a… (24.11) is now above the 200-day moving averageThe concept of moving averages dates back to the early 20th century. While it is challenging to attribute the invention of moving averages to a single individual, W. P. Hamilton, a… (20.79), signaling a potential bullish crossover. This suggests growing momentumMomentum in stock trading refers to the rate of acceleration of a stock’s price or trading volume. It indicates the strength of a trend and measures how quickly prices are rising o… in favor of buyers.
- The volume spike during the breakoutBreakout patterns occur when a stock price moves beyond a defined level of support or resistance with increased volume, signaling the potential start of a new trend. A breakout ind… indicates strong buying interest, which adds credibility to the trend reversal.
- On-Balance VolumeThe On Balance Volume indicator (OBV) is a technical analysis tool used to measure the flow of money into and out of a security over a specified period of time. It is a cumulative … (OBVThe On Balance Volume indicator (OBV) is a technical analysis tool used to measure the flow of money into and out of a security over a specified period of time. It is a cumulative …) has surged, showing that demand is increasing. This suggests that institutional investors or strong hands are accumulating shares.
Future Price Forecast
In the short term, the stock might experience some consolidation or a pullback toward the breakoutBreakout patterns occur when a stock price moves beyond a defined level of support or resistance with increased volume, signaling the potential start of a new trend. A breakout ind… level ($24-$26), as traders take profits. If it holds above the breakoutBreakout patterns occur when a stock price moves beyond a defined level of support or resistance with increased volume, signaling the potential start of a new trend. A breakout ind… zone, it could retest the $35 resistance level and potentially move toward $40+ in the medium term. However, failure to hold above $24 could lead to a retest of $20, which would be a bearish signal.
Trading Plans
Swing TradingSwing trading is a popular trading strategy aimed at capturing short- to medium-term gains by taking advantage of price swings in financial markets. Unlike day trading, which invol… Plan (Short-Term)
- Entry: Buy on a pullback to $25-$27
- Stop Loss: $23 (to limit downside riskIn stock and crypto trading, risk refers to the possibility of losing some or all of the capital invested in a trade. It represents the uncertainty about the future performance of …)
- Take Profit: $33-$35 (previous resistance level)
- Risk-Reward Ratio: ~1:3 (good riskIn stock and crypto trading, risk refers to the possibility of losing some or all of the capital invested in a trade. It represents the uncertainty about the future performance of … management)
Long-Term Trading Plan
- Entry: Accumulate gradually above the 200-day moving averageThe concept of moving averages dates back to the early 20th century. While it is challenging to attribute the invention of moving averages to a single individual, W. P. Hamilton, a… (~$21)
- Stop Loss: Below $18 (strong long-term support)
- Take Profit: $40-$50 range over the next 6-12 months
- CatalystsIn stock trading, a catalyst refers to an event, news, or announcement that causes a significant and often rapid price movement in a stock or the broader market. Catalysts can be p… to Watch: Company earnings, news catalystsIn stock trading, a catalyst refers to an event, news, or announcement that causes a significant and often rapid price movement in a stock or the broader market. Catalysts can be p…, macroeconomicAt its core, macroeconomics is the branch of economics that examines the behavior, performance, and structure of an economy as a whole. Unlike microeconomics, which focuses on indi… conditions
The stock has broken out of a long-term downtrend with strong volume, indicating a potential trend reversal. The technical indicators support a bullish bias, but price action around resistance levels ($30-$35) will determine the next move. A retest of support before another push higher is likely. Traders should monitor volume and price behavior carefully before making decisions.
Past performance is not an indication of future results. This article should not be considered as investment advice. Always conduct your own research and consider consulting with a financial advisor before making any investment decisions. 🧡
Looking ahead, investors appear optimistic about AST SpaceMobile’s long-term trajectory despite anticipated short-term losses. Cantor Fitzgerald has forecasted a loss per share of $1.10 for the company’s fiscal year 2025, but this is viewed as a necessary phase in the company’s growth strategy. Given its capital-intensive businessCapital-intensive industries are businesses that require significant upfront and ongoing investment in physical assets such as property, plant, and equipment (PPE) to produce goods… model, AST SpaceMobile’s ability to manage costs while expanding its capabilities will be crucial for its long-term financial success.
Strategic partnerships further bolster the company’s credibility. AST SpaceMobile has secured investments and collaborations with industry giants such as AT&T, Verizon, Google, and Vodafone. These partnerships not only provide financial backing but also validate the company’s technological advancements and market potential. Investors recognize that aligning with well-established telecommunications leaders strengthens AST SpaceMobile’s competitive edge and increases the likelihood of widespread adoption of its space-based cellular networkIn the context of cryptocurrency, a network refers to the interconnected system of computers, nodes, and software that work together to support and maintain the functioning of a sp….
For investors, AST SpaceMobile represents a high-risk, high-reward opportunity in the rapidly growing satellite communications sector. The company is striving to revolutionize global connectivity by bridging the gap between terrestrial and space-based networks, a market that has vast potential. As the telecommunications industry evolves, AST SpaceMobile’s ability to deploy its satellite networkIn the context of cryptocurrency, a network refers to the interconnected system of computers, nodes, and software that work together to support and maintain the functioning of a sp… efficiently and capitalize on its strategic partnerships will be closely watched. Given its recent stock performance, improving financial outlook, and increasing institutional interest, AST SpaceMobile remains an important stock for investors who are looking for exposure to the future of global connectivity.
Lance Jepsen is the senior personal finance writer for Guerilla Stock Trading who has spent more than 25 years covering the stock market and economics. In addition, Lance has worked as a private stock analyst for a number of high worth individuals.
Do you have a news tip for GuerillaStockTrading? Please email us at [email protected]
🗨️ JOIN OUR COMMUNITY OF STOCK TRADERS AND INVESTORS ON SOCIAL MEDIA
💥 GET OUR LATEST CONTENT IN YOUR RSS FEED READER
We are entirely supported by readers like you. Thank you.🧡
At GuerillaStockTrading, we maintain full transparency and impartiality; we never blog about stocks or crypto in which we hold a personal position unless explicitly stated in the article. Additionally, we do not accept paid promotions presented as content. All information shared is for informational purposes only and should not be construed as financial, investment, tax, or legal advice, nor as a recommendation to buy any security or financial asset. The content is general in nature and does not account for individual circumstances. It may not be suitable for your particular situation. Before making financial decisions, you are encouraged to seek guidance from your own financial or investment advisor.
Trading and Investment Ideas:
Source link