Bank Nifty at a Critical Turning Point as a Bullish Signal Meets a Volatile Cosmic Aspect – Bramesh’s Technical Analysis
A Classic Short Squeeze Unfolds: FIIs Join the Buying Frenzy as Market Hollows Out
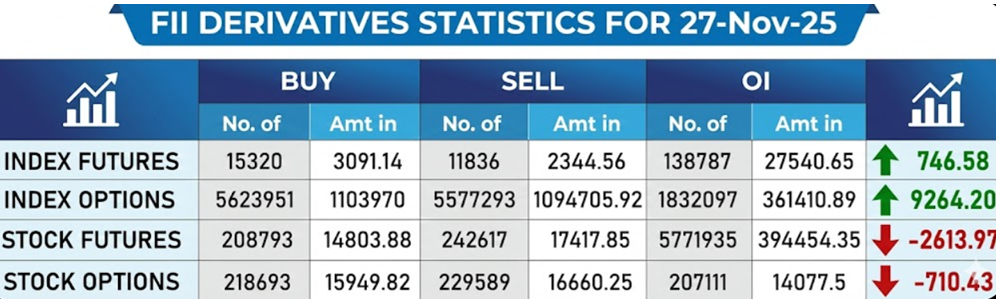
On March 17, 2026, the Bank Nifty delivered a powerful 437-point rally within a violently volatile 867-point range, giving the appearance of a massive bullish victory. The FII data, showing a net buy of 1,767 contracts, seemed to confirm this institutional support.
However, a look beneath the surface reveals a far more complex and cautionary tale. The day’s dominant and more truthful signal was the massive collapse in net Open Interest (OI), which plummeted by 837 contracts. This is not the signature of a healthy, new bull run. This is the unmistakable footprint of a violent, late-stage short squeeze built on a foundation of profound trend exhaustion.
Decoding the Data: The Anatomy of a Hollow Rally
The key to understanding this session is the profound paradox: a massive rally on shrinking market participation.
-
The Price Action Tells the Story of a Squeeze: An 867-point range is not consolidation; it is a battle. A 437-point positive close shows the bulls won that battle decisively. This type of high-velocity upward thrust is rarely driven by methodical new buyers; it is the hallmark of panicked, forced buying from trapped short-sellers who are desperate to close their losing positions at any price.
-
The Main Event: The Great Deleveraging: The massive drop in Open Interest is the definitive proof of the theme. For OI to fall by 837 contracts while FIIs were actively buying 1,767, it means that a colossal number of other participants—totaling 2,604 net contracts (1767 + 837)—closed their positions and fled the market. This exodus consists of two groups:
-
The FIIs: Joining the Squeeze, Not Leading a New Charge: In this context, the FIIs’ buying is not a signal of new, strategic, bullish conviction. They are simply one of the players participating in the squeeze. They could be covering their own old shorts or opportunistically adding longs to ride the powerful upward momentum created by the panic of others. Their buying is a symptom of the squeeze, not the cause of a new bull market.
Key Implications for the Market
-
A Textbook Short Squeeze: The rally is being fueled by the forced, panicked buying of trapped short-sellers, not by new, confident capital. This is an inherently unstable and finite source of buying pressure.
-
Profound Trend Exhaustion: The OI collapse is a loud signal that the market is “hollowing out.” Both sides of the previous trend are exiting, leaving a fragile and illiquid structure.
-
A Brittle and Extremely Vulnerable Market: A market that rallies on collapsing OI is exceptionally vulnerable to a sudden and violent reversal, often called a “rug pull.” Once the last short has covered, the buying pressure can evaporate in an instant.
-
The Risk has Inverted: The primary risk is no longer being short. The primary risk now is being long at the tail end of a deceptive, exhaustion-driven rally.
Bank Nifty Dec Futures Open Interest Volume stood at 22.1 lakh, with addition of 0.37 Lakh contracts. Additionally, the Increase in Cost of Carry implies that there was a closeuer of SHORT positions.
Bank Nifty Advance Decline Ratio at 12:02 and Bank Nifty Rollover Cost is @61486 closed below it.
The Bank Nifty options market is radiating signals of intense bearish pressure and a market firmly in the grip of sellers. A profoundly negative Put-Call Ratio (PCR) of just 0.78 indicates a market overwhelmed by aggressive call writers. This reflects a high degree of confidence among sellers that any recovery attempt will be met with a formidable wall of supply, severely capping the market’s upside potential.
The market has been driven down so aggressively that it is now trading far below what was likely its initial structural range. The distant Max Pain at 57,000 now represents a former battleground, a sign of how far and fast the market has fallen, leaving a trail of worthless call options in its wake. The spot price at 54,876 is in a state of extreme technical weakness.
The options chain has forged a clear and daunting battlefield for the bulls:
-
Resistance: A massive “Great Wall of Calls” is located at the 55,500 strike, which acts as the immediate and most formidable ceiling. This is the primary line of defense for the bears.
-
Support: On the downside, a huge support floor and the ultimate line of anof defense for the bulls has been built by put writers at the 54,500 strike, which holds the highest Put OI. This level is absolutely critical.
In conclusion, the Bank Nifty is in a powerful bear grip, dominated by negative sentiment and overwhelming overhead supply. The path of least resistance is firmly to the downside. The market is trapped in a well-defined range between the massive support at 54,500 and the immense resistance at 55,500. A major catalyst will be required to break this deadlock.
Bank Nifty Spot – Intraday Technical Setup
Market Observation: The index is currently trading within a defined range. Traders should watch the following pivot zones for potential directional moves:
-
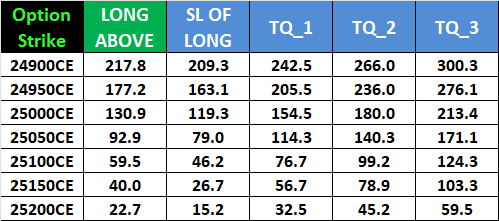
Strength (Upside): If the index sustains above 54900 , it indicates bullish momentum. The immediate resistance levels to watch are 55170 55555 55729.
-
Weakness (Downside): Selling pressure is likely to intensify if the index breaks below 54743 . In this scenario, the next support zones are 54555 54327 54108.
Wishing you good health and trading success as always.As always, prioritize your health and trade with caution.
As always, it’s essential to closely monitor market movements and make informed decisions based on a well-thought-out trading plan and risk management strategy. Market conditions can change rapidly, and it’s crucial to be adaptable and cautious in your approach.
► Join Youtube channel : Click here
► Check out Gann Course Details: W.D. Gann Trading Strategies
► Check out Financial Astrology Course Details: Trading Using Financial Astrology
► Check out Gann Astro Indicators Details: Gann Astro Indicators