Bank Nifty Bulls Unleashed: A Jupiter-Fueled Breakout Targets 57637 – Bramesh’s Technical Analysis
Bank Nifty at a Pivotal Crossroads: A Healthy Rotation or a Signal of Exhaustion?
The Bank Nifty’s internal data for March 10, 2026, presents a classic and high-stakes market paradox. On the surface, the continued buying by Foreign Institutional Investors (FIIs) seems to confirm the powerful, Jupiter-fueled breakout. However, this buying occurred amidst a massive collapse in net Open Interest (OI), creating two equally plausible and powerfully conflicting narratives for the market’s immediate future.
The ultimate direction of the market now hinges on which of these two interpretations is correct. This is no longer a simple trend-following environment; it is a moment of profound strategic transition.
Scenario A: The Bullish Case – A Healthy “Passing of the Baton”
This interpretation, driven by today’s monumental Jupiter Direct catalyst, views the current data as a sign of a strengthening, not weakening, trend.
-
The ‘Why’: The astrological reason for this view is that Jupiter’s direct motion unleashes a powerful and sustained wave of expansive energy into the financial sector.
-
The Mechanics: In this scenario, the clients are the early-stage profit-takers. Having successfully ridden the initial, powerful bounce from the lows, they are now selling their positions to lock in gains. The FIIs are the new, primary buyers, using the Jupiter Direct signal as their cue to begin building a major, strategic long position for the main leg of the bull run. They are willingly absorbing the client profit-taking.
-
The OI Decrease: The collapse in OI is not a sign of exhaustion, but of a healthy rotation and consolidation. It represents a “passing of the baton” from the early, weaker hands (clients) to the stronger, more convicted institutional hands (FIIs). This process strengthens the rally’s foundation.
Scenario B: The Bearish Case – The Exhaustion Signal
This is the more traditionally cautionary interpretation of the data.
-
The ‘Why’: The astrological reason is secondary to the technical data here. A rally on collapsing OI is a classic red flag for trend exhaustion.
-
The Mechanics: In this view, the rally is running on fumes. Both early bulls (clients) and the last of the bears are exiting the market en masse, leading to the OI collapse. The FIIs are simply the “last buyers at the party,” their buying providing the final bit of fuel before the engine stalls completely. The market is becoming “hollow” and extremely vulnerable to a sharp reversal or “rug pull” once the buying pressure from all sources evaporates.
The Decisive Arbiter: Price Action at Key Levels
With two such powerful and conflicting interpretations, the only true arbiter is price action. The market itself will prove which scenario is correct by its reaction to the key levels we have already defined.
-
IF the Bank Nifty decisively breaks above the first major resistance at the 57,663 – 57,696 zone, THEN it will provide powerful confirmation for the Bullish Rotation scenario. This would signal that the FIIs’ new buying is the dominant force and the rally is accelerating.
-
IF the market fails to break this resistance and instead breaks back below the foundational support at 56,637, THEN it will confirm the Exhaustion scenario. This would be a major bull trap and would signal that a significant correction is imminent.
Conclusion
The Bank Nifty is at a critical inflection point, with its internal data telling two very different stories. The powerful Jupiter Direct catalyst provides a strong tailwind for the bullish rotation thesis, but this must be confirmed by price action. The market’s reaction at the 57,663 resistance and the 56,637 support will be the final verdict. The next move is poised to be decisive and will validate which of these powerful underlying forces is truly in control.
Bank Nifty Dec Futures Open Interest Volume stood at 21.6 lakh, with liquidation of 1.4 Lakh contracts. Additionally, the Increase in Cost of Carry implies that there was a closeure of SHORT positions.
Bank Nifty Advance Decline Ratio at 14:00 and Bank Nifty Rollover Cost is @61486 closed below it.
The Bank Nifty options market is radiating signals of intense bearish pressure and a market firmly in the grip of sellers. A profoundly negative Put-Call Ratio (PCR) of just 0.80 indicates a market overwhelmed by aggressive call writers. This reflects a high degree of confidence among sellers that any recovery attempt will be met with a formidable wall of supply, severely capping the market’s upside potential.
The market has been driven down so aggressively that it is now trading significantly below what appears to be a key psychological level, signaling a structural breakdown. With the spot price at 56,950, bulls have lost control of critical zones. The distant Max Pain at 59,000 now represents a former battleground, a sign of how far and fast the market has fallen, with option writers now scrambling to adjust their positions to lower strikes.
The options chain has forged a clear and daunting battlefield for the bulls:
-
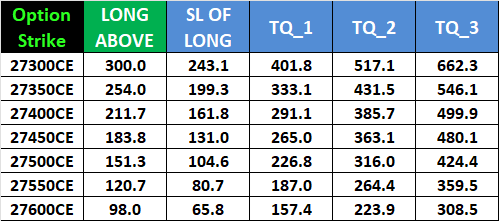
Resistance: A massive “Great Wall of Calls” is located at the 57,500 strike, which acts as the immediate and most formidable ceiling. This is the primary line of defense for the bears.
-
Support: On the downside, a huge support floor and the ultimate line of defense for the bulls has been built by put writers at the 56,500 strike. This level is absolutely critical.
In conclusion, the Bank Nifty is in a powerful bear grip, dominated by negative sentiment and overwhelming overhead supply. The path of least resistance is firmly to the downside. The market is trapped in a well-defined range between the massive support at 56,500 and the immense resistance at 57,500. A major catalyst will be required to break this deadlock.
Bank Nifty Spot – Intraday Technical Setup
Market Observation: The index is currently trading within a defined range. Traders should watch the following pivot zones for potential directional moves:
-
Strength (Upside): If the index sustains above 57000, it indicates bullish momentum. The immediate resistance levels to watch are 57225 57251 57555.
-
Weakness (Downside): Selling pressure is likely to intensify if the index breaks below 56881 . In this scenario, the next support zones are 56729 56555 56225.
Wishing you good health and trading success as always.As always, prioritize your health and trade with caution.
As always, it’s essential to closely monitor market movements and make informed decisions based on a well-thought-out trading plan and risk management strategy. Market conditions can change rapidly, and it’s crucial to be adaptable and cautious in your approach.
► Join Youtube channel : Click here
► Check out Gann Course Details: W.D. Gann Trading Strategies
► Check out Financial Astrology Course Details: Trading Using Financial Astrology
► Check out Gann Astro Indicators Details: Gann Astro Indicators