Bank Nifty Coiled in a Gann Angle Vise: The Calm Before the 700-Point Storm – Bramesh’s Technical Analysis
Beneath the Surface: A Quiet Escalation as New Bearish Bets Emerge in Bank Nifty
On November 14, 2025, the Bank Nifty Index Futures market presented a deceptive picture of calm from its institutional players. A seemingly negligible net sale of just 242 contracts by Foreign Institutional Investors (FIIs) could easily be interpreted as a neutral, do-nothing stance. However, the session’s most critical data point reveals a much more significant and ominous development: the net Open Interest (OI) increased by 224 contracts.
This is a subtle but potent signal. It indicates that the market is quietly transitioning from a phase of reversal and recovery into a new phase of active position building for the next major trend. The period of chaotic short-covering is over, and now, new, strategic bets are being placed.
Decoding the Data: The End of the Unwind, The Start of the Build
This combination of light FII selling and rising OI points to a market that is consolidating and building energy, with institutions beginning to test the bearish side once again.
-
The FIIs’ Probing Action: The small FII selling is not a sign of panic or aggressive shorting. Instead, it should be viewed as a methodical, probing action. After the recent violent rally, the FIIs are using the newfound price stability to gently initiate new short positions. They are effectively “testing the waters,” selling into strength to see if there is enough buying power to absorb their supply. Their action, while small, signals that they view the rally with suspicion and see the current price levels as an opportunity to start building a new bearish case.
-
The Vital Signal of Rising Open Interest: This is the most important clue. An increase in OI means that brand-new contracts are being created. It signifies new capital entering the market with conviction. For the OI to rise while FIIs were net sellers, it means we are seeing new, two-sided participation. New bulls are entering, confident in the rally, while new bears (led by the FIIs) are entering to challenge them. This is profoundly different from a market rallying on falling OI (which signals trend exhaustion). This is a sign of a healthy, budding conflict—a prerequisite for the next major, sustained move.
Key Implications for Traders
-
A Building of Cause for the Next Major Move: The market is no longer unwinding old positions; it is building the foundation for its next trend. Rising OI is the classic signature of a market “building cause” for a future, significant effect.
-
The Easy Rally is Over: The phase of the rally being fueled by panicked short-covering has likely ended. The market is now encountering fresh, institutional supply, which will make further upward progress much more difficult.
-
The Start of a New Stalemate: This data signals the beginning of a new battle. Both confident bulls and methodical bears are now actively participating, creating a state of equilibrium. This is likely to lead to a period of range-bound, volatile trading as the market decides who will win this new conflict.
-
Increased Sensitivity to Catalysts: A market that is coiling with fresh positions on both sides becomes highly sensitive to external catalysts. A major news event or a key technical break could now unleash this stored energy in a violent, directional move.
Conclusion
Do not dismiss this session as quiet or uneventful. The underlying data reveals a significant transition. The key takeaway is the increase in Open Interest, which confirms that the market is now reloading for its next major move. The FIIs have fired the first, quiet shot, signaling their intention to challenge the recent rally. The Bank Nifty has entered a new phase of two-sided conflict, and the recent calm is likely the prelude to a new round of significant volatility.
Bank Nifty Nov Futures Open Interest Volume stood at 17 lakh, with liquidation of 1 Lakh contracts. Additionally, the Increase in Cost of Carry implies that there was a closeure of SHORT positions today.
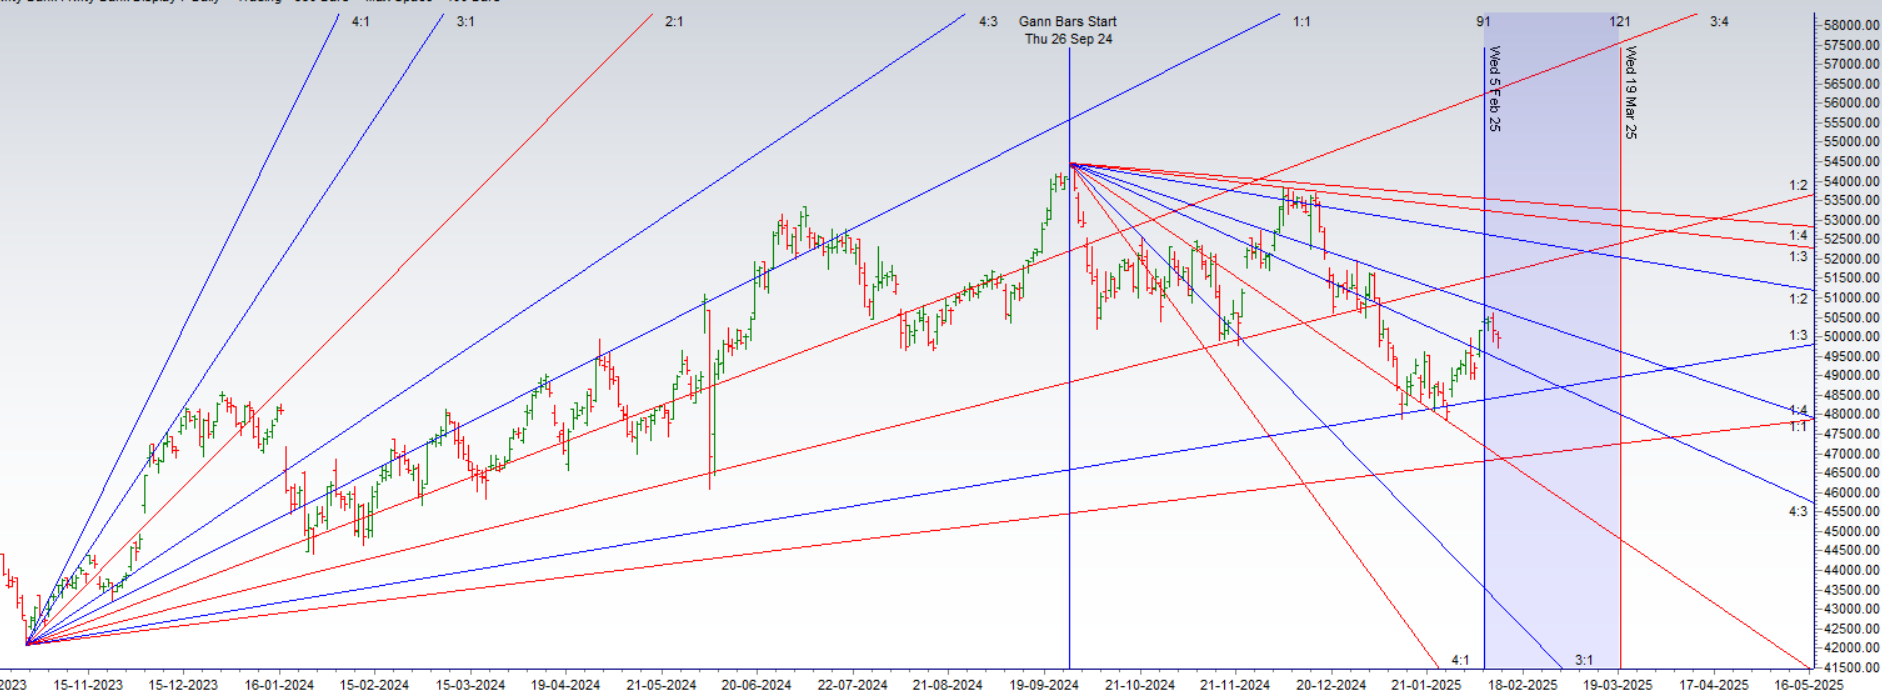
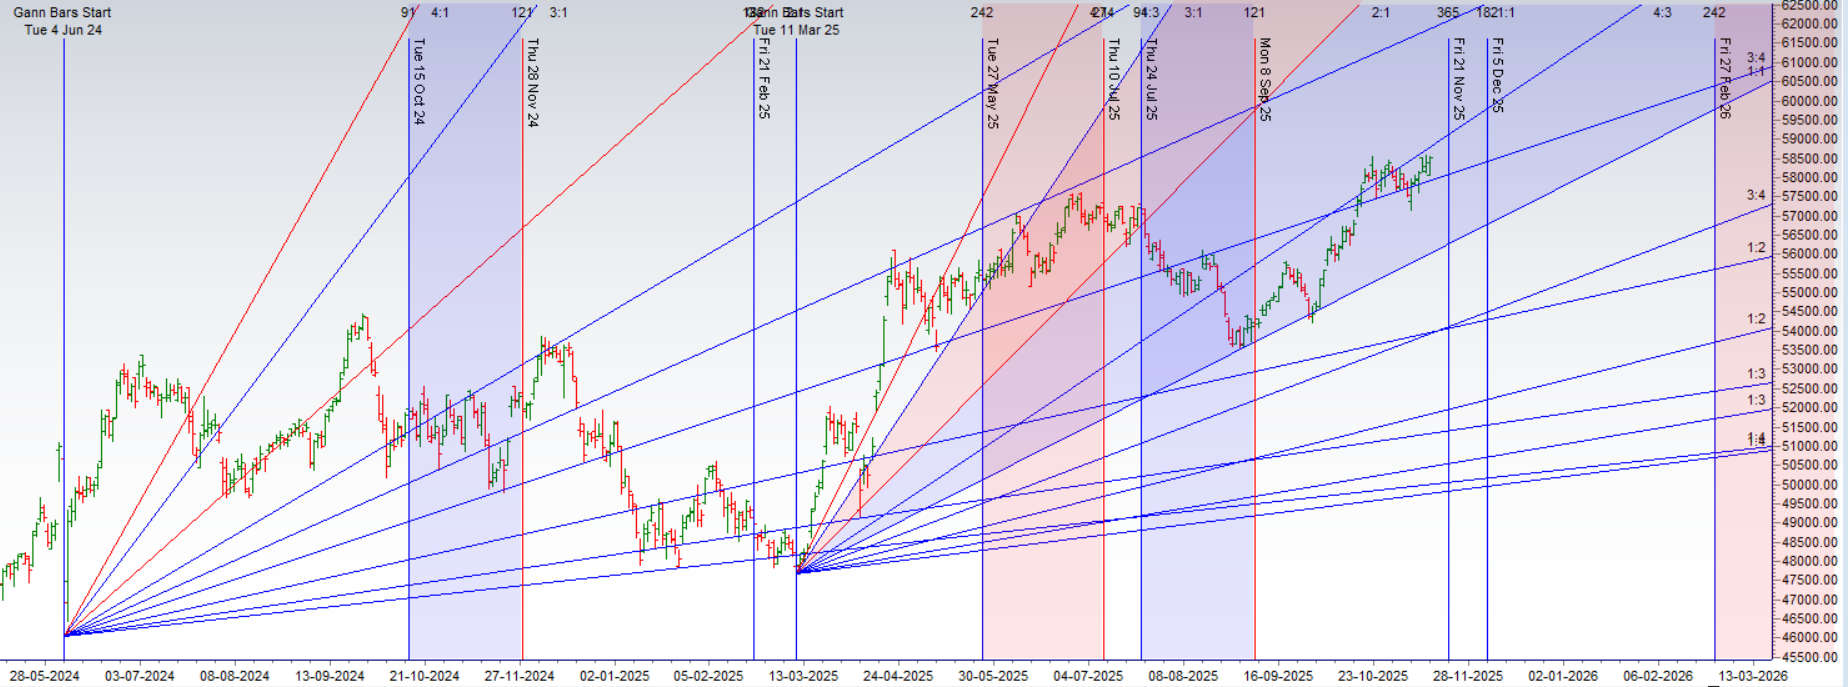
Bank Nifty Trade Plan for Positional Trade ,Bulls will get active above 58592 for a move towards 58831/59070. Bears will get active below 58114 for a move towards 57875/57636/57396
Bank Nifty Advance Decline Ratio at 10:02 and Bank Nifty Rollover Cost is @58357 closed above it.
Bank Nifty Consolidates at a New Plateau as a Tense Stalemate Emerges
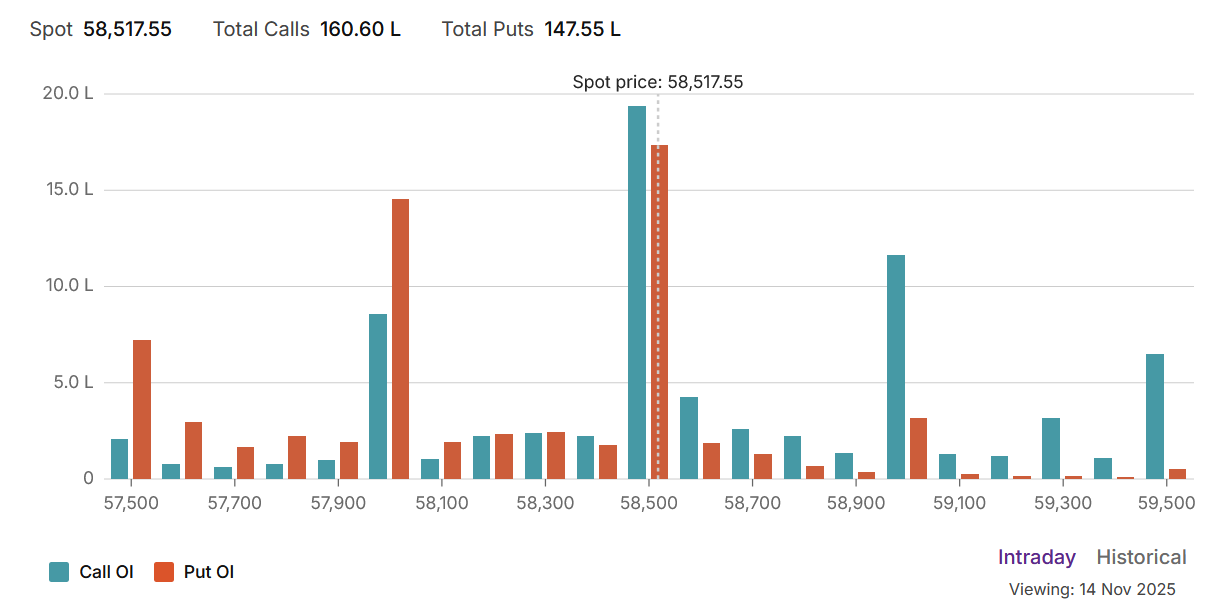
The Bank Nifty options market is in a state of high-level consolidation, signaling that the initial, explosive phase of the recovery is over and a more complex, two-sided battle is now underway. The market’s structural foundation has clearly shifted higher, with the Max Pain point settling at 58,300. However, a slight dip in the Put-Call Ratio (PCR) to 0.91 suggests that bullish conviction is being met with renewed caution, creating a tense equilibrium where neither bulls nor bears have a clear advantage.
The Psychology of the Data: Cautious Neutrality at a Higher Altitude
The two primary data points tell a story of a market at a crossroads:
-
The Upward Structural Shift (Max Pain at 58,300): This is the most significant bullish signal. The market’s “center of gravity” has been successfully dragged upwards from the 58,000 level. This indicates that major option writers have accepted the higher price range as the new reality and are now building their largest positions around this new pivot. The battle is no longer about reclaiming old territory; it’s about controlling this new, higher plateau.
-
Waning Bullish Momentum (PCR at 0.91): While still in healthy neutral territory, the slight decrease in the PCR from its recent peaks is a subtle but important sign. It suggests that the aggressive put writing that fueled the rally is slowing, and some cautious call writing or put buying is re-emerging. The easy, short-covering-driven rally is over, and the market is now facing a more challenging environment where every upward move will be contested.
Defining the New Battlefield: Key Support and Resistance
This higher-level consolidation has established a clear and formidable set of boundaries that will likely define the market’s trading range in the near term.
-
Ultimate Resistance: A massive wall of Call Open Interest remains entrenched at the 58,500 strike. This is the primary ceiling and the most significant barrier for the bulls to overcome. It represents the point where call sellers have made their biggest stand.
-
Immediate Resistance / Central Pivot: The 58,300 level, as the new Max Pain point, is the immediate and most critical pivot. The market will likely be drawn to this price, and it will act as a constant point of contention.
-
Major Support: The former battleground of 58,000 has now definitively converted into a powerful support floor. A large concentration of put writers is positioned here, ready to defend this level. This classic resistance-turned-support dynamic is a hallmark of a healthy uptrend.
-
Ultimate Support: The final line of defense remains the significant wall of Put OI at 57,500. A break below this level is considered a low-probability event in the current environment.
Conclusion
The Bank Nifty has successfully established a new, higher trading range, but its upward momentum has stalled. The market is now locked in a tense stalemate, defined by the strong support at 58,000 and the formidable resistance at 58,500. The Max Pain at 58,300 will act as a powerful magnet, pulling the price towards the center of this range. The most likely scenario is a continued period of volatile, sideways consolidation as bulls and bears fight for control of this new high ground. A decisive breakout will require a major catalyst to overcome the immense options positions that are currently enforcing this stalemate.
For Positional Traders, The Bank Nifty Futures’ Trend Change Level is At 58342. Going Long Or Short Above Or Below This Level Can Help Them Stay On The Same Side As Institutions, With A Higher Risk-reward Ratio. Intraday Traders Can Keep An Eye On 58540, Which Acts As An Intraday Trend Change Level.
BANK Nifty Intraday Trading Levels
Buy Above 58721 Tgt 58900, 59050 and 59262 (BANK Nifty Spot Levels)
Sell Below 58450 Tgt 58300, 58108 and 57900 (BANK Nifty Spot Levels)
Wishing you good health and trading success as always.As always, prioritize your health and trade with caution.
As always, it’s essential to closely monitor market movements and make informed decisions based on a well-thought-out trading plan and risk management strategy. Market conditions can change rapidly, and it’s crucial to be adaptable and cautious in your approach.
► Join Youtube channel : Click here
► Check out Gann Course Details: W.D. Gann Trading Strategies
► Check out Financial Astrology Course Details: Trading Using Financial Astrology
► Check out Gann Astro Indicators Details: Gann Astro Indicators
Related
Source link