Market Analysis: FIIs Hit Pause in the Eye of the Storm, Data Shows Market Coiling for a Big Move
Executive Summary:
The derivatives data from August 7th offers a textbook example of “the calm before the storm.” Foreign Institutional Investors (FIIs) adopted a perfectly neutral stance in the Bank Nifty, with their net activity near zero. This deliberate inaction, coming just ahead of a major event trigger, is a powerful signal in itself. It indicates that institutional players have paused their aggressive activities, choosing to wait on the sidelines for a clear directional catalyst. The slight increase in overall Open Interest suggests that while the “smart money” holds its breath, the market is coiling like a spring, building up tension for a potentially explosive move post-event.
1. Decoding the FII Action: The Definition of Neutrality
The headline numbers, while seemingly insignificant, tell a profound story of institutional strategy.
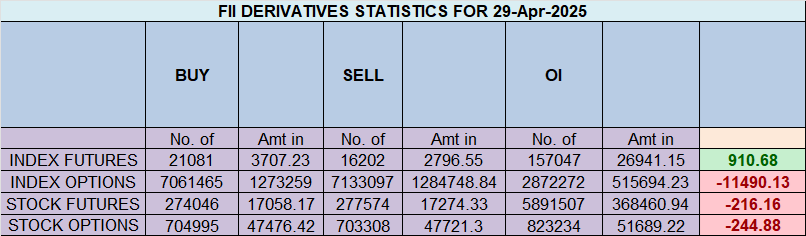
Statistically Zero Activity: A net buy of 76 contracts with a notional value of just 16 crore is, in the context of FIIs’ daily volume, effectively zero. It shows a perfect equilibrium where the number of bullish actions (adding longs, covering shorts) was almost perfectly matched by the number of bearish actions (adding shorts, covering longs).
No New Capital Commitment: This data confirms that FIIs did not commit any significant new capital to either side of the trade. They are not extending their bearish bets, nor are they initiating fresh longs. This is a classic sign of pre-event paralysis, where large institutions refuse to gamble on a binary outcome.
2. The Open Interest Clue: A Market Building Tension
While FIIs were inactive, the market itself was not entirely asleep. The net Open Interest (OI) for the Bank Nifty increased by 652 contracts.
What this means: This small but notable increase in OI indicates that new positions were still being created across the market, even as FIIs paused. This activity was likely driven by other participants (such as retail traders or proprietary desks) placing their bets ahead of the event.
Coiling for a Move: An increase in OI during a period of price consolidation is like coiling a spring. It means potential energy is building up beneath the surface. When the event trigger is finally pulled, this stored energy is likely to be released in the form of a sharp, high-velocity move.
3. Strategic Implications and Market Outlook
This specific data pattern has critical implications for traders.
The Calm is Deceptive: The lack of major movement and FII activity should not be mistaken for stability. It is a sign of extreme tension and indecision ahead of a market-moving event (like an RBI policy decision or major global news).
Volatility is Imminent: This setup almost always precedes a spike in volatility. The market is waiting for its marching orders. Once the news is out, the sidelined institutional capital is expected to rush in to establish positions, driving a powerful trend in the direction of the surprise.
Key Levels to Watch: The high and low of this “pause day” (August 7th) now become extremely critical technical levels. A decisive break above the day’s high or below the day’s low after the news will likely signal the direction of the next sustained move.
Conclusion:
The FII data from August 7th is a clear signal to traders to be on high alert. The institutional players have deliberately stepped back, waiting for clarity. This has created a tense, low-volume consolidation that is almost certain to resolve into a period of high volatility. The market is holding its breath, and traders should be prepared for a significant directional move once the awaited news catalyst is released.
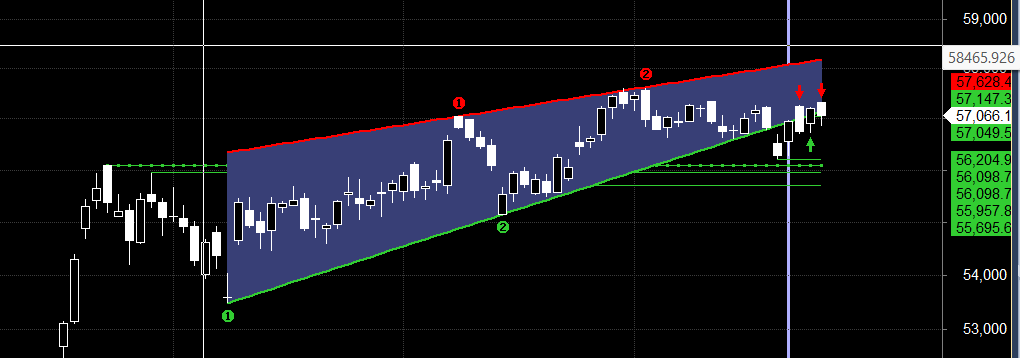
The Bank Nifty is standing at a critical and potentially explosive turning point. After a period of intense volatility, driven by the predicted impact of the Mars sign change, the index has carved out two powerful technical reversal patterns: a daily Outside Bar and a weekly Doji. These classic bottoming signals are being supported by a positive fundamental catalyst from the AU Bank news and a bullish astrological setup with the upcoming Full Moon. Today’s session is particularly crucial, with the Mars at Zero Declination event providing a clear intraday trading plan based on the first 15 minutes of price action.
1. The Technical Evidence: A Textbook Bottoming Formation
The chart is now flashing two of the most reliable candlestick reversal patterns, signaling that the recent downtrend may be exhausted.
The Daily Outside Bar (A Shift in Control): An Outside Bar occurs when the daily trading range completely engulfs the range of the previous day. This pattern signifies a major battle between bulls and bears, ending with a decisive victory for one side. In this context, it suggests that the intense selling pressure was absorbed and forcefully rejected, indicating a powerful potential shift in sentiment from bearish to bullish. It is a clear sign that the market is attempting to carve out a significant bottom.
The Weekly Doji (A State of Perfect Equilibrium): Zooming out, the weekly chart is forming a perfect Doji candlestick. A Doji, characterized by its opening and closing prices being nearly identical, signifies complete indecision and equilibrium. After a prolonged six-month decline, a Doji is a powerful signal of bearish exhaustion. The sellers no longer have the strength to push the market lower, and the bulls are now strong enough to hold the line. This equilibrium often precedes a major trend reversal.
2. The Catalysts: Fundamental and Celestial Tailwinds
The technical signals are not occurring in a vacuum; they are being supported by tangible positive news and favorable astrological alignments.
Fundamental Booster (AU Bank): The RBI’s approval for AU Small Finance Bank to become a Universal Bank is a significant, positive catalyst specifically for the banking sector. This news improves sentiment, injects confidence, and can attract fresh buying interest into banking stocks, providing the fundamental fuel needed to drive a technical reversal.
Celestial Culmination (The Full Moon): A Full Moon in astrology is often associated with culmination, peak emotion, and reversals. Coming at the end of a long decline and coinciding with the Doji formation, the weekend’s Full Moon reinforces the theme of the bearish trend reaching its ultimate conclusion and a new, positive cycle beginning.
3. Today’s Intraday Game Plan: Mars at Zero Declination
Today’s session is pivotal, and the Mars at Zero Declination event provides a clear, actionable strategy for traders. This astrological event is known for creating major pivot points.
Conclusion:
The Bank Nifty is presenting one of the strongest confluences of bullish reversal signals seen in recent times. The powerful combination of a daily Outside Bar and a weekly Doji, backed by positive fundamental news and a favorable astrological backdrop, creates a high-probability setup for a significant market bottom. The intraday plan is clear: watch the first 15 minutes of trading. A break of the high could be the starting gun for the next major rally. The bears have been warned; the bulls are preparing to take back control.
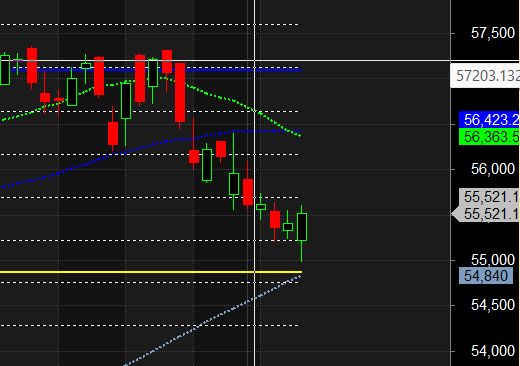
Bank Nifty Trade Plan for Positional Trade ,Bulls will get active above 55676 for a move towards 55911/56145. Bears will get active below 55442 for a move towards 55208/54973
Bank Nifty August Futures Open Interest Volume stood at 26 lakh, with addition of 490 contracts. Additionally, the Increase in Cost of Carry implies that there was a covering of SHORT positions today.
Bank Nifty Advance Decline Ratio at 09:02 and Bank Nifty Rollover Cost is @56344 closed below it.
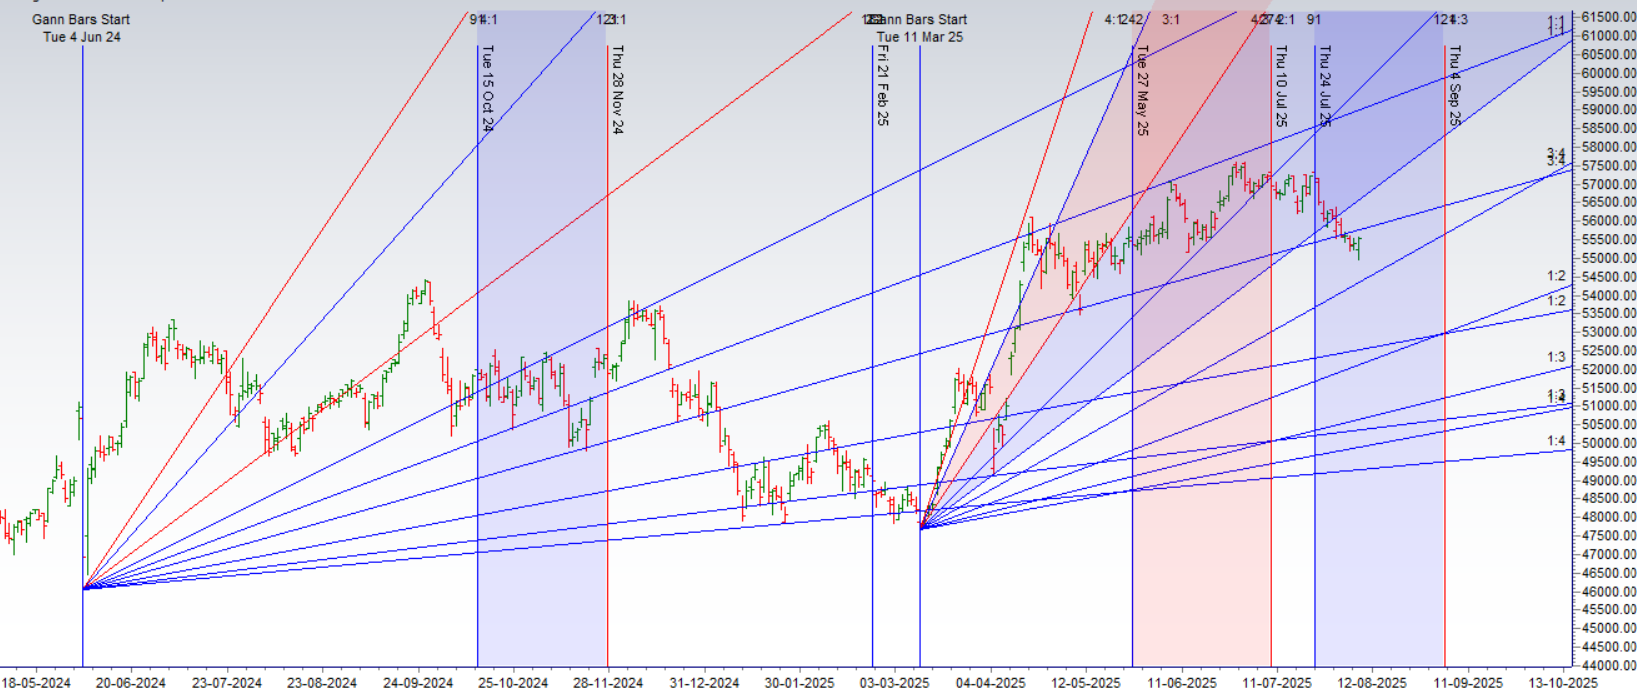
BANK Nifty Gann Monthly Buy Level : 56242
BANK Nifty Gann Monthly Sell Level : 55555
Bank Nifty closed Below its 100 SMA @56400 ,Trend is Buy on Dips till above 55300
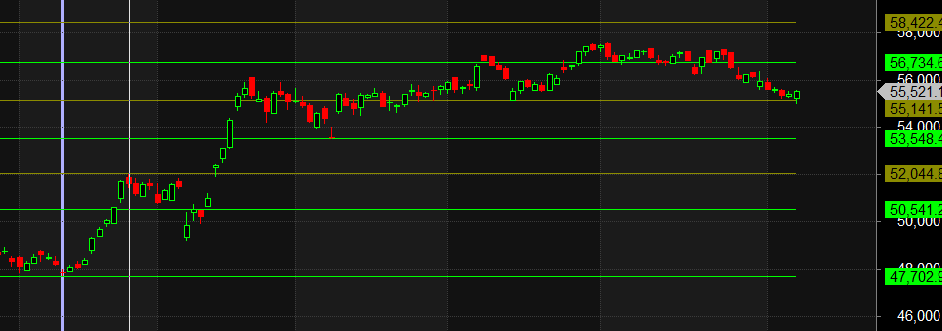
Traders who follow the musical octave trading path may find valuable insights in predicting Bank Nifty’s movements. According to this path, Bank Nifty may follow a path of 53548-55141-56734-58422. This means that traders can take a position and potentially ride the move as Bank Nifty moves through these levels. Of course, it’s important to keep in mind that trading is inherently risky and market movements can be unpredictable.
According to the Bank Nifty options chain, the call side has the highest open interest (OI) at the 56000 strike, followed by the 56500 strike. On the put side, the 55000 strike has the highest OI, followed by the 54500 strike.This indicates that market participants anticipate Bank Nifty to stay within the 55000-56000 range.
The Bank Nifty options chain shows that the maximum pain point is at 56000 and the put-call ratio (PCR) is at 0.75 Typically, when the PCR open interest ranges between 0.90 and 1.05, the market tends to remain range-bound. PCR is on extreme end suggesting we can see sharp reversal .
Don’t trade on emotion. Trading is a numbers game, and it’s important to make decisions based on logic and analysis, not emotion.
For Positional Traders, The Bank Nifty Futures’ Trend Change Level is At 55775. Going Long Or Short Above Or Below This Level Can Help Them Stay On The Same Side As Institutions, With A Higher Risk-reward Ratio. Intraday Traders Can Keep An Eye On 55483 , Which Acts As An Intraday Trend Change Level.
Wishing you good health and trading success as always.As always, prioritize your health and trade with caution.
As always, it’s essential to closely monitor market movements and make informed decisions based on a well-thought-out trading plan and risk management strategy. Market conditions can change rapidly, and it’s crucial to be adaptable and cautious in your approach.
MCX Crude Oil Gann Angle Chart Crude reacted from its 1×3 gann angle support ,now heading towards 6200-6300 range. MCX Crude Oil Supply Demand Zone MCX CRUDE OIL Supply Demand Chart : Demand in range of 5960-6000 Supply in range of 6100-6138 MCX Crude Oil Crude Harmonic Price has heading…
Like all technical analysis tools, the Vortex Indicator is not foolproof. One major drawback is its tendency to generate false trade signals in temporary trends or down trending markets. Since the VI lines are always in a bullish performance or negative vortex indicator formation, traders must apply additional trading indicators to avoid unnecessary trades. Another…
FIIs Maintain Bullish Stance in Nifty Futures – April 29, 2024 Foreign Institutional Investors (FIIs) continued to reflect a bullish outlook in the Nifty Index Futures segment, buying 6165 contracts worth ₹1130 crore. The move was backed by a net open interest (OI) increase of 7549 contracts, signaling fresh long positions being built into the…
The Great Unwinding: FIIs De-Risk in Bank Nifty, Signaling a Deceptive Calm FIIs net shorted a mere 227 contracts worth a modest ₹44 crore. But this number is deeply misleading. The truly critical piece of data, the one that tells the entire story, is the net open interest (OI) decrease of 1,499 contracts. This is a profound signal…
One of the most powerful tools in a trader’s arsenal is the reversal candle pattern. Daily reversal candlestick best reversal candle for stocks The stock market constantly goes up and goes down. It always will, no matter if we are in a bullish cycle or bearish cycle. Learning this stock market reversal candlestick pattern will…
Enjoy this post? Share the love. Discover the three powerful buy signals flashing in the Nasdaq and learn how to profit from the surprising shift in market leadership. Veteran analyst Rick Pedicelli reveals the technical indicators and leading stocks that could supercharge your returns, and shares a game-changing insight into the rise of mid-cap growth…