Bank Nifty’s Doji Verdict: A Market Coiled at a Cosmic Crossroads – Bramesh’s Technical Analysis
A Market Adrift: FIIs Step Aside as Bank Nifty Hollows Out
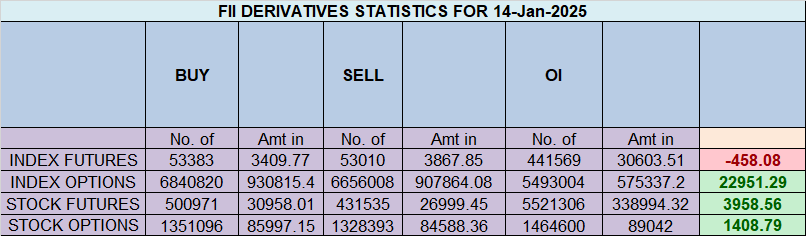
On February 26, 2026, the Bank Nifty Index Futures market presented a picture of profound participant exhaustion and a market adrift. On the surface, the action from Foreign Institutional Investors (FIIs) was negligible—a tiny net short of just 180 contracts, effectively a neutral stance.
However, the true and far more significant story of the session was the continued decrease in net Open Interest (OI), which contracted by 454 contracts. This is not the data of a healthy, building trend, but the classic signature of a market in a state of deep exhaustion and participant disengagement. The players who drove the previous trend are leaving the field.
Decoding the Data: The Quiet Exodus
The key to understanding this session is the powerful message being sent by the broader market’s withdrawal, while the most powerful players stand aside.
-
The FIIs: The Neutral Spectators: The FIIs’ neutral stance is highly revealing. After a period of intense volatility and major moves, their refusal to commit new capital to either the long or short side is a clear vote of no confidence in the sustainability of the current price levels. They see no clear edge. They are not bullish enough to buy, nor are they bearish enough to initiate fresh shorts. They are waiting for a new, clearer signal, and their inactivity speaks volumes about the market’s current state of peak uncertainty.
-
The Main Event: The OI Collapse: This is the most critical market signal. For OI to fall significantly while the FIIs are essentially doing nothing, it means a substantial number of other participants are aggressively closing their books. This mass exodus is the hallmark of trend exhaustion, where two groups are acting simultaneously:
-
The Winning Bulls: Traders who rode the recent rally are taking their profits off the table, selling their long positions.
-
The Defeated Bears: The last of the trapped shorts are finally giving up, buying back their positions to close them out and end their financial pain.
-
When both the winners and the losers of a trend are rushing for the exits at the same time, it is the ultimate sign that the move is over.
Key Implications for the Market
-
Profound Trend Exhaustion: The “fuel” for the recent trend—conviction from both bulls and bears—has been spent. The market is now running on fumes.
-
A Brittle and Vulnerable Market Structure: This mass deleveraging “hollows out” the market. With fewer active participants, liquidity thins out, making the market fragile and highly susceptible to a sharp, sudden reversal or a “gap” move on any news.
-
The Calm Before the Next Storm: The old trend is over. The market is now in a quiet, dangerous phase, waiting for a new catalyst to ignite the next major directional trend. This period of low conviction is deceptive and often precedes the next major volatility event.
-
High Risk for Directional Bets: In a market showing such clear signs of disengagement, making large, high-conviction directional bets is exceptionally risky. The established “edge” has disappeared.
Conclusion
Disregard the tiny FII shorting figure. The dominant and undeniable story is the significant collapse in Open Interest. This signals a full-scale retreat by the broader market and profound trend exhaustion. The Bank Nifty is not consolidating for a new move; it is adrift in a sea of uncertainty, waiting for a new wind to give it direction. This makes the market extremely fragile and vulnerable to the next major catalyst, wherever it may come from
Bank Nifty Dec Futures Open Interest Volume stood at 13.6 lakh, with addition of 0.13 Lakh contracts. Additionally, the Increase in Cost of Carry implies that there was a closeure of LONG positions today.
Bank Nifty Advance Decline Ratio at 08:06 and Bank Nifty Rollover Cost is @61486 closed above it.
The Bank Nifty options market is radiating a state of powerful bullish control and high confidence. A very strong Put-Call Ratio (PCR) of 1.14 has pushed the market deep into bull territory, signaling that put open interest significantly exceeds that of calls. This is the classic signature of a market operating with minimal fear, driven by aggressive put writers who are confidently selling downside protection and, in the process, creating a formidable support structure beneath the index.
The most critical development is the divergence between the Max Pain point, anchored at 61,000, and the spot price trading decisively higher at 61,187. This is a powerful bullish signal. It shows that the bulls have successfully stretched the market beyond its financial center of gravity, inflicting significant financial pain on the call sellers at the 61,000 strike. This creates the classic conditions for a “short squeeze,” where these sellers could be forced to buy futures to cover their mounting losses, further accelerating the rally.
This powerful breakout has completely redrawn the market’s battlefield:
-
Resistance: The primary and most formidable ceiling is the “Great Wall of Calls” located at the 61,500 strike. This is the next major target for the bulls and the last line of defense for the bears.
-
Support: The 61,000 level, formerly a pivot, has now decisively flipped to become the new primary support floor. Below this, the ultimate foundation for the current rally is the massive wall of Put OI at 60,500.
In conclusion, the stalemate is broken, and the bulls are in firm command. The market is in a classic “breakout” phase, fueled by the pain of trapped call sellers. The path of least resistance remains upwards, targeting 61,500, as long as the bulls can successfully defend the new 61,000 support fortress.
Bank Nifty Spot – Intraday Technical Setup
Market Observation: The index is currently trading within a defined range. Traders should watch the following pivot zones for potential directional moves:
-
Strength (Upside): If the index sustains above 61255 , it indicates bullish momentum. The immediate resistance levels to watch are 61385 61501 61666 .
-
Weakness (Downside): Selling pressure is likely to intensify if the index breaks below 61140 . In this scenario, the next support zones are 61000 60848 60610.
Wishing you good health and trading success as always.As always, prioritize your health and trade with caution.
As always, it’s essential to closely monitor market movements and make informed decisions based on a well-thought-out trading plan and risk management strategy. Market conditions can change rapidly, and it’s crucial to be adaptable and cautious in your approach.
► Join Youtube channel : Click here
► Check out Gann Course Details: W.D. Gann Trading Strategies
► Check out Financial Astrology Course Details: Trading Using Financial Astrology
► Check out Gann Astro Indicators Details: Gann Astro Indicators