Recession Fears Hit Hard! Bank of America’s Decline Explained 🏦
Bank of America (BAC) stock has faced a significant decline over the past three weeks, reflecting broader economic concerns. Recent U.S. economic indicators have raised fears of a potential recession. A weak jobs report showed an increase in unemployment, which has amplified investor anxiety about the economy’s health and its potential impact on consumer spending. This macroeconomic uncertainty has spurred a sell-off in bank stocks, including Bank of America, which has seen a sharp drop in its share price.
Interest Rate Pressures
The Federal Reserve’s monetary policy continues to influence the banking sector significantly. Although rising interest rates initially boosted profits for banks like Bank of America, the tide appears to be shifting. Higher deposit costs and shrinking loan balances are now squeezing net interest income, a core driver of profitability. Adding to the challenge, growing market expectations of rate cuts by the Fed amid recession fears have raised concerns about further pressure on earnings. These dynamics underscore the delicate balance banks face in navigating the evolving interest rate environment.
Financial Performance Challenges
Declining Earnings Impact Investor Sentiment
Bank of America recently reported a 23% decline in earnings per shareEarnings per share (EPS) is a fundamental financial metric that provides valuable insights into a company’s profitability. This widely used indicator helps investors and analysts g… (EPS) over the past year. This decline in profitability contrasts with relatively stable revenue, signaling that while the bank is maintaining its sales, cost pressures and other financial stresses are weighing on its bottom line. For investors, such performance raises red flags about the bank’s ability to sustain long-term growth and profitability, further driving the stock’s downward trajectory.
Unrealized Bond Losses Add to Financial Strain
Another critical factor contributing to Bank of America’s struggles is its unrealized losses on bondsUnited States Treasury securities are debt instruments issued by the United States government to finance its spending. Treasury securities come in a variety of forms, including bil… purchased when interest rates were lower. With the Federal Reserve aggressively raising rates since 2022, the market value of these bondsUnited States Treasury securities are debt instruments issued by the United States government to finance its spending. Treasury securities come in a variety of forms, including bil… has diminished, creating significant financial stress. This challenge is not unique to Bank of America, as other banks have also grappled with similar issues. However, the magnitude of these losses has added to the cautious sentiment surrounding BAC’s financial stability.
Bank of America Fundamental Valuation Metrics
Key Financial Metrics
- Stock Price: $43.38 (as of December 19, 2024)
- Market Cap: $332.85 billion
- Earnings Per ShareEarnings per share (EPS) is a fundamental financial metric that provides valuable insights into a company’s profitability. This widely used indicator helps investors and analysts g… (EPS): $2.76 (trailing twelve months)
- Price-to-EarningsThe price-to-earnings ratio, often abbreviated as P/E ratio, is a fundamental metric used by investors and analysts to evaluate the relative value of a company’s shares in the stoc… Ratio (P/EThe price-to-earnings ratio, often abbreviated as P/E ratio, is a fundamental metric used by investors and analysts to evaluate the relative value of a company’s shares in the stoc…): 15.72 (trailing), with a forward P/EThe price-to-earnings ratio, often abbreviated as P/E ratio, is a fundamental metric used by investors and analysts to evaluate the relative value of a company’s shares in the stoc… of 12.84
- Price-to-Book Ratio (P/B): 1.28
- Dividend Yield: 2.31% ($1.04 annual dividend)
- Net Profit MarginIn the dynamic world of business, profitability is a fundamental metric that encapsulates a company’s ability to generate earnings from its operations. Profit margins, expressed as…: ~23%
- Debt-to-Equity Ratio: High at 266.6%, reflecting significant leverage.
Valuation Insights
- Analysts generally consider Bank of America to be slightly overvalued based on intrinsic valuation models, with the estimated “real value” of the stock at $34.97 compared to its current price of $43.38.
- The stock is trading at a premium relative to some peers in the banking sector, but its valuation metrics, such as P/EThe price-to-earnings ratio, often abbreviated as P/E ratio, is a fundamental metric used by investors and analysts to evaluate the relative value of a company’s shares in the stoc… and P/B ratios, remain competitive within the industry.
- The stock’s forward-looking price target is around $46.22, indicating limited upside potential in the near term.
Is Bank of America Stock a Good Buy?
Strengths
- Strong Core Business: Bank of America has a diversified revenue stream across consumer banking, wealth management, and investment banking, with a solid deposit base and robust loan portfolio.
- Digital Transformation: Investments in digital banking and AI are expected to enhance operational efficiency and customer engagement.
- Capital Returns: The company continues to reward shareholders through dividends and share buybacks, reflecting strong capital management.
- Resilience in Interest Rate Environment: Despite challenges from unrealized bond losses, the bank benefits from higher net interest income due to elevated interest rates.
Risks
- Unrealized Bond Losses: Like many banks, Bank of America faces pressure from unrealized losses on bondsUnited States Treasury securities are debt instruments issued by the United States government to finance its spending. Treasury securities come in a variety of forms, including bil… purchased during low-rate periods, which could weigh on profitability if sold.
- Economic Uncertainty: Concerns about a potential recession and high leverage ratios pose risks to its financial stability.
- Limited Growth Potential: With its current valuation near the upper end of its fair value range, upside potential appears constrained in the short term.
Analyst Sentiment
While some analysts rate BAC as a “Buy,” this is often tempered by concerns about overvaluation and macroeconomic risks. However, the bank’s solid fundamentals and expected earnings growth in 2025 make it attractive for long-term investors seeking stability and dividends.
From a fundamental perspective, Bank of America presents a mixed case for investment. It offers strong core operations, shareholder returns, and growth potential from digital initiatives but faces valuation concerns and economic headwinds. For long-term investors with a focus on dividends and financial sector exposure, it may be a reasonable buy at current levels. However, those seeking significant short-term capital appreciation might find better opportunities elsewhere given its limited upside potential based on current valuations.
Bank of America Stock Trading Plan
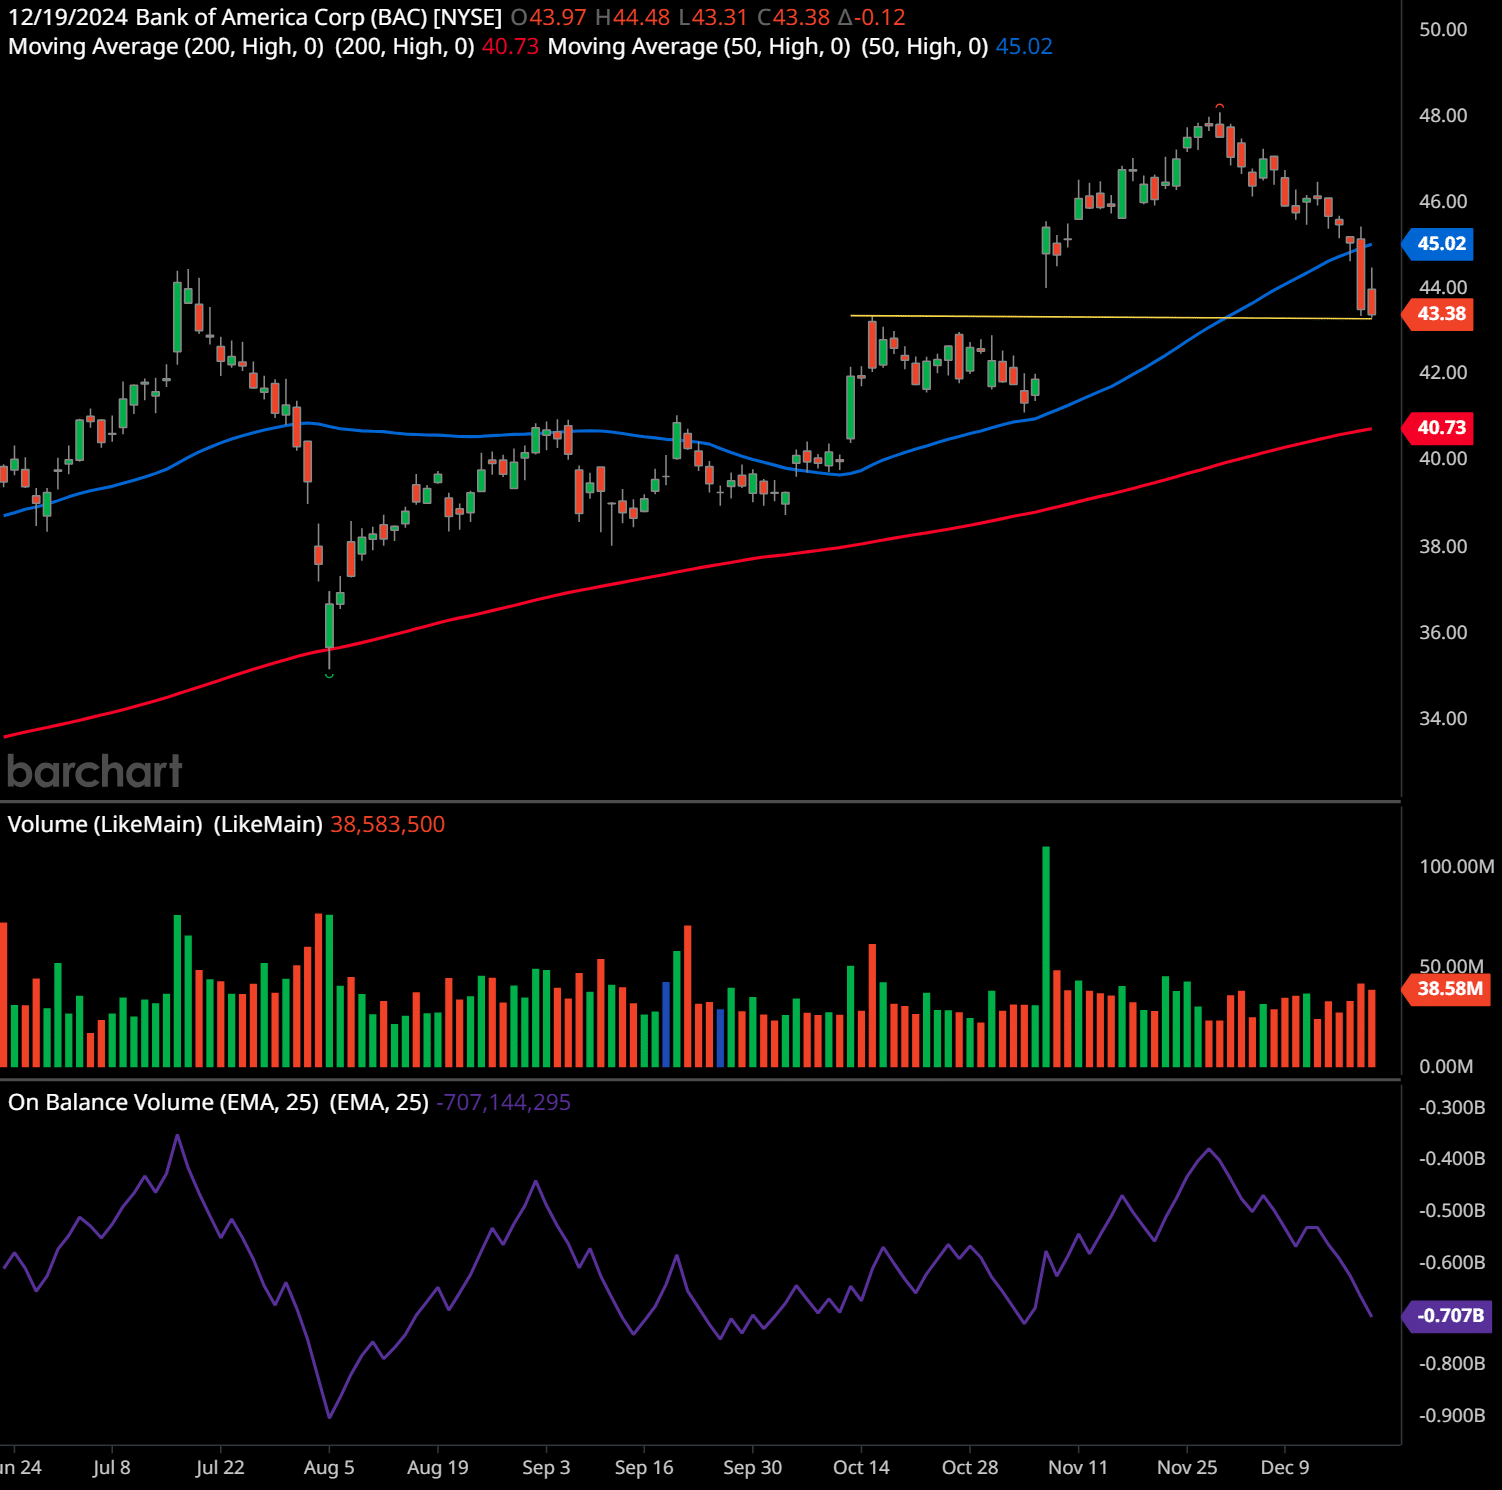
The chart provided shows Bank of America Corp. (BAC) on a daily timeframe. Below is the comprehensive technical analysis:
Support and Resistance Levels:
Immediate support is at $43, which is marked by recent price interactions and aligns with the horizontal line drawn on the chart.
Another strong support level is at $40.73, where the 200-day moving averageThe concept of moving averages dates back to the early 20th century. While it is challenging to attribute the invention of moving averages to a single individual, W. P. Hamilton, a… (red line) is positioned.
Resistance is around $45, the level where the stock recently broke below the 50-day moving averageThe concept of moving averages dates back to the early 20th century. While it is challenging to attribute the invention of moving averages to a single individual, W. P. Hamilton, a… (blue line).
Trend Analysis:
The stock had been in an uptrend until late November, forming higher highs and higher lows. However, it has recently started forming lower highs, suggesting a potential shift in momentum.
The 50-day moving averageThe concept of moving averages dates back to the early 20th century. While it is challenging to attribute the invention of moving averages to a single individual, W. P. Hamilton, a… ($45.02) has started sloping downward, indicating weakening short-term bullish momentum.
The price has broken below the 50-day moving averageThe concept of moving averages dates back to the early 20th century. While it is challenging to attribute the invention of moving averages to a single individual, W. P. Hamilton, a… but is still above the 200-day moving averageThe concept of moving averages dates back to the early 20th century. While it is challenging to attribute the invention of moving averages to a single individual, W. P. Hamilton, a…, suggesting that the medium-term trend remains neutral to slightly bullish.
Indicators:
Volume: There has been a noticeable increase in volume during the recent decline, suggesting that selling pressure has intensified. The latest volume of 38.58 million is above the average.
On-Balance VolumeThe On Balance Volume indicator (OBV) is a technical analysis tool used to measure the flow of money into and out of a security over a specified period of time. It is a cumulative … (OBVThe On Balance Volume indicator (OBV) is a technical analysis tool used to measure the flow of money into and out of a security over a specified period of time. It is a cumulative …): OBVThe On Balance Volume indicator (OBV) is a technical analysis tool used to measure the flow of money into and out of a security over a specified period of time. It is a cumulative … has shown a significant decline (-707M), indicating that the stock is experiencing distribution as sellers dominate.
This combination of volume and OBVThe On Balance Volume indicator (OBV) is a technical analysis tool used to measure the flow of money into and out of a security over a specified period of time. It is a cumulative … suggests bearish sentiment in the short term.
Chart Patterns:
A potential top can be observed, with the neckline around $43. A sustained break below $43 could signal further downside.
Additionally, the price consolidating near the 200-day moving averageThe concept of moving averages dates back to the early 20th century. While it is challenging to attribute the invention of moving averages to a single individual, W. P. Hamilton, a… indicates a key decision point for the stock.
Future Trend Indications:
Bear Case: A break below $43 would likely trigger further downside, targeting $40 or lower, where the 200-day moving averageThe concept of moving averages dates back to the early 20th century. While it is challenging to attribute the invention of moving averages to a single individual, W. P. Hamilton, a… acts as the next major support.
Bull Case: If the stock bounces from $43 and reclaims the 50-day moving averageThe concept of moving averages dates back to the early 20th century. While it is challenging to attribute the invention of moving averages to a single individual, W. P. Hamilton, a… ($45), it could resume its upward trend.
Overall, the near-term outlook is bearish unless the price can quickly recover above $45.
Stock Price Forecast:
Short-term (1-4 weeks): Bearish to neutral, with a potential retest of the $43 support level and possible movement toward $40 if $43 fails.
Medium-term (1-3 months): Neutral, as the price must decide whether to hold the 200-day moving averageThe concept of moving averages dates back to the early 20th century. While it is challenging to attribute the invention of moving averages to a single individual, W. P. Hamilton, a… or resume a bullish trend.
Long-term (6 months+): The trend remains bullish as long as the price stays above the 200-day moving averageThe concept of moving averages dates back to the early 20th century. While it is challenging to attribute the invention of moving averages to a single individual, W. P. Hamilton, a….
Trading Plans:
Swing Trading Plan:
Entry: Near $43 if it holds as support, with a stop-loss at $42.
Target: $45, then $46.
Alternative Entry: Short below $43, targeting $40, with a stop-loss at $44.
Long-Term Trading Plan:
Entry: Accumulate gradually between $40.73 (200-day MA) and $43.
Stop-loss: Close below $40.
Target: $50+ in the next 6-12 months, provided the 200-day moving averageThe concept of moving averages dates back to the early 20th century. While it is challenging to attribute the invention of moving averages to a single individual, W. P. Hamilton, a… holds.
Past performance is not an indication of future results. This article should not be considered as investment advice. Always conduct your own research and consider consulting with a financial advisor before making any investment decisions. 🧡
Why Bank of America Matters for Investors
Bank of America is a cornerstone of the U.S. banking sector and a bellwether for economic and financial market trends. Its performance offers insights into the broader health of the banking industry, including key areas like interest rate sensitivity, consumer spending, and credit dynamics. As one of the largest banks in the country, its ability to navigate economic headwinds serves as an indicator for the sector’s overall resilience.
For investors, Bank of America’s current struggles highlight the importance of monitoring macroeconomic trends, interest rate policies, and financial performance metrics. Despite the recent challenges, the bank remains a significant player with a vast customer base and strong revenue streams. Its recovery or continued decline will likely have ripple effects across the financial sector, making it an essential stock to follow for those interested in banking and economic stability.
In conclusion, Bank of America’s recent stock decline reflects a combination of rising economic concerns and internal financial pressures. For investors, understanding these dynamics is crucial to assessing the bank’s future prospects and the broader implications for the financial sector.
Do you have a news tip for GuerillaStockTrading? Please email us at
[email protected]
💥 GET OUR LATEST CONTENT IN YOUR RSS FEED READER
We are entirely supported by readers like you. Thank you.🧡
At GuerillaStockTrading, we maintain full transparency and impartiality; we never blog about stocks or crypto in which we hold a personal position unless explicitly stated in the article. Additionally, we do not accept paid promotions presented as content. All information shared is for informational purposes only and should not be construed as financial, investment, tax, or legal advice, nor as a recommendation to buy any security or financial asset. The content is general in nature and does not account for individual circumstances. It may not be suitable for your particular situation. Before making financial decisions, you are encouraged to seek guidance from your own financial or investment advisor.