
3 Stocks That Could Make You Filthy Rich in 2025 – Don’t Miss These Picks!

The stock market continues to be shaped by rapid technological advancements, particularly in artificial intelligence (AI) and semiconductors. As the global economy navigates an evolving digital landscape, certain companies are positioned to capitalize on these trends and deliver substantial growth. Among them, Nvidia, Meta Platforms, and Advanced Micro Devices (AMD) stand out as key players poised for significant expansion in 2025. Investors looking for strong opportunities in the tech sector should closely follow these companies due to their dominance in innovation, financial performance, and long-term strategic positioning.
Nvidia: The AI Powerhouse Driving Semiconductor Growth
Nvidia remains at the forefront of AI-driven growth in the semiconductor industry, with its leadership position in graphics processing units (GPUs) translating into record-breaking financial performance. In its fiscal third quarter, the company reported an extraordinary 94% year-over-year increase in revenue, accompanied by a 109% surge in net income. This explosive growth underscores Nvidia’s pivotal role in supplying the chips that power AI models, high-performance computing, and data centers worldwide.
Wall Street analysts remain highly optimistic about Nvidia’s future trajectory. Angelo Zino, a prominent industry expert, projects a 43% revenue growth for the company in fiscal 2026, maintaining a “buy” rating with a price target of $165. Given the increasing demand for AI chips from enterprises and cloud computing giants, Nvidia’s influence in the tech sector is expected to expand further. Investors who seek exposure to the AI revolution and the ongoing semiconductor boom should closely monitor Nvidia’s performance.
Nvidia Trading Plan
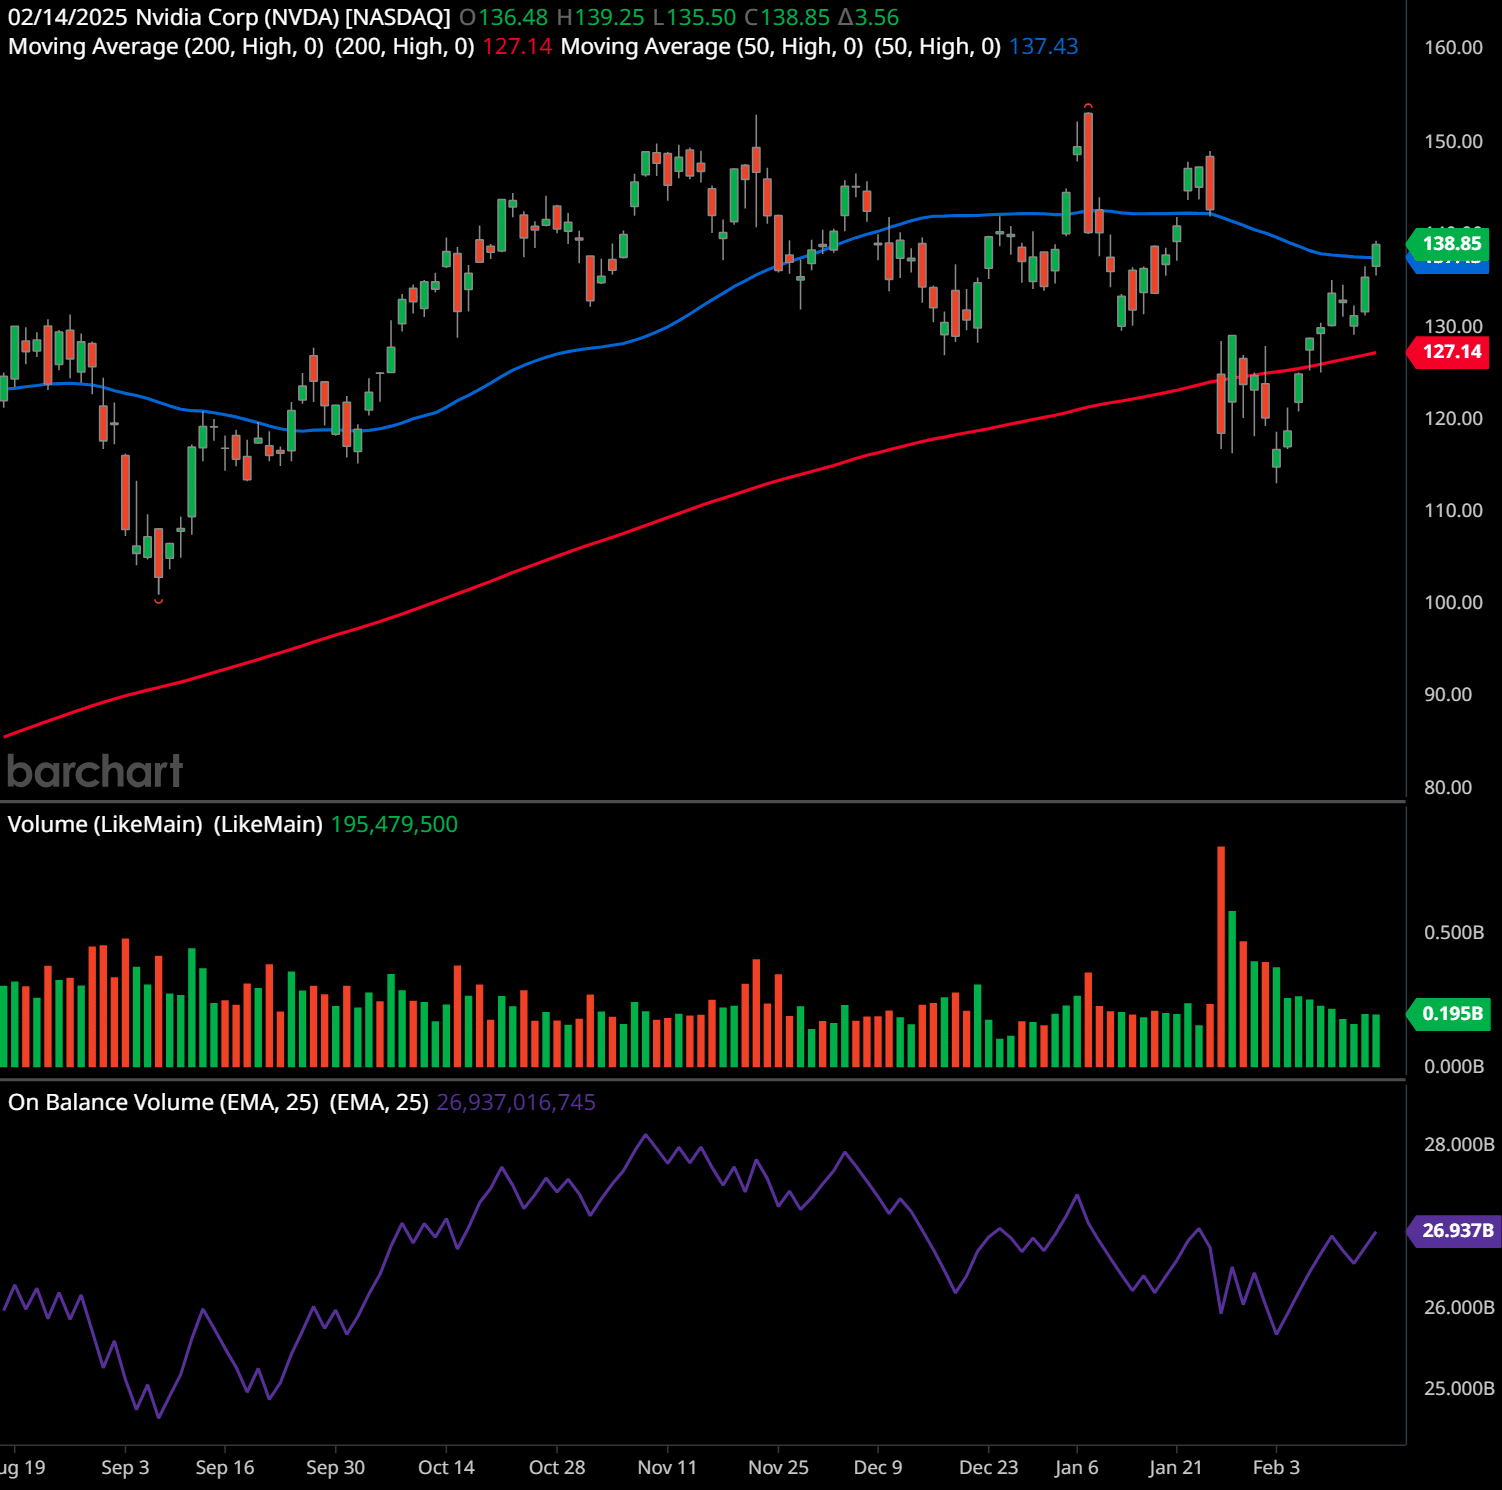
This daily chart of Nvidia Corp (NVDA) shows a stock that has been in an uptrend but experienced some volatility and a pullback before finding support. It recently moved back above key moving averagesThe concept of moving averages dates back to the early 20th century. While it is challenging to attribute the invention of moving averages to a single individual, W. P. Hamilton, a…, signaling potential strength.
Support and Resistance Levels:
- Support Levels: The 200-day moving averageThe concept of moving averages dates back to the early 20th century. While it is challenging to attribute the invention of moving averages to a single individual, W. P. Hamilton, a… at 127.14 has provided solid support, as the stock bounced off this level recently. The psychological round number of 130 also acted as support.
- Resistance Levels: The recent price action suggests resistance near 145-150, which coincides with previous highs where sellers have stepped in.
Trend Analysis:
NVDA remains in an overall uptrend but has gone through a period of consolidation and pullbacks. The price recently reclaimed the 50-day moving averageThe concept of moving averages dates back to the early 20th century. While it is challenging to attribute the invention of moving averages to a single individual, W. P. Hamilton, a… (137.43), which is a positive technical signal. The 200-day moving averageThe concept of moving averages dates back to the early 20th century. While it is challenging to attribute the invention of moving averages to a single individual, W. P. Hamilton, a… is sloping upward, indicating that the long-term trend remains intact. Higher lows suggest buyers are stepping in at higher levels, which supports a bullish continuation.
Chart Patterns and Psychology:
A potential inverse head and shouldersThe inverse head and shoulders pattern is a chart pattern that traders look for when trying to identify potential reversals in the trend of a security. It consists of three troughs… pattern is forming, with the left shoulder in early January, the head in late January, and the right shoulder forming in early February. The neckline is around 138-140. If the stock breaks above this level with strong volume, it could trigger a move higher.
The psychology behind this pattern is that sellers tried to push the price lower, but buyers gained control at each dip, leading to higher demand. A breakoutBreakout patterns occur when a stock price moves beyond a defined level of support or resistance with increased volume, signaling the potential start of a new trend. A breakout ind… above the neckline could cause more traders to jump in, fueling further gains.
Indicator Analysis:
- Volume: The recent uptick in price was accompanied by a solid volume of 195.48 million shares, suggesting strong buying interest.
- On-Balance VolumeThe On Balance Volume indicator (OBV) is a technical analysis tool used to measure the flow of money into and out of a security over a specified period of time. It is a cumulative … (OBVThe On Balance Volume indicator (OBV) is a technical analysis tool used to measure the flow of money into and out of a security over a specified period of time. It is a cumulative …): The OBVThe On Balance Volume indicator (OBV) is a technical analysis tool used to measure the flow of money into and out of a security over a specified period of time. It is a cumulative … is trendingUnderstanding market trends is a critical component for businesses conducting industry analysis. For example, Netflix identified early on the growing demand for streaming services … upwards, indicating that accumulation is happening. Buyers are stepping in on up days, showing positive momentumMomentum in stock trading refers to the rate of acceleration of a stock’s price or trading volume. It indicates the strength of a trend and measures how quickly prices are rising o….
- Moving AveragesThe concept of moving averages dates back to the early 20th century. While it is challenging to attribute the invention of moving averages to a single individual, W. P. Hamilton, a…: The stock is trading above both the 50-day and 200-day moving averagesThe concept of moving averages dates back to the early 20th century. While it is challenging to attribute the invention of moving averages to a single individual, W. P. Hamilton, a…, reinforcing bullish sentiment.
Stock Price Forecast:
- Bullish Scenario: A breakoutBreakout patterns occur when a stock price moves beyond a defined level of support or resistance with increased volume, signaling the potential start of a new trend. A breakout ind… above 140-145 could lead to a test of 150, and if momentumMomentum in stock trading refers to the rate of acceleration of a stock’s price or trading volume. It indicates the strength of a trend and measures how quickly prices are rising o… continues, possibly 160 in the medium term.
- Bearish Scenario: A failure to hold above the 50-day moving averageThe concept of moving averages dates back to the early 20th century. While it is challenging to attribute the invention of moving averages to a single individual, W. P. Hamilton, a… could lead to another test of the 130-127 support zone. A break below 127 could see a drop toward 120 or lower.
Swing Trading Plan:
- Entry: Buy on a breakoutBreakout patterns occur when a stock price moves beyond a defined level of support or resistance with increased volume, signaling the potential start of a new trend. A breakout ind… above 140 with strong volume.
- Stop Loss: Set at 134 (below recent lows).
- Target 1: 145 (initial profit-taking).
- Target 2: 150-155 if momentumMomentum in stock trading refers to the rate of acceleration of a stock’s price or trading volume. It indicates the strength of a trend and measures how quickly prices are rising o… continues.
- Exit Plan: Trail stop higher as the price moves up.
Long-Term Trading Plan:
- Entry: Buy near the 200-day moving averageThe concept of moving averages dates back to the early 20th century. While it is challenging to attribute the invention of moving averages to a single individual, W. P. Hamilton, a… around 127-130 on pullbacks.
- Stop Loss: Below 120.
- Target 1: 150 (previous highs).
- Target 2: 170-180 over several months if the uptrend continues.
- Exit Plan: Hold as long as the stock remains above the 200-day moving averageThe concept of moving averages dates back to the early 20th century. While it is challenging to attribute the invention of moving averages to a single individual, W. P. Hamilton, a… and fundamentals remain strong.
Past performance is not an indication of future results. This article should not be considered as investment advice. Always conduct your own research and consider consulting with a financial advisor before making any investment decisions. 🧡
Meta Platforms has established itself as one of the most influential tech companies globally, demonstrating remarkable resilience and strategic adaptability. In 2024, its stock price experienced substantial appreciation, reflecting strong financial performance and market confidence in its AI-driven initiatives. Meta’s diversified portfolio, including Facebook, Instagram, and WhatsApp, continues to provide it with a vast user base and advertising revenue.
Beyond social media, Meta is making significant investments in artificial intelligence and virtual reality. The company’s Reality Labs division is focused on developing immersive experiences through the metaverse, a vision that could redefine digital interactions in the coming years. Additionally, potential deregulation under the new U.S. administration may offer favorable conditions for Big Tech, further solidifying Meta’s market dominance. With its expansive digital ecosystem and forward-looking AI ambitions, Meta remains a crucial stock for investors seeking exposure to next-generation technology and advertising growth.
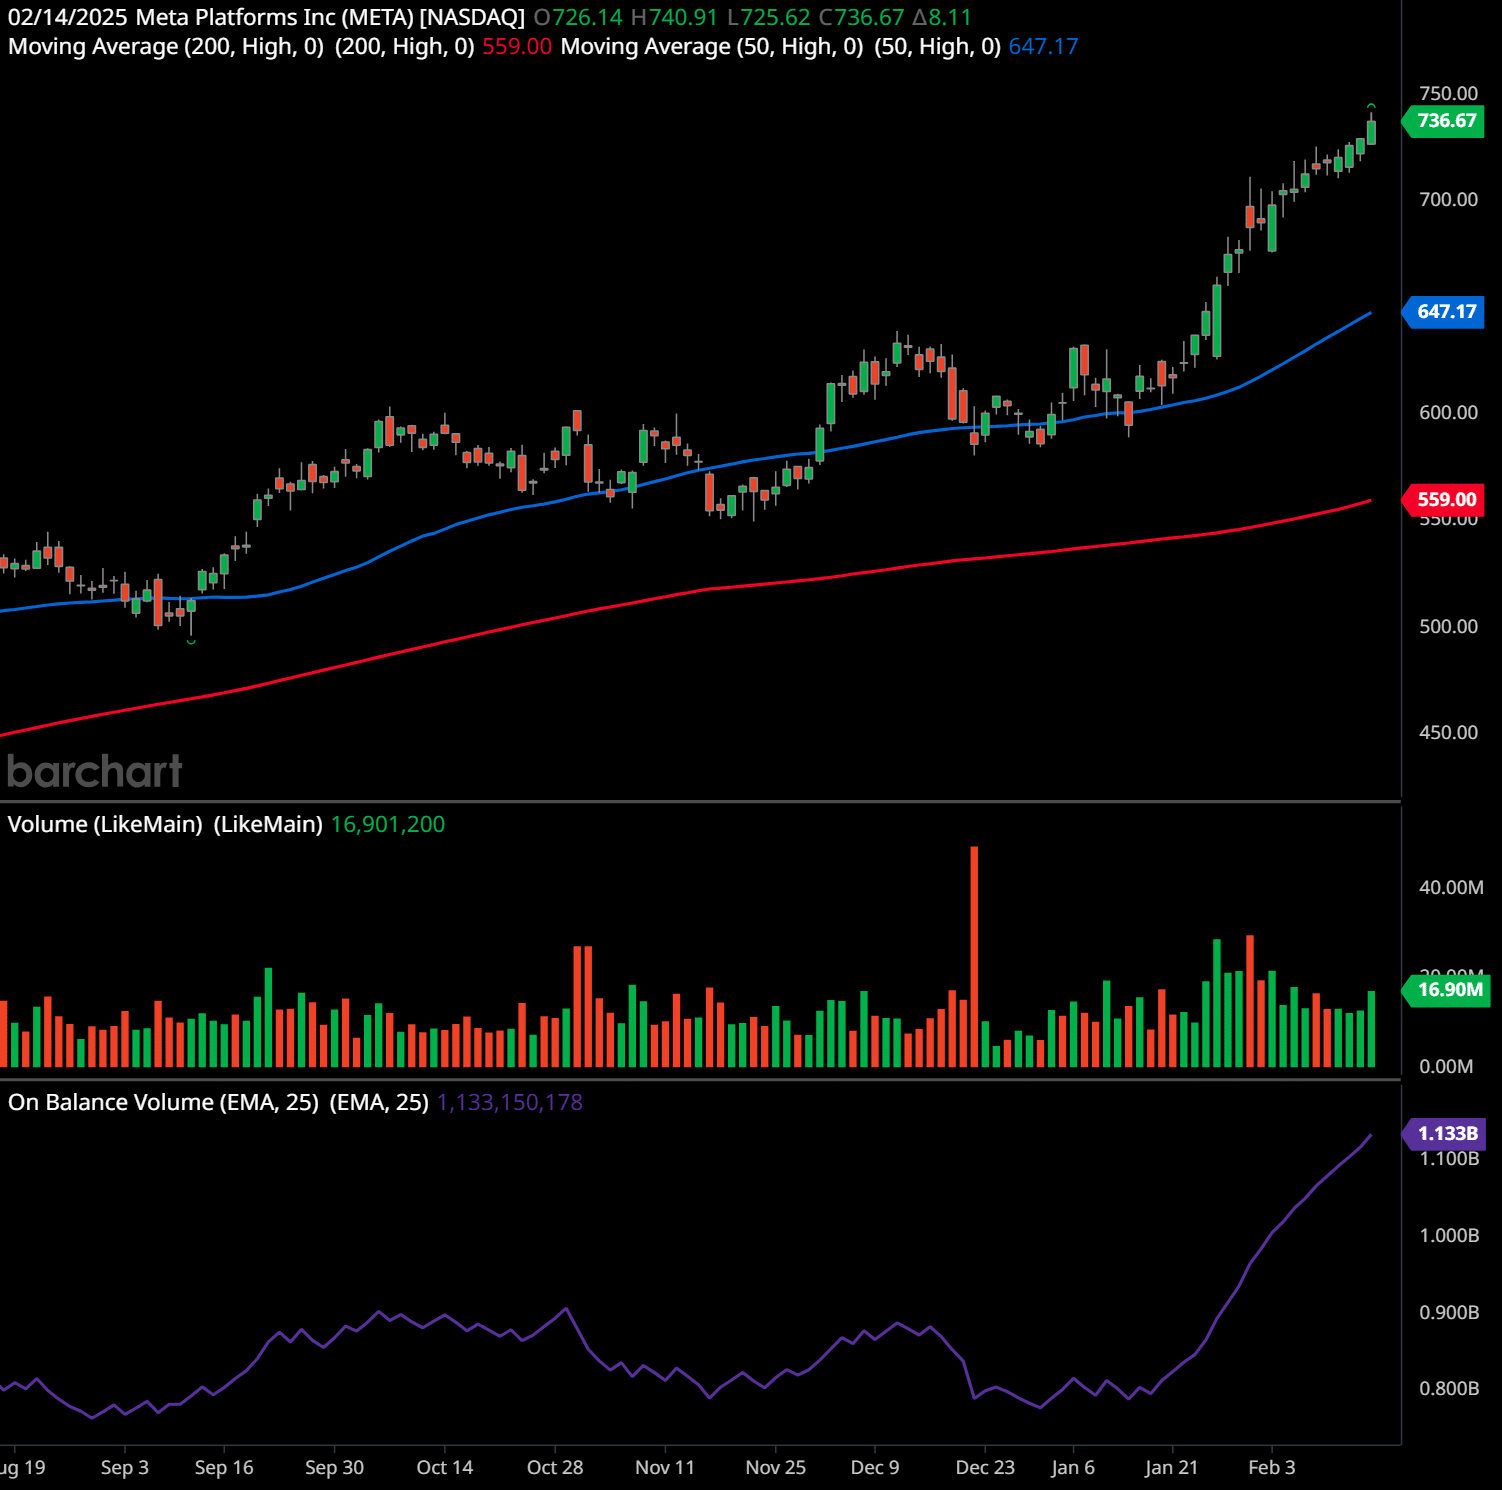
This daily chart of Meta Platforms Inc. (META) shows a strong uptrend, with the stock making consistent higher highs and higher lows. The stock is trading well above its key moving averagesThe concept of moving averages dates back to the early 20th century. While it is challenging to attribute the invention of moving averages to a single individual, W. P. Hamilton, a…, reflecting strong bullish momentumMomentum in stock trading refers to the rate of acceleration of a stock’s price or trading volume. It indicates the strength of a trend and measures how quickly prices are rising o….
Support and Resistance Levels:
- Support Levels: The 50-day moving averageThe concept of moving averages dates back to the early 20th century. While it is challenging to attribute the invention of moving averages to a single individual, W. P. Hamilton, a… at 647.17 serves as the first level of dynamic support. Below that, the 200-day moving averageThe concept of moving averages dates back to the early 20th century. While it is challenging to attribute the invention of moving averages to a single individual, W. P. Hamilton, a… at 559 is a critical long-term support level. Psychological support may also exist around 700, where recent consolidation occurred.
- Resistance Levels: The stock is near its recent highs around 740, making this a key resistance level. A breakoutBreakout patterns occur when a stock price moves beyond a defined level of support or resistance with increased volume, signaling the potential start of a new trend. A breakout ind… above this level could lead to further upside movementThe Movement altcoin is a pioneering cryptocurrency designed to facilitate and promote social and environmental initiatives through blockchain technology. Unlike traditional crypto….
Trend Analysis:
META is in a strong uptrend, characterized by a series of higher highs and higher lows. The price is trading above both the 50-day and 200-day moving averagesThe concept of moving averages dates back to the early 20th century. While it is challenging to attribute the invention of moving averages to a single individual, W. P. Hamilton, a…, which confirms bullish momentumMomentum in stock trading refers to the rate of acceleration of a stock’s price or trading volume. It indicates the strength of a trend and measures how quickly prices are rising o…. The 50-day moving averageThe concept of moving averages dates back to the early 20th century. While it is challenging to attribute the invention of moving averages to a single individual, W. P. Hamilton, a… is sloping upward, indicating continued strength. The price has been rallying strongly since early January, suggesting strong institutional buying.
Chart Patterns and Psychology:
The stock appears to be forming a parabolic rally, where the price is accelerating to the upside without major pullbacks. This type of movementThe Movement altcoin is a pioneering cryptocurrency designed to facilitate and promote social and environmental initiatives through blockchain technology. Unlike traditional crypto… often attracts momentumMomentum in stock trading refers to the rate of acceleration of a stock’s price or trading volume. It indicates the strength of a trend and measures how quickly prices are rising o… traders and short-term speculators, which can lead to increased volatility.
The psychology behind this pattern is FOMO (fear of missing out)—as prices rise, more traders jump in, pushing the price even higher. However, parabolic moves can sometimes end with sharp pullbacks when buying pressure weakens.
Indicator Analysis:
- Volume: Volume has been relatively steady, with occasional spikes, indicating strong buying interest. The most recent push higher has not seen extreme volume, which suggests that buying is still controlled rather than overly euphoric.
- On-Balance VolumeThe On Balance Volume indicator (OBV) is a technical analysis tool used to measure the flow of money into and out of a security over a specified period of time. It is a cumulative … (OBVThe On Balance Volume indicator (OBV) is a technical analysis tool used to measure the flow of money into and out of a security over a specified period of time. It is a cumulative …): The OBVThe On Balance Volume indicator (OBV) is a technical analysis tool used to measure the flow of money into and out of a security over a specified period of time. It is a cumulative … has been trendingUnderstanding market trends is a critical component for businesses conducting industry analysis. For example, Netflix identified early on the growing demand for streaming services … higher, signaling strong accumulation and confirming that the uptrend is supported by increasing demand.
- Moving AveragesThe concept of moving averages dates back to the early 20th century. While it is challenging to attribute the invention of moving averages to a single individual, W. P. Hamilton, a…: The price is well above both the 50-day and 200-day moving averagesThe concept of moving averages dates back to the early 20th century. While it is challenging to attribute the invention of moving averages to a single individual, W. P. Hamilton, a…, reinforcing bullish sentiment.
Stock Price Forecast:
- Bullish Scenario: If META breaks above 740 with strong volume, it could push towards 760-780 in the near term. Further momentumMomentum in stock trading refers to the rate of acceleration of a stock’s price or trading volume. It indicates the strength of a trend and measures how quickly prices are rising o… could even drive the stock past 800 in the coming weeks.
- Bearish Scenario: A pullback to the 700 level is possible if buying pressure slows. If the stock falls below the 50-day moving averageThe concept of moving averages dates back to the early 20th century. While it is challenging to attribute the invention of moving averages to a single individual, W. P. Hamilton, a… at 647, a deeper correction to 600-620 could occur.
Swing Trading Plan:
- Entry: Buy on a breakoutBreakout patterns occur when a stock price moves beyond a defined level of support or resistance with increased volume, signaling the potential start of a new trend. A breakout ind… above 740 with strong volume.
- Stop Loss: Set at 710 (below recent support).
- Target 1: 760 (initial profit-taking).
- Target 2: 780-800 if momentumMomentum in stock trading refers to the rate of acceleration of a stock’s price or trading volume. It indicates the strength of a trend and measures how quickly prices are rising o… continues.
- Exit Plan: Trail stop higher as the price moves up.
Long-Term Trading Plan:
- Entry: Buy near the 50-day moving averageThe concept of moving averages dates back to the early 20th century. While it is challenging to attribute the invention of moving averages to a single individual, W. P. Hamilton, a… (around 650-670) on pullbacks.
- Stop Loss: Below 620.
- Target 1: 780-800 over several months.
- Target 2: 850+ if the uptrend remains intact.
- Exit Plan: Hold as long as the stock remains above the 200-day moving averageThe concept of moving averages dates back to the early 20th century. While it is challenging to attribute the invention of moving averages to a single individual, W. P. Hamilton, a… and fundamentals remain strong.
Past performance is not an indication of future results. This article should not be considered as investment advice. Always conduct your own research and consider consulting with a financial advisor before making any investment decisions. 🧡
Advanced Micro Devices: A Strong Contender in AI and High-Performance Computing
AMD continues to assert itself as a dominant force in the semiconductor space, particularly in the fields of central processing units (CPUs) and GPUs. The company has gained significant traction in recent years, challenging industry leader Intel in the PC and data center markets while simultaneously carving out a competitive position in the AI chip segment.
With its advanced product lineup and ongoing innovation in high-performance computing solutions, AMD is well-positioned to benefit from the growing demand for AI acceleration and cloud-based computing. The company’s strategic expansion into AI processors places it in direct competition with Nvidia, making it a vital player to watch in the evolving semiconductor landscape. As the need for AI-driven processing power continues to rise, AMD’s market share and revenue potential are likely to increase, making it an attractive option for long-term investors.
AMD Trading Plan
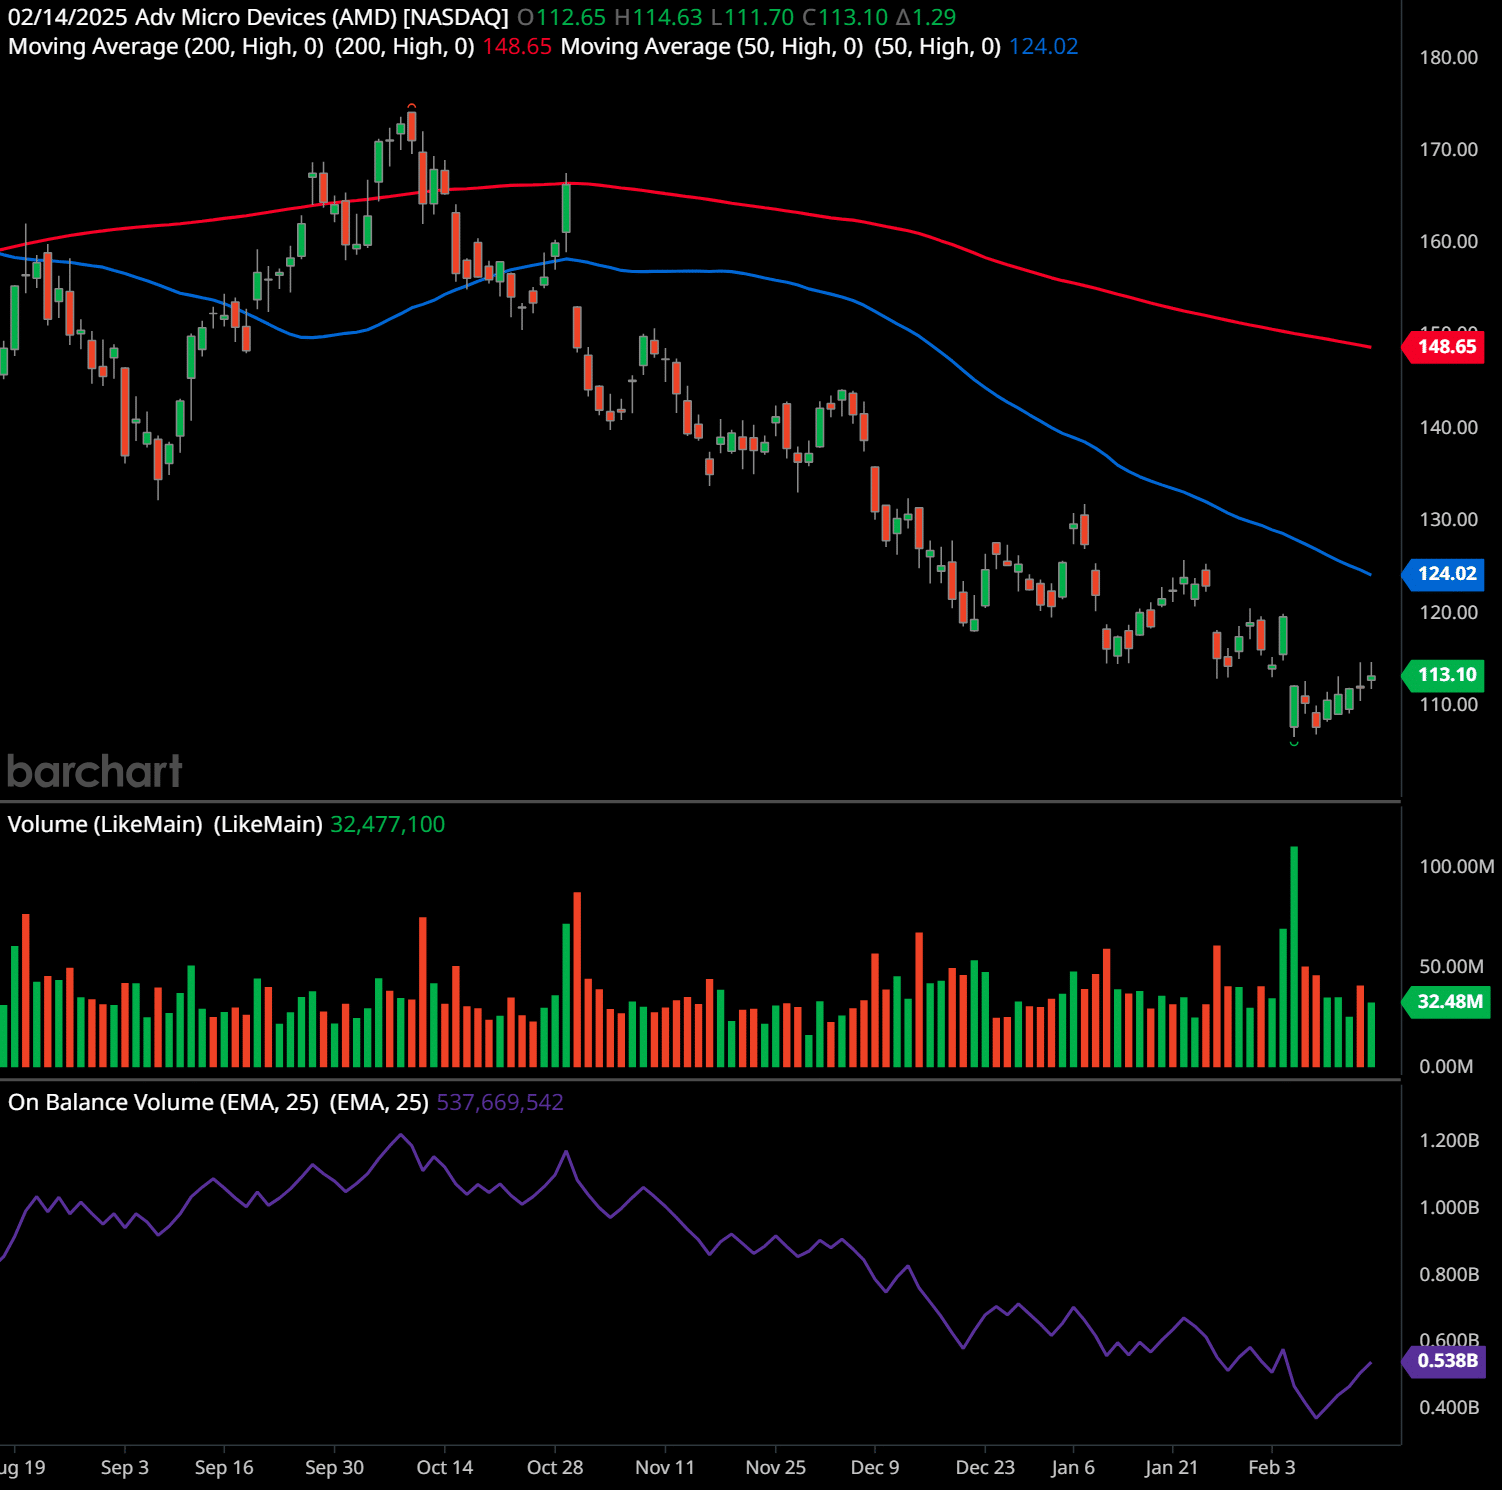
This daily chart of Advanced Micro Devices (AMD) shows a stock in a downtrend, trading below both the 50-day and 200-day moving averagesThe concept of moving averages dates back to the early 20th century. While it is challenging to attribute the invention of moving averages to a single individual, W. P. Hamilton, a…. The price has recently attempted to stabilize around the 110-115 zone after a prolonged decline, but overall momentumMomentum in stock trading refers to the rate of acceleration of a stock’s price or trading volume. It indicates the strength of a trend and measures how quickly prices are rising o… remains weak.
Support and Resistance Levels:
- Support Levels: The stock has found short-term support around 110, which has held over the past few sessions. A break below this level could lead to further downside toward 100, a psychological support level.
- Resistance Levels: The first resistance is at 124.02 (50-day moving averageThe concept of moving averages dates back to the early 20th century. While it is challenging to attribute the invention of moving averages to a single individual, W. P. Hamilton, a…). If the stock moves above this level, the next key resistance is around 148.65 (200-day moving averageThe concept of moving averages dates back to the early 20th century. While it is challenging to attribute the invention of moving averages to a single individual, W. P. Hamilton, a…). A breakoutBreakout patterns occur when a stock price moves beyond a defined level of support or resistance with increased volume, signaling the potential start of a new trend. A breakout ind… above these levels would indicate a trend reversal.
Trend Analysis:
AMD is in a clear downtrend, with lower highs and lower lows since peaking around 170. The 50-day and 200-day moving averagesThe concept of moving averages dates back to the early 20th century. While it is challenging to attribute the invention of moving averages to a single individual, W. P. Hamilton, a… are sloping downward, confirming bearish momentumMomentum in stock trading refers to the rate of acceleration of a stock’s price or trading volume. It indicates the strength of a trend and measures how quickly prices are rising o…. While the stock has shown some short-term stabilization, it remains below key moving averagesThe concept of moving averages dates back to the early 20th century. While it is challenging to attribute the invention of moving averages to a single individual, W. P. Hamilton, a…, which suggests that sellers are still in control.
Chart Patterns and Psychology:
The chart resembles a downtrend continuation pattern, potentially forming a bear flag or descending channel. The recent small rebound is part of a consolidation phase, but unless it breaks above key resistance levels, it is likely a temporary pause before another leg lower.
The trader psychologyTrader psychology refers to the emotions and mental states that influence a trader’s decision-making process in financial markets. Emotions such as fear, greed, hope, and regret … behind this pattern indicates that sellers remain dominant. Many investors who bought at higher levels are likely looking to exit positions at any price recovery, creating selling pressure at resistance levels. Meanwhile, short sellers are watching for breakdowns to continue capitalizing on the downtrend.
Indicator Analysis:
- Volume: The recent bounce has not been accompanied by a strong increase in volume, suggesting weak buying interest.
- On-Balance VolumeThe On Balance Volume indicator (OBV) is a technical analysis tool used to measure the flow of money into and out of a security over a specified period of time. It is a cumulative … (OBVThe On Balance Volume indicator (OBV) is a technical analysis tool used to measure the flow of money into and out of a security over a specified period of time. It is a cumulative …): OBVThe On Balance Volume indicator (OBV) is a technical analysis tool used to measure the flow of money into and out of a security over a specified period of time. It is a cumulative … is still in a downtrend, confirming that selling pressure outweighs buying interest. This indicates that the recent bounce might not have enough strength for a sustained reversal.
- Moving AveragesThe concept of moving averages dates back to the early 20th century. While it is challenging to attribute the invention of moving averages to a single individual, W. P. Hamilton, a…: The price remains well below both the 50-day and 200-day moving averagesThe concept of moving averages dates back to the early 20th century. While it is challenging to attribute the invention of moving averages to a single individual, W. P. Hamilton, a…, reinforcing bearish sentiment. Until the stock reclaims these levels, the downtrend remains intact.
Stock Price Forecast:
- Bullish Scenario: If AMD breaks above 124 with strong volume, it could attempt to test the 200-day moving averageThe concept of moving averages dates back to the early 20th century. While it is challenging to attribute the invention of moving averages to a single individual, W. P. Hamilton, a… near 148. A sustained breakoutBreakout patterns occur when a stock price moves beyond a defined level of support or resistance with increased volume, signaling the potential start of a new trend. A breakout ind… above 148 would signal a long-term trend reversal.
- Bearish Scenario: If AMD fails to hold above 110, it could retest 100 or lower. A continued breakdown could push the stock toward 90.
Swing Trading Plan:
- Entry: Buy if the stock breaks above 124 with strong volume.
- Stop Loss: Set at 110 to protect against further downside.
- Target 1: 135 (initial profit-taking).
- Target 2: 148 (200-day moving averageThe concept of moving averages dates back to the early 20th century. While it is challenging to attribute the invention of moving averages to a single individual, W. P. Hamilton, a…).
- Exit Plan: If the price falls below 110, cut losses quickly.
Long-Term Trading Plan:
- Entry: Buy near strong support at 100-110, but only if the price stabilizes.
- Stop Loss: Below 95, as a break below 100 could indicate further downside.
- Target 1: 148 (200-day moving averageThe concept of moving averages dates back to the early 20th century. While it is challenging to attribute the invention of moving averages to a single individual, W. P. Hamilton, a…).
- Target 2: 160-170 if the long-term trend reverses.
- Exit Plan: Hold as long as the stock remains above the 50-day moving averageThe concept of moving averages dates back to the early 20th century. While it is challenging to attribute the invention of moving averages to a single individual, W. P. Hamilton, a… after reclaiming it.
Past performance is not an indication of future results. This article should not be considered as investment advice. Always conduct your own research and consider consulting with a financial advisor before making any investment decisions. 🧡
Tech Leaders Set to Drive Market Growth in 2025
The technological revolution, particularly in AI and semiconductors, is reshaping the global economy, and companies like Nvidia, Meta Platforms, and AMD are leading the charge. Each of these firms offers compelling growth prospects driven by innovation, market dominance, and strategic investments in emerging technologies.
For investors seeking exposure to the industries shaping the future, these three stocks represent strong opportunities heading into 2025. Nvidia’s unparalleled AI chip leadership, Meta’s expanding AI and social media empire, and AMD’s growing presence in high-performance computing collectively reinforce the importance of following these companies closely. As the digital transformation accelerates, these stocks are well-positioned to deliver substantial long-term returns.
Lance Jepsen is the senior personal finance writer for Guerilla Stock Trading who has spent more than 25 years covering the stock market and economics. In addition, Lance has worked as a private stock analyst for a number of high worth individuals.
Trading and Investment Ideas:
Source link