When Is The Best Time To Buy The Long Strangle Options?
We generally prefer to sell options to collect premium income from time decay.
However, there are times when it can be advantageous to buy options instead.
In today’s example, we’ll look at the long strangle, a strategy that profits from large price movements and increases in volatility.
A long strangle involves buying an out-of-the-money call and a put option.
This is not to be confused with the short strangle, which consists of selling an out-of-the-money call and a put.
Both long strangle options are on the expiration cycle.
In our example, the options have about 30 days to expiration, and we are buying options on SPY, which represents the S&P 500.
Contents
Date: Oct 28, 2025
Price SPY @ $685.76
Buy one contract Nov 28 SPY $670 put @ $5.15
Buy one contract Nov 28 SPY $700 call @ $4.96
Debit: -$1011
The price of the put option is $5.15 per share.
Since we are buying one contract, which represents 100 shares, we are paying $515 for the put option.
Similarly, we paid $496 for the call option.
The net debit for the trade is $1,011 if you add the costs of the put and call options.
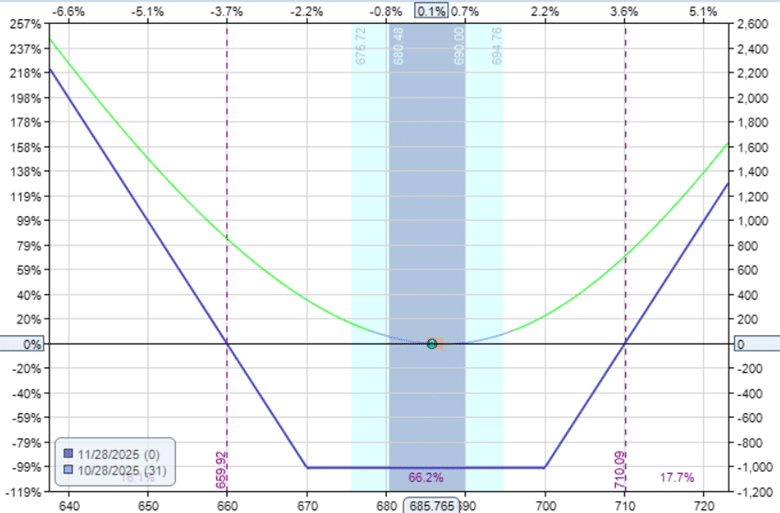
As shown in the risk graph below, the debit paid for the trade will equal the maximum potential loss.
No matter what happens, you can not lose more than $1011, even if both options that you purchased decay in value to zero at expiration.
When that happens, we say that the options expired worthless.
The reason this trade loses money each passing day (with all other factors excluded) is that time decay is working against us.
In terms of the option Greeks, the “theta” is negative.
A negative theta means that each day that passes, the position loses value if the underlying price doesn’t move significantly.
If you hold this trade all the way to expiration and the price doesn’t move below the strike price of $670 or above $700, you could incur the maximum loss of $1011.
Obviously, no one wants to lose the maximum.
So most traders will not hold to expiration if they see that the price is not moving.
At what point will the trader get out?
At what point does the trader “say uncle”?
Saying ‘uncle’ is an American expression for admitting defeat or giving up, especially after being challenged.
The expression may seem strange until you imagine two children in a playful strangle (pun intended).
And the one being overwhelmed cries out, “Uncle, uncle.
Please help me!”
Some traders will exit the trade if they have lost half of the original cost of the strangle.
Others will exit at the halfway point in the duration of the trade.
Others one quarter.
It is up to the trader.
Each trader’s “uncle point” is different.
Let’s see how our example trade plays out.
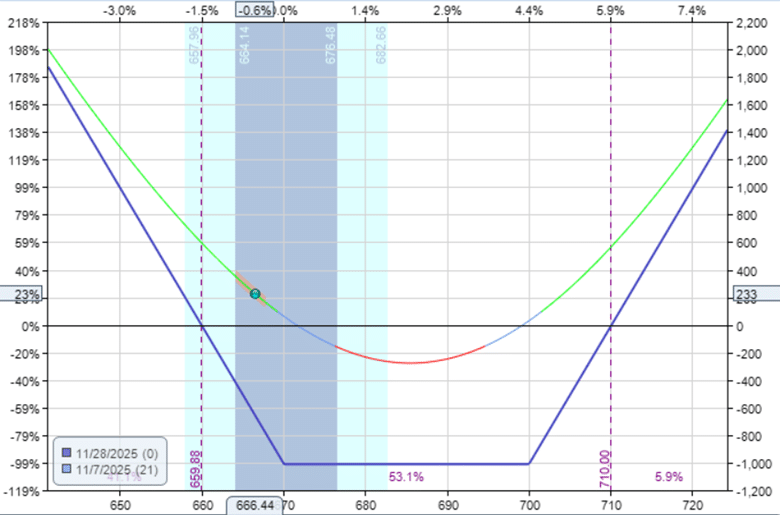
On the morning of Nov 7th, which is 10 days into the trade (about one-third of the duration), the risk graph shows that the price of SPY has dropped from $685 to $666 (a somewhat ominous number in Western culture).
However, a 19-point drop in SPY is favorable for the long strangle.
Because large directional moves in the underlying (either up or down) are profitable for the long strangle.
It is typical that as the market drops, the implied volatility increases.
This, too, is fortunate for the trade.
For those who inspect the option Greeks of this trade, the long strangle has positive vega, meaning that an increase in volatility will increase the position’s value (with other factors remaining the same).
This combination of a large enough price movement and a rise in volatility caused the value of our strangle to increase to $1244.
A trader selling the strangle to exit the position now would result in a profit of $233, or roughly 23% of the capital at risk.
Because…
$1244 – $1011 = $233
And
$233 / $1011 = 23%
Roughly speaking, a greater than one standard deviation move is considered significant.
The price move of SPY during our trade exceeded a one-standard-deviation move for that time frame.
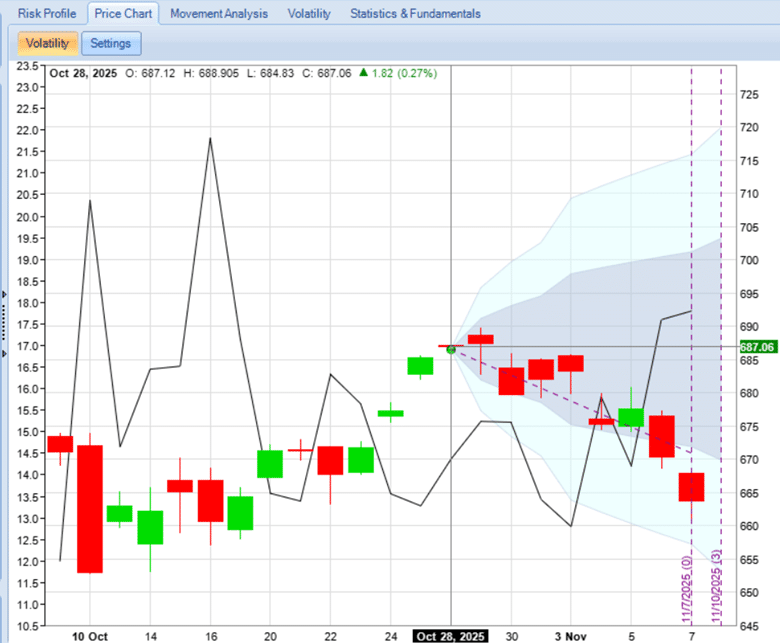
We know this because the candle on November 7th fell outside the gray-shaded cone area in the graph below, which represents moves within one standard deviation.
The blue-shaded cone area would represent a two-standard deviation move.
The black, swiggly line in the chart above shows volatility.
And we see that volatility increased from October 28th to November 7th.
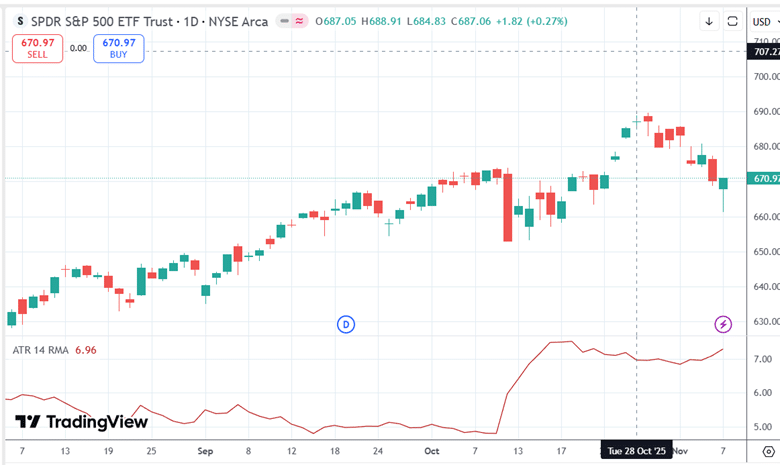
An indicator that tells how much an underlying asset is moving is the ATR (average true range).
Here we see that the ATR for SPY was at seven at the start of the trade on October 28th.
SPY was moving on average 7 points per day, equivalent to the SPX moving 70 points per day.
This is relatively high compared to the ATR in September, which was hovering around 5.
A high ATR means SPY is making big moves, which is again good for the long strangle.
You can see that on November 7th, the ATR has even increased a bit.
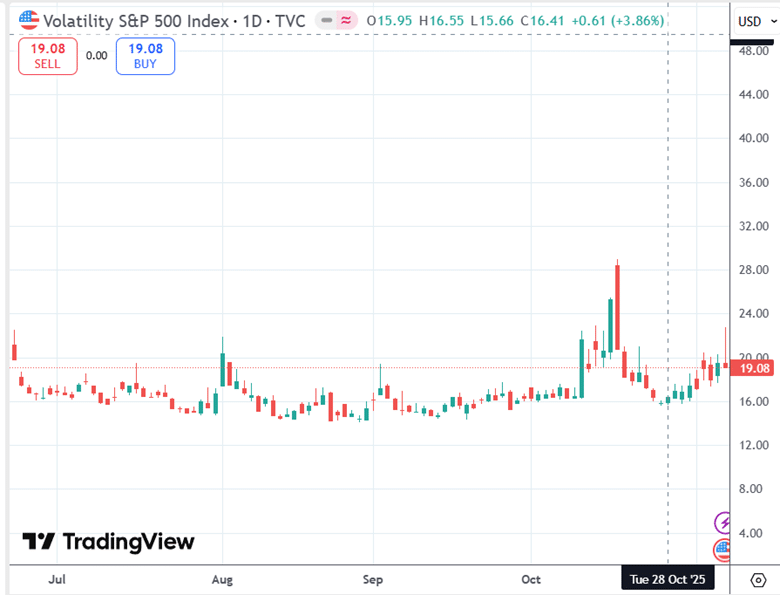
The VIX represents the volatility of the S&P 500.
This is a good measure of SPY’s implied volatility.
The VIX was 16 on October 28th at the start of the trade.
And the VIX on November 7th increased to 19.
It sometimes makes sense to buy a long strangle when implied volatility is low and ATR is high.
Low implied volatility means option prices are relatively inexpensive during such periods.
The strangle would profit if volatility increased.
ATR high means the underlying is making large moves, which is also beneficial for the long strangle.
If the market then makes a large move (especially one greater than one standard deviation) in either direction, the long strangle can deliver a strong return.
We hope you enjoyed this article on the best time for long strangle options.
If you have any questions, please send an email or leave a comment below.
Trade safe!
Disclaimer: The information above is for educational purposes only and should not be treated as investment advice. The strategy presented would not be suitable for investors who are not familiar with exchange traded options. Any readers interested in this strategy should do their own research and seek advice from a licensed financial adviser.

Source link