Bitcoin Back in the Red as Analysts Warn $60K is “Liquidation Trigger”

Bitcoin Back in the Red as Analysts Warn $60K is “Liquidation Trigger”


  • Bitcoin is hovering near the US$60,000 psychological level, where approximately US$1.24 billion in “put” options are clustered, creating a potential trigger for market volatility.
  • Analysts warn that dropping below this zone could force lenders to automatically sell collateral from Bitcoin-backed loans, potentially causing a “deleveraging” wave toward the US$40,000 range.
  • Following a 47% decline from its October peak, Standard Chartered has slashed its year-end 2026 forecast to US$100,000, citing the risk of a further slide to US$50,000 before a potential recovery.

Bitcoin’s (BTC) options market and loan structures are concentrating attention on the US$60K (AU$91K) level. 

A recent report by Bloomberg, citing Deribit data, shows that the largest cluster of open interest is in put options that pay off if Bitcoin falls below US$60K, with open interest in US$60K puts at about US$1.24 billion (AU$1.90 billion).

Just beneath that zone sits Bitcoin’s 200-week moving average, a widely watched long-term technical support level, currently a little above US$58,000 (AU$88,740).

BTC/USD. Source: TradingView. 

Market participants said a drop into that area could trigger automatic collateral sales tied to Bitcoin-backed loans. 

Maxime Seiler, chief executive of digital-asset trading firm STS Digital, told Bloomberg that many loan agreements are structured so lenders sell collateral as prices fall toward those thresholds, potentially accelerating deleveraging.

Similarly, IG Australia analyst Tony Sycamore said a sustained break below the US$60K zone could open the door to a deeper pullback toward the high US$40K (AU$56.4K). A further dynamic comes from options positioning. If Bitcoin slides toward or below US$60K, traders who sold puts may hedge by selling spot Bitcoin or futures, adding pressure.

Read more: Lawmakers Grill SEC Chair Over Crypto Enforcement Pullback and Trump Ties

A Rough Couple Of Weeks For Bitcoin (BTC)

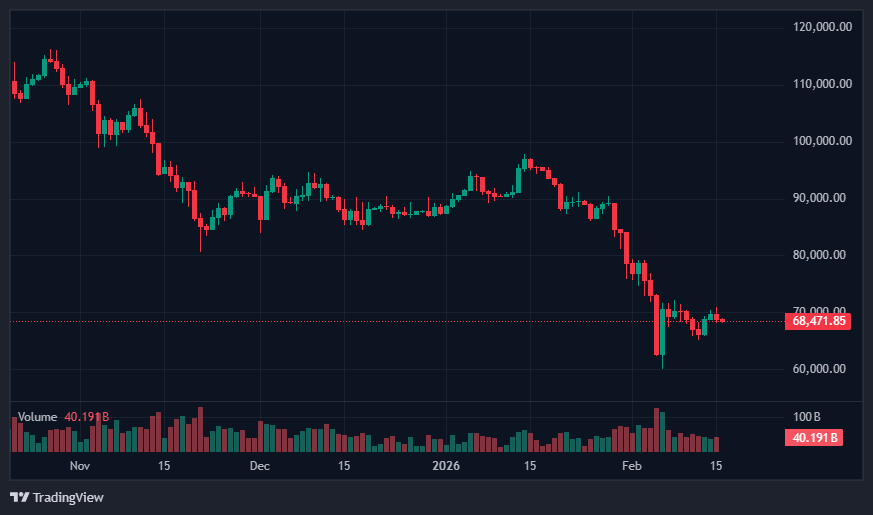
Bitcoin briefly tested the US$60,000 area on Feb. 6 before recovering. It was trading around US$67K (AU$102K) at the start of the week, down about 47% from its October peak. 

The broader reversal began late last year, when more than US$19 billion (AU$29.07 billion) in bullish bets were wiped out, and selling intensified again in early February, erasing post-election gains after Donald Trump’s re-election.

Bearish calls have also increased. Crypto News Australia recently reported that Michael Burry warned of a potential self-reinforcing “death spiral.” Similarly, Standard Chartered cut its end-2026 Bitcoin forecast to US$100K (AU$153K), down from prior projections, and said Bitcoin could fall to US$50K (AU$76.5K) before stabilising. 

In crypto-related equities, Coinbase Global shares rose in early trading as investors looked past a fourth-quarter revenue miss, though the stock remains down roughly 50% over the past 12 months.

Related: BlackRock Executive Says 1% Crypto Allocation in Asia Could Unlock Trillions


Source link

Similar Posts

  • BSV Association announces LCX listing advancing MiCA aligned compliance

    Homepage > News > Business > BSV Association announces LCX listing advancing MiCA aligned compliance ZUG, Switzerland, Feb. 19, 2026 — BSV Association today announced that BSV will be listed on LCX, one of Europe’s leading regulatory compliant cryptocurrency exchanges and token-to-stablecoin platforms. The listing marks a significant milestone in BSV Association’s strategy to align…

  • Thailand SEC Approves Country’s First Bitcoin ETF, Which Is Targeting Wealthy and Institutional Investors

    In a landmark move for the Thai financial market, the Securities and Exchange Commission (SEC) has given the green light to One Asset Management (ONEAM) to launch the country’s first Bitcoin exchange-traded fund (ETF). The ONE Bitcoin ETF Fund of Funds Unhedged and not for Retail Investors (ONE-BTCETFOF-UI) is set to be distributed between May…

  • Cetbit: The Leading Licensed and Trusted Cryptocurrency Exchange for Active Traders

    Press Release In the rapidly evolving digital asset industry, trust, security, and regulatory compliance are the cornerstones of a reliable cryptocurrency exchange. Cetbit has established itself as a global leader in crypto trading, providing a fully licensed and transparent platform that meets the highest industry standards. With millions of traders worldwide relying on its services,…

  • XRP Completes Golden Cross on Four-Hour Chart, But the Price Presents a Twist – U.Today

    XRP, one of the leading altcoins on the cryptocurrency market, has completed a golden cross on the four-hour chart.  The technical signal suggests the potential for an upside in the price outlook of the coin on the broader market. XRP’s $1.40 resistance continues to cap gains Notably, a golden cross forms when a short-term moving…

  • 了解加密货币交易中的未平仓合约和交易量 | BitMEX Blog

    在交易加密货币时,理解一些有助于分析市场趋势的关键概念至关重要。你经常会听到两个重要的术语:交易量和未平仓合约。这些指标虽然主要用于期货市场,但它们能提供关于交易活动和市场情绪的宝贵见解。 让我们来详细了解一下。 什么是交易量? 交易量是指在特定时间段内交易的单位(如币或代币)总数。当你查看日线图时,你会看到交易量在图表底部以垂直条形表示。每个条形显示了当天交易的单位数量。 日交易量:一天内交易的单位总数。这是查看交易量最常见的方式。 周交易量:如果你查看周线图,交易量条形表示整周的交易总量。 交易量之所以重要,是因为它显示了特定加密货币的活跃程度和关注度。更高的交易量表示更多的交易活动,这可能预示着更强的关注度或动能。 什么是未平仓合约? 未平仓合约是期货市场中使用的术语,指尚未结算的未平仓合约总数。每份合约都涉及一个买方和一个卖方。 日未平仓合约:在图表上绘制为交易量条形上方的线,显示每天结束时未平仓合约的总数。 未平仓合约有助于交易者了解资金流入或流出市场的情况。未平仓合约增加意味着正在创建更多新合约,表明有新资金进入市场,而未平仓合约减少则表示合约正在平仓,意味着资金正在离开市场。 未平仓合约如何变化 理解未平仓合约如何变化是解读市场趋势的关键。以下是一个简单的分解: 新多头和新空头:买方和卖方都在开立新仓位,未平仓合约增加。 新多头和旧多头:买方开立新仓位,而卖方平仓旧仓位。未平仓合约保持不变。 旧空头和新空头:卖方开立新仓位,而买方平仓旧仓位。未平仓合约保持不变。 旧空头和旧多头:买方和卖方都平仓其仓位,未平仓合约减少。 通过观察每天结束时未平仓合约的净变化,交易者可以判断是否有新资金进入市场或现有资金正在流出,这有助于预测市场趋势。 解释交易量和未平仓合约的一般规则 记住一些关键规则有助于解释交易量和未平仓合约: 交易量和未平仓合约增加:表明当前价格趋势(无论是上涨还是下跌)的强劲持续。 交易量和未平仓合约减少:表明当前价格趋势可能正在减弱或接近尾声。 解释所有市场中的交易量 交易量衡量价格变动背后的强度。以下是如何在不同情景中解释交易量: 在上涨趋势中:随着价格上涨,交易量应增加,并在价格回调时减少。这种模式证实了上涨趋势。 在下跌趋势中:随着价格下跌,交易量应增加,并在价格反弹时减少。这种模式证实了下跌趋势。 如果交易量与价格趋势背离(例如,价格在交易量下降时上涨),这可能表明买卖压力正在减弱,预示着潜在的反转。 交易量作为确认指标 交易量可以确认价格走势和模式。例如…… 头肩顶:如果价格形成头肩顶模式,并且在上涨时交易量下降,在下跌时交易量增加,则证实了该模式。 双顶和三顶:连续的高点,交易量较轻,随后出现较重的下跌活动,证实了这些模式。 三角形模式:在形成过程中交易量逐渐下降,并在突破点出现交易量激增,证实了该模式。 交易量先于价格 交易者认为交易量的变化往往先于价格变化。这意味着上涨趋势或下跌趋势中交易量的损失可以预示即将到来的反转,甚至在价格实际改变方向之前。 通过关注交易量和未平仓合约,交易者可以更好地了解市场动态,并做出更明智的交易决策。请记住,这些工具与其他指标和分析方法结合使用时最有效。 撇开理论不谈,如果您希望开始在 BitMEX 上交易加密货币衍生品或现货,您可以在 这里 找到我们所有现有产品。有关更多交易教育资源,请访问此 页面 。 想第一时间了解我们的新上架、产品发布、豪礼大放送等,我们邀请您加入我们的 在线社区 并与其他交易者联系。如需了解最新信息,您还可以关注我们的 Twitter ,或阅读我们的 博客 和 网站公告 。 Related Source link

  • Will Solana Price Hit $150 as Mangocueticals Partners With Cube Group on $100M SOL Treasury?

    Solana price remains a focal point as it responds to both institutional alignment and shifting technical structure. Notably, corporate treasury strategies have been intersected with the changing price behavior. The dynamics of the chart indicate a transition period and not continuation.. Mangocueticals and Cube Group Formalize a $100M SOL Treasury Strategy The institutional relevance of…

Leave a Reply

Your email address will not be published. Required fields are marked *