Crypto PANIC: Market Tanks as Trump’s Tariffs Spark Investor Fear!

The cryptocurrencyA cryptocurrency is a digital or virtual form of currency that uses cryptography for security. Unlike traditional currencies issued by central banks, cryptocurrencies operate on de… market experienced a significant downturn today, with Bitcoin plunging below $86,000 as macroeconomicAt its core, macroeconomics is the branch of economics that examines the behavior, performance, and structure of an economy as a whole. Unlike microeconomics, which focuses on indi… uncertainties intensified. The latest price drop is closely tied to the economic policies of U.S. President Donald Trump, particularly his aggressive tariff threats against trading partners. This development has triggered a broader market sell-off, driving the global crypto market cap down nearly 3% to $2.84 trillion. The Crypto Fear & Greed Index also reflected mounting investor anxiety, plummeting to a reading of 20, signaling extreme fear.
Bitcoin and Altcoins Face Sharp Declines
Bitcoin witnessed a 3.39% decline, settling at $85,679—its lowest point since November 2024. The flagship cryptocurrencyA cryptocurrency is a digital or virtual form of currency that uses cryptography for security. Unlike traditional currencies issued by central banks, cryptocurrencies operate on de… had previously reached an all-time high of over $106,000 in January 2025, driven by post-election optimism. However, ongoing macroeconomicAt its core, macroeconomics is the branch of economics that examines the behavior, performance, and structure of an economy as a whole. Unlike microeconomics, which focuses on indi… concerns have reversed much of those gains. Ethereum also faced significant losses, tumbling 5.84% to $2,337.72, deepening its 27% decline over the past month. Other major altcoins were not spared from the market turmoil, with XRP plummeting 7.71% and Solana shedding 2.33% as part of a sector-wide sell-off.
The sharp downturn reflects growing investor unease about the economic climate, particularly as fears surrounding Trump’s trade policies continue to grip financial markets. CryptocurrenciesA cryptocurrency is a digital or virtual form of currency that uses cryptography for security. Unlike traditional currencies issued by central banks, cryptocurrencies operate on de…, often viewed as a hedge against inflationInflation refers to the rate at which the overall price levels of goods and services increase, gradually reducing purchasing power over time. It is commonly measured using indices … and economic instability, are instead experiencing volatility in response to the unpredictability of global trade relations.
Trump’s Tariff Policies Stoke Market Uncertainty
Trump’s latest tariff threats have contributed significantly to the downturn in the crypto sector. His administration’s stance on international trade has amplified macroeconomicAt its core, macroeconomics is the branch of economics that examines the behavior, performance, and structure of an economy as a whole. Unlike microeconomics, which focuses on indi… instability, leading to capital outflows from riskier assets such as cryptocurrenciesA cryptocurrency is a digital or virtual form of currency that uses cryptography for security. Unlike traditional currencies issued by central banks, cryptocurrencies operate on de…. The tariff rhetoric contrasts starkly with the optimism that initially followed his election victory, during which Bitcoin soared to record highs. As the administration signals a hardline approach toward trade relations, investor sentiment in digital assets has suffered, with increased skepticism about the near-term stability of the crypto market.
Despite this broader negative sentiment, some market segments exhibited momentary bullish activity. Following Trump’s reaffirmation of U.S.-UK trade relations, Bitcoin’s trading volume against the British pound surged by 15%, with 30,000 BTC changing hands per hour. This temporary spike lifted the Crypto Fear & Greed Index to 55, indicating a brief shift toward market optimism. However, this uptick was short-lived, as the broader economic landscape continued to weigh on investor sentiment, causing the index to drop back into extreme fear territory.
Technical and On-Chain Metrics Suggest Mixed Signals
Amid the sell-off, Bitcoin’s networkIn the context of cryptocurrency, a network refers to the interconnected system of computers, nodes, and software that work together to support and maintain the functioning of a sp… activity displayed resilience. The number of active Bitcoin addresses climbed to 850,000, up from 820,000, indicating increased blockchainA blockchain is a decentralized, distributed ledger technology (DLT) that records transactions in a secure, transparent, and tamper-proof manner. Each transaction is grouped into a… engagement despite declining prices. This suggests that while traders may be offloading their holdings in response to macroeconomicAt its core, macroeconomics is the branch of economics that examines the behavior, performance, and structure of an economy as a whole. Unlike microeconomics, which focuses on indi… uncertainty, on-chain activity remains strong, reflecting continued interest in the asset.
Ethereum, meanwhile, showed mixed technical signals. Its 50-day moving averageThe concept of moving averages dates back to the early 20th century. While it is challenging to attribute the invention of moving averages to a single individual, W. P. Hamilton, a… stood at $3,000, a level that remains above its current price, signaling potential lingering bullish support despite the recent sell-off. Analysts believe that while Ethereum continues to experience downward pressure, its ability to maintain a relatively strong moving averageThe concept of moving averages dates back to the early 20th century. While it is challenging to attribute the invention of moving averages to a single individual, W. P. Hamilton, a… suggests that underlying market demand could persist.
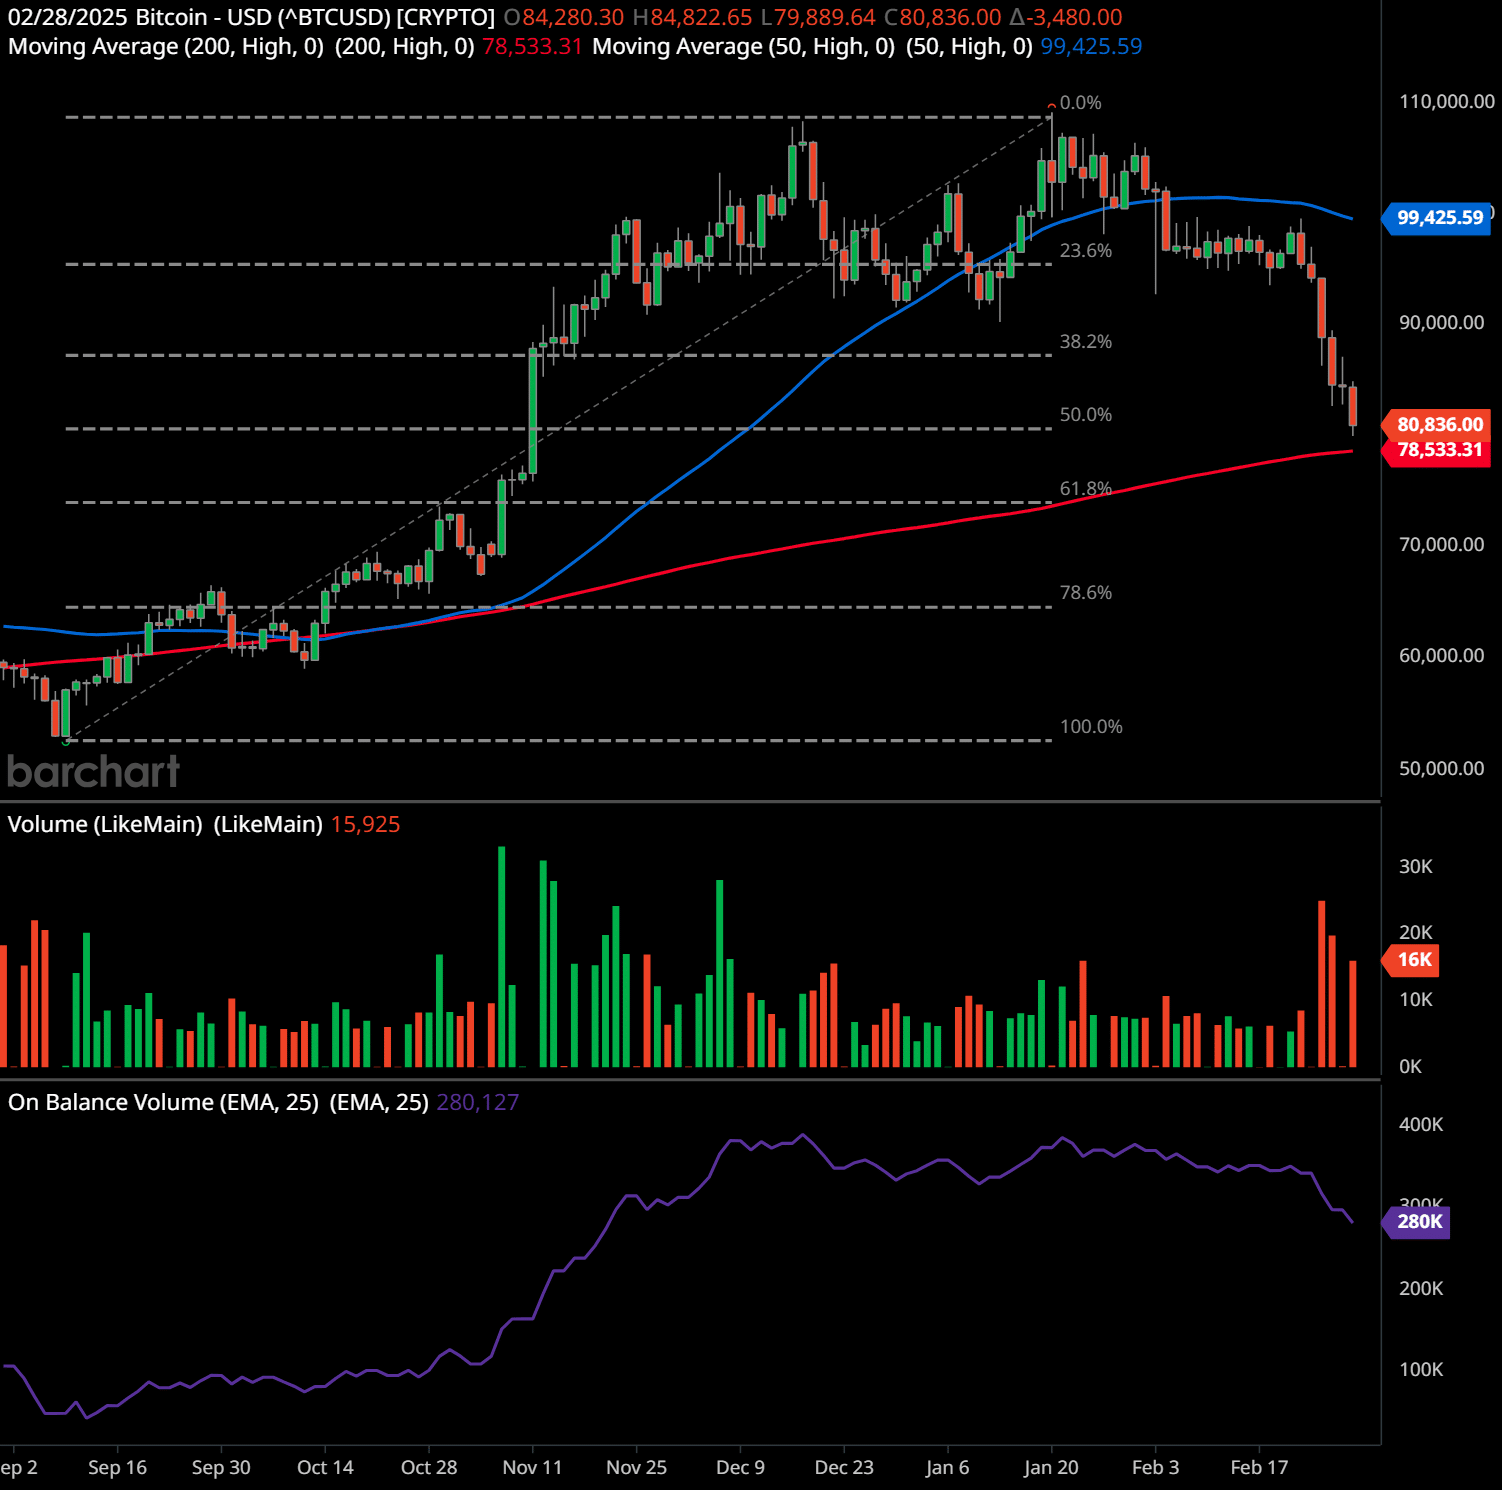
Bitcoin Trading Plan
This Bitcoin daily chart presents several key technical indicators, price levels, and trader psychologyTrader psychology refers to the emotions and mental states that influence a trader’s decision-making process in financial markets. Emotions such as fear, greed, hope, and regret … insights.
Support and Resistance Levels:
- Support Levels:
- The 200-day moving averageThe concept of moving averages dates back to the early 20th century. While it is challenging to attribute the invention of moving averages to a single individual, W. P. Hamilton, a… (MA) at approximately $78,533 is acting as a crucial dynamic support level. Bitcoin is approaching this level, making it a key area to watch for a potential bounce.
- The 61.8% Fibonacci retracementFibonacci retracement is a fundamental tool in the arsenal of technical analysts and traders. Rooted in the mathematical principles of the Fibonacci sequence, this technique is wid… level near $75,000 is another significant support. This level is commonly seen as a strong support zone in uptrends.
- Below this, the $70,000 psychological level and the 78.6% retracement near $65,000 would be deeper support zones.
- Resistance Levels:
- The 50-day moving averageThe concept of moving averages dates back to the early 20th century. While it is challenging to attribute the invention of moving averages to a single individual, W. P. Hamilton, a… (MA) at $99,425 is currently a strong resistance level. Bitcoin previously traded above it but has since fallen below. If the price moves back up, this could act as a major resistance point.
- The previous swing high around $110,000 is another key resistance. A break above this level would indicate strong bullish momentumMomentum in stock trading refers to the rate of acceleration of a stock’s price or trading volume. It indicates the strength of a trend and measures how quickly prices are rising o….
Chart Patterns and Psychology:
This chart indicates a pullback within a larger uptrend. Bitcoin made a strong move up, forming higher highs and higher lows, but it has now broken below the 50-day MA, suggesting a short-term bearish trend. The price is currently testing support levels, and if it holds, we could see a bounce back toward previous highs.
The psychology behind this pattern reflects profit-taking and increased caution among traders. The drop in On-Balance VolumeThe On Balance Volume indicator (OBV) is a technical analysis tool used to measure the flow of money into and out of a security over a specified period of time. It is a cumulative … (OBVThe On Balance Volume indicator (OBV) is a technical analysis tool used to measure the flow of money into and out of a security over a specified period of time. It is a cumulative …) suggests that selling pressure has increased, possibly due to traders securing profits or reacting to market news. However, if strong support holds, long-term buyers may step in, leading to another leg up.
Trend Analysis and Indicators:
- The trend is weakening in the short term, as indicated by the price breaking below the 50-day MA.
- The 200-day MA is still rising, indicating that the long-term trend is still bullish.
- Volume has increased on the recent downward move, which suggests strong selling pressure, but if buyers step in near key support levels, a reversal could occur.
- On-Balance VolumeThe On Balance Volume indicator (OBV) is a technical analysis tool used to measure the flow of money into and out of a security over a specified period of time. It is a cumulative … (OBVThe On Balance Volume indicator (OBV) is a technical analysis tool used to measure the flow of money into and out of a security over a specified period of time. It is a cumulative …) has been declining, which is a bearish signal, indicating that selling pressure is currently dominant.
Price Forecast:
- Bullish Case: If Bitcoin holds the 200-day MA or the 61.8% Fibonacci retracementFibonacci retracement is a fundamental tool in the arsenal of technical analysts and traders. Rooted in the mathematical principles of the Fibonacci sequence, this technique is wid…, it could bounce back toward $90,000-$100,000 in the short term. A break above $100,000 would re-establish bullish momentumMomentum in stock trading refers to the rate of acceleration of a stock’s price or trading volume. It indicates the strength of a trend and measures how quickly prices are rising o…, potentially leading to new all-time highs.
- Bearish Case: If Bitcoin breaks below $75,000, it could trigger further selling pressure, possibly testing $70,000 or even $65,000 before finding solid support.
Swing Trading Plan:
- Entry: Look for a bounce near the $78,500-$75,000 support zone with a confirmation candle (bullish engulfing, hammer, or reversal pattern).
- Stop Loss: Below $74,000 to limit downside riskIn stock and crypto trading, risk refers to the possibility of losing some or all of the capital invested in a trade. It represents the uncertainty about the future performance of ….
- Target: Initial target at $90,000, secondary target at $100,000.
- Exit Strategy: If price fails to hold support and breaks below $75,000, consider stopping out early.
Long-Term Trading Plan:
- Entry: Accumulate near strong support zones like $75,000-$78,500, with additional buys near $70,000 if the price dips further.
- Stop Loss: Below $65,000, as a breakdown below this level could indicate a deeper correction.
- Target: Long-term target of $110,000+, aligning with the prior high and potential new highs.
- Exit Strategy: Re-evaluate holdings if the macroeconomicAt its core, macroeconomics is the branch of economics that examines the behavior, performance, and structure of an economy as a whole. Unlike microeconomics, which focuses on indi… environment changes or if Bitcoin breaks below the long-term trend.
Past performance is not an indication of future results. This analysis should not be considered as investment advice. Always conduct your own research and consider consulting with a financial advisor before making any investment decisions. 🧡
Implications for the Crypto Market
The latest decline highlights the vulnerability of the cryptocurrencyA cryptocurrency is a digital or virtual form of currency that uses cryptography for security. Unlike traditional currencies issued by central banks, cryptocurrencies operate on de… market to geopolitical and macroeconomicAt its core, macroeconomics is the branch of economics that examines the behavior, performance, and structure of an economy as a whole. Unlike microeconomics, which focuses on indi… shifts. Bitcoin and other digital assets have long been regarded as alternative financial instruments that can provide stability during economic uncertainty. However, today’s downturn underscores the extent to which broader financial trends and government policies can influence their valuation.
While the short-term outlook remains uncertain, some key metrics indicate that resilience in the market could emerge over time. The rise in active addresses and continued institutional interest in cryptocurrencyA cryptocurrency is a digital or virtual form of currency that uses cryptography for security. Unlike traditional currencies issued by central banks, cryptocurrencies operate on de… exchange-traded funds (ETFs) suggest that major investors are not abandoning the market entirely. However, the persistence of tariff tensions and ongoing geopolitical risks could prolong instability, keeping investors cautious in the near term.
As the market continues to react to global economic policies, traders and investors will be closely monitoring upcoming developments, particularly any shifts in trade policy that could further impact the trajectory of digital assets. Until greater clarity emerges on the macroeconomicAt its core, macroeconomics is the branch of economics that examines the behavior, performance, and structure of an economy as a whole. Unlike microeconomics, which focuses on indi… front, Bitcoin and the broader cryptocurrencyA cryptocurrency is a digital or virtual form of currency that uses cryptography for security. Unlike traditional currencies issued by central banks, cryptocurrencies operate on de… market are likely to remain highly sensitive to external financial and political pressures.
Lance Jepsen is the senior personal finance writer for Guerilla Stock Trading who has spent more than 25 years covering the stock market and economics. In addition, Lance has worked as a private stock analyst for a number of high worth individuals.
Trading and Investment Ideas:
Source link