Blog Post: Day 30 of $QQQ short term down-trend; 837 US stocks at new yearly lows, 7 highs and 1 at ATH; T2108=5; $SPY back to last green line top, see weekly charts and gap below 4 wk avg.
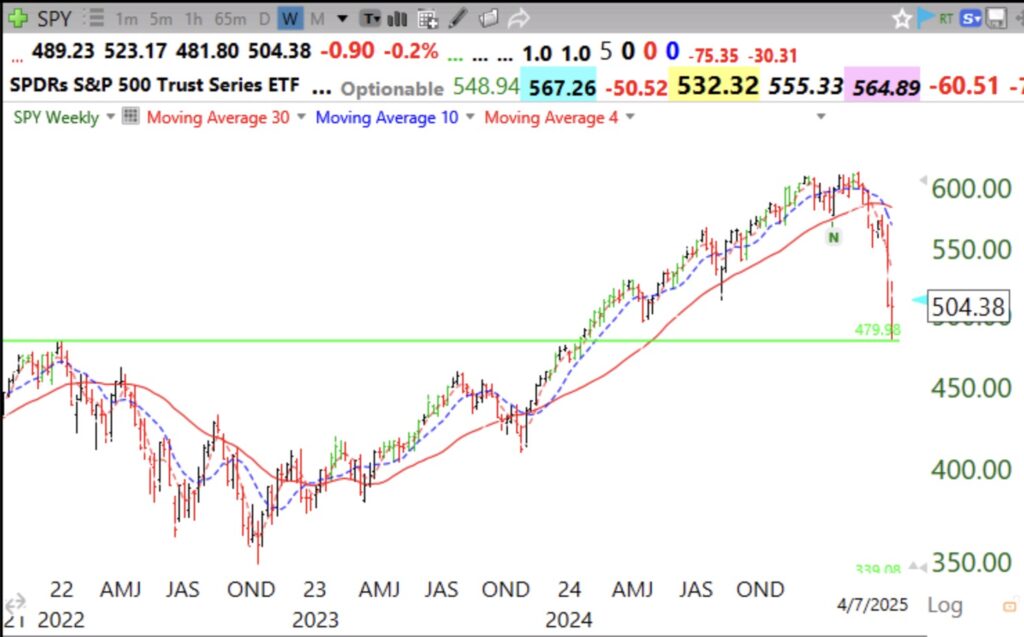
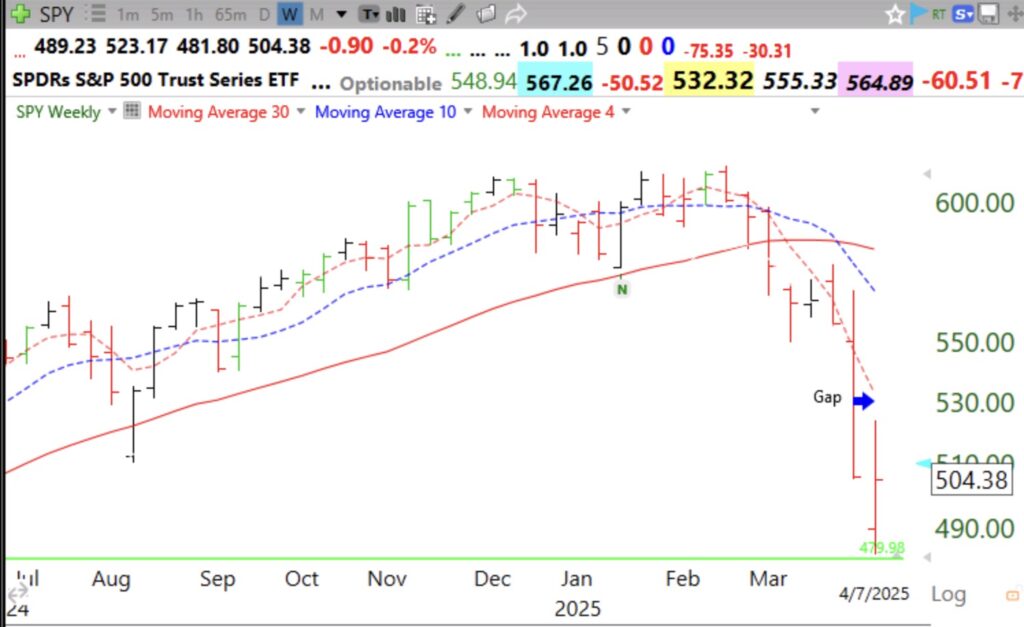
A close below the green line would be a failure of the GLB in January 2024 and very ominous. Second weekly chart shows SPY has a gap below 4 wk average. Rebound to kiss 4 wk avg is likely. After it does, down-trend may resume. See second chart.
Related
Source link