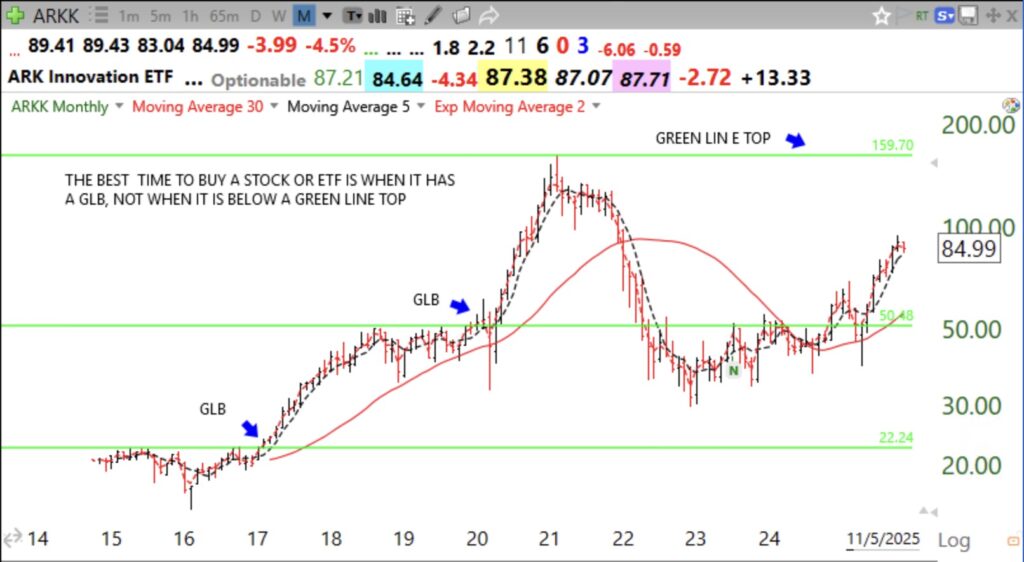
Blog Post: Day 52 of $QQQ short term up-trend: GMI back to 6. We want to buy a stock or ETF when it has had a GLB, to ATHs. See monthly chart example of $ARKK.
A green line is drawn on a monthly chart at the highest price bar (ATH) that is not exceeded for at least 3 months (bars). It shows a stock strong enough to reach an ATH that then rests for at least 3 months. When it breaks out to a new ATH (green line breakout, GLB) it can signal the beginning of a major move. A stock that reached an ATH and then declines so a new green line can be drawn needs to overcome all of the sellers who bought at higher prices (equals overhead supply). It may never do so. It therefore is a sign of strength when a stock can have a GLB to a new ATH. See the successful GLB tracker on this blog for a few examples of stocks that rose after a GLB.